Planning decision times published
An Official Statistics Publication for Scotland
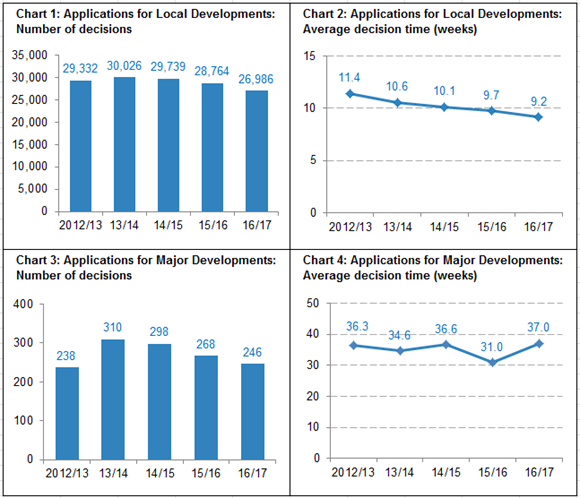
Local Development decisions were quicker in 2016/17. The average decision time for Local Developments (26,986 applications) in 2016/17 was 9.2 weeks, four days quicker than the average of 9.7 weeks in the previous year and the quickest annual figure since the start of this data collection in 2012/13. Local housing applications were decided in an average of 12.7 weeks, one week quicker than the previous year (13.7 weeks).
Major Development decisions were slower in 2016/17. The average decision time for Major Developments (246 applications) in 2016/17 was 37.0 weeks, six weeks slower than the average of 31.0 weeks in the previous year and the slowest annual figure since the start of this data collection in 2012/13. Major housing applications were decided in an average of 44.9 weeks, more than four weeks slower than the previous year (40.6 weeks).
For the year 2016/17 the overall rate of approvals for all types of application was 94.2% and the delegation rate was 95.3%. These are the highest rates over the past seven years.
Statistics on annual and quarterly planning performance in Scotland have been released today by Scotland’s Chief Statistician.
Annual Trends (excludes legacy cases and processing agreements)
Key Findings for the year 2016/17 (figures exclude pre-3rd August 2009 legacy cases and applications subject to processing agreements)
Reduction in planning applications decided in 2016/17 compared with previous four years.
•The number of Local Development decisions in 2016/17 totalled 26,986, a decrease of 6% (1,778 applications) from the previous year. This drop was largely due to fewer decisions for housing, electricity generation, householder, business & industry and other developments.
•The number of Major Development decisions in 2016/17 totalled 246, a decrease of 8% (22 applications) from 2015/16. There were decreases across all categories of development apart from those for housing and business & industry.
•In contrast, the number of applications that were subject to processing agreements increased by 121% from 680 in 2015/16 to 1,503 in 2016/17. There were 1,194 local applications (4% of all local applications) and 95 major applications (28% of all major applications) that were subject to processing agreements in 2016/17.
The overall average decision time for Local Developments is the quickest annual figure since the start of this data collection in 2012/13.
•Local Development decisions were quicker by an average of 4 days per application compared with 2015/16 (9.2 weeks in 2016/17 compared with 9.7 weeks in 2015/16) and were the quickest since the start of this data collection in 2012/13.
•Improvements were seen in average decision times for most categories of Local Developments apart from electricity generation, AMSCs (Approval of Matters Specified in Conditions), waste management and telecommunications. In particular, the average decision time for local housing developments was 12.7 weeks for 2016/17, one week quicker than the previous year (13.7 weeks).
•A total of 22 out of 34 planning authorities have reported improvements in their average decision times for Local Developments in 2016/17 compared to 2015/16.
The overall average decision time for Major Developments is the slowest annual figure since the start of this data collection in 2012/13.
•Major Development decisions were slower by an average of 6 weeks per application compared with 2015/16 (37.0 weeks in 2016/17 compared with 31.0 weeks in 2015/16) and were the slowest since the start of this data collection in 2012/13.
•Decisions for most categories of Major Developments were slower apart from minerals and waste management applications. In particular, the average decision time for major housing developments was 44.9 weeks for 2016/17, more than four weeks slower than the previous year (40.6 weeks).
Average figures based on a relatively small number of Major Development applications can be skewed by a few lengthy decisions.
•Almost 69% of Major applications in 2016/17 were decided in a time quicker than the average of 37.0 weeks.
Quarterly trends are reported in the full statistical publication.
The figures released today were produced in accordance with professional standards set out in the Code of Practice for Official Statistics.
Background
The figures presented in this Statistical News Release exclude pre 3rd August 2009 cases and any applications concluded through the use of a processing agreement between the developer and the local authority, where an agreement on timescales for decisions can be made either at the beginning of the application process or at a later stage. Also, some applications exclude time periods in which particular delays have been outwith the control of planning authorities. Further information on these types of applications is available in the full statistical publication.
Local Developments include applications for household extensions and loft conversions etc, smaller housing and retail developments, as well as various other types of Local Developments.
Major Developments include applications for developments of 50 or more homes, as well as certain waste, water, transport and energy-related developments, larger retail developments, and other types of Major Developments.
Schemes of Delegation identify who will make the planning authority's decision on different types of planning application, whether it is an appointed officer or elected members. This also influences the route for any subsequent appeal. These schemes are required by legislation and are available on the websites of each planning authority. The delegation rate measures the proportion of planning decisions that are made by appointed officers.
Read the full statistical publication containing a range of annual and quarterly trend information on average decision times by development types and information on delegation and approval rates, appeals and local reviews, and enforcement activity.
An explanatory document providing background information on the planning performance framework is also available.
Official statistics are produced in accordance with professional standards – more information on the standards of official statistics in Scotland can be accessed at: http://www.gov.scot/Topics/Statistics/About
There is a problem
Thanks for your feedback
