2019 Aggregate Minerals Survey for Scotland
Collation of the results of the 2019 Aggregate Minerals Survey for Scotland
Planning permissions and refusals
Information has been collected on the numbers of planning applications granted and refused permission in 2019 to supply wholly, or in part, aggregate minerals, and the amounts of mineral that these contained (Tables 15 to 26). Information was supplied by Planning Authorities. Data are presented by site type, e.g. new quarry, borrow pit or extension.
‘Permissions’ granted by way of an amendment to a condition, for example extending the time limit of an existing valid permission or an increase in output, are not included. This is because in these cases the permission did not provide additional reserves. In addition, refusals of the above applications are not included since the loss of the reserves, and also any reduction in reserves flowing from any modification of permission granted, are already accounted for in the reserves figure supplied by quarry operators in their survey return.
Table 16 shows the total number of planning applications granted permission during 2019 by region, and the amounts of mineral they contained. Total reserves of sand and gravel granted planning permission in 2019 were 6.7Mt located in 11 sites. Total reserves of crushed rock granted planning permission in 2019 were 17.7Mt located in 18 sites.
Reserves of sand and gravel and crushed rock for aggregates granted permission is shown by site type and designated area in Tables 22 to 25. The majority of planning permissions granted were extensions to existing sites (six for sand and gravel and ten for crushed rock). No reserves of sand and gravel or crushed rock were granted permission in National Parks in 2019. Total reserves granted in National Scenic Areas were 2.7Mt all of which were sand and gravel.
Planning permission information on aggregates sites located within areas of land allocated for mineral extraction (allocated site, preferred area, area of search) in the PAs development plan is shown in Table 26. Total reserves of aggregate mineral granted permission during 2019 in sites located within areas allocated for mineral extraction in the relevant PA development plan were 1.6Mt for sand and gravel (24% of total sand and gravel reserves permitted) and 2.3Mt for crushed rock (13% of total crushed rock reserves permitted).


Map 7 caption:
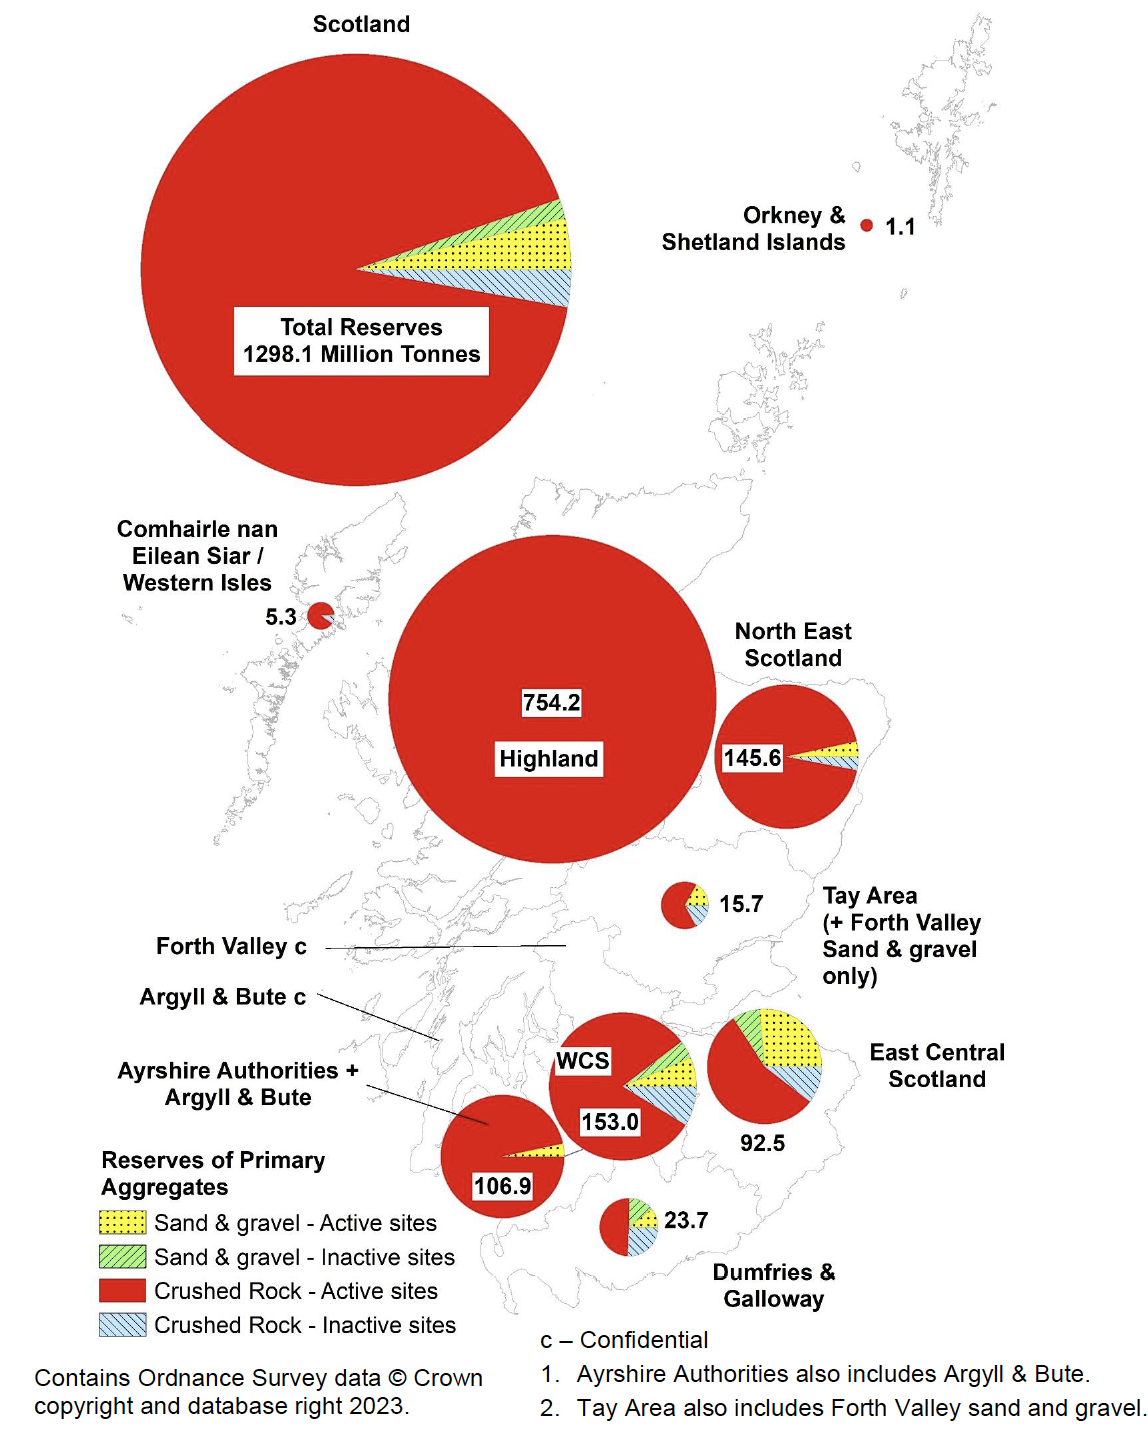
‘c – Confidential
1. Ayrshire Authorities sales also includes Argyll & Bute sales.
2. Tay Area sales also includes Forth Valley sand and gravel sales.
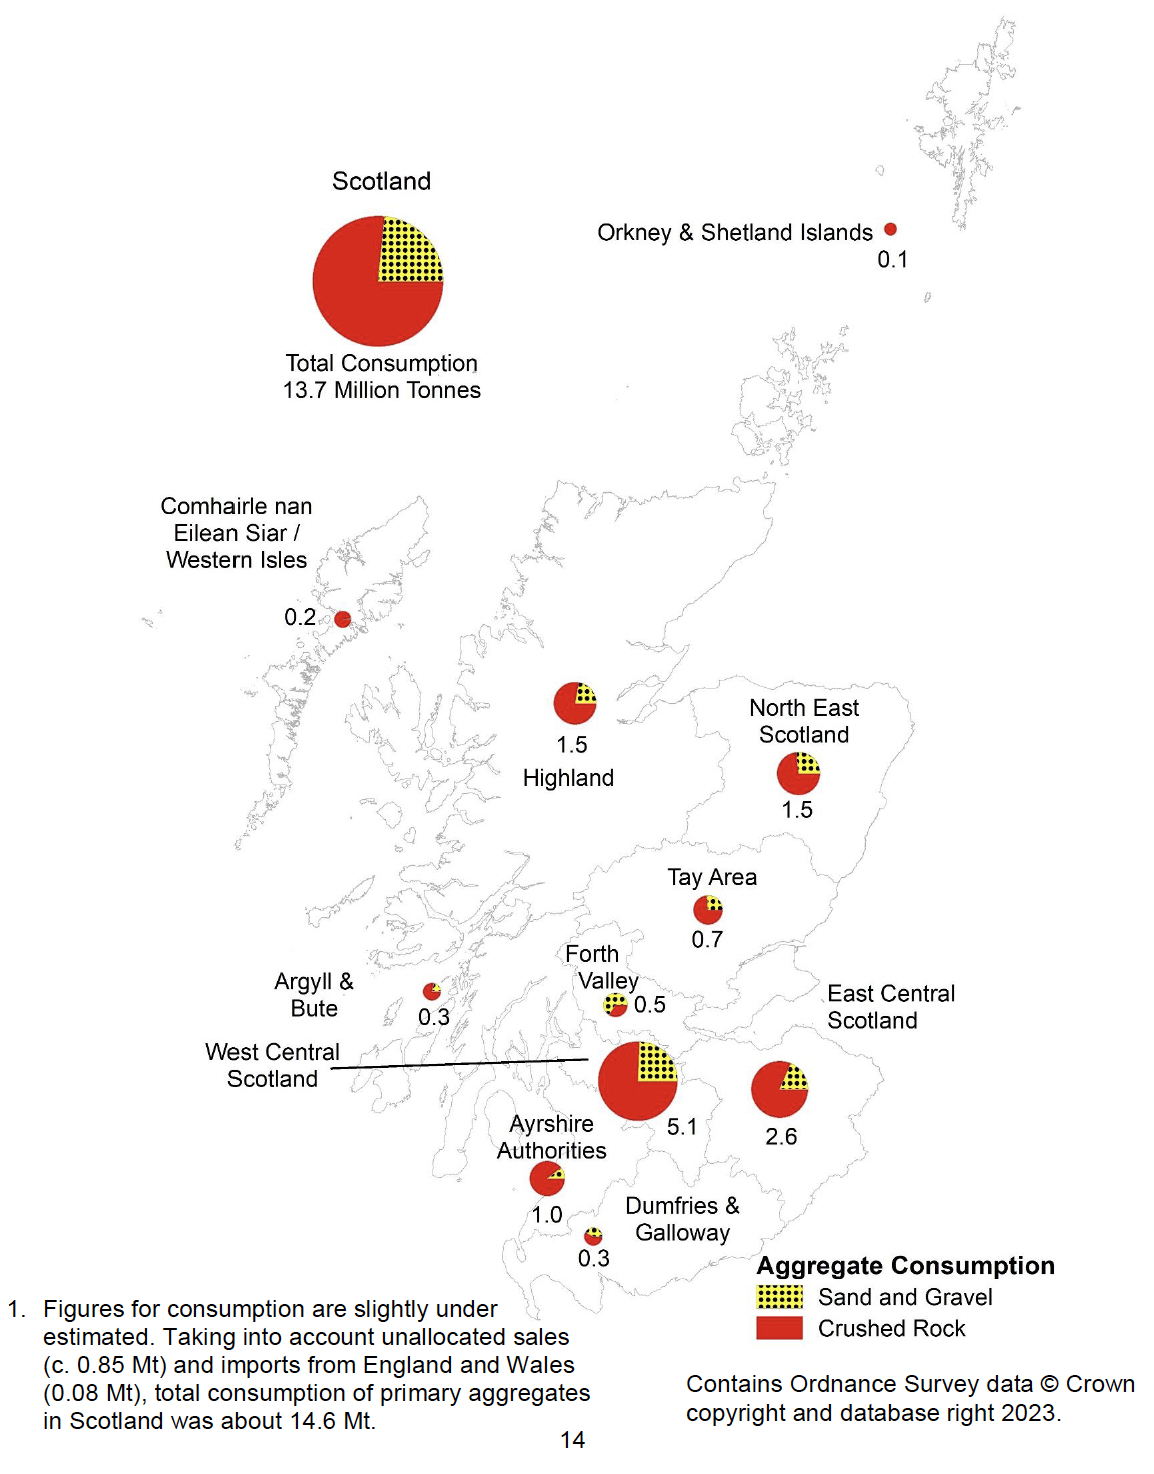
3. Figures for consumption are slightly under estimated. Taking into account unallocated sales (c. 0.85 Mt) and imports from England and Wales (0.08 Mt), total consumption of primary aggregates in Scotland was about 14.6 Mt.
Contact
Email: Robert.Souter@gov.scot
There is a problem
Thanks for your feedback