Alcohol and Drug Partnerships (ADP) 2022/23 Annual Survey
This publication reports on responses to the annual survey of Alcohol and Drug Partnerships (ADPs) in Scotland for 2022/23. Its main aim is to evidence progress of the National Mission by providing information on the activity undertaken by ADPs.
2. Main Findings
2.1 Demographics and response rates
Responses were received from 29 of the 30 ADPs in Scotland.[1] It is important to note that ADP areas vary considerably by size, population and demographics. A breakdown of these areas by deprivation profiles is provided in Appendix A, and an urban/rural breakdown is provided in Appendix B.
Twenty-seven ADP responses were signed off at the ADP level and twenty were signed off at the Integrated Joint Board (IJB) level. Some ADPs were unable to provide IJB sign-off of their response prior to publication of this report due to meetings being held out with the timescale for reporting.
2.2 Data and Surveillance
All but two ADPs (93%) reported that drug death review groups were in place in 2022/23, while two thirds of ADPs (66%) had drug trend monitoring groups or early warning systems in place (Figure 1). Groups or structures for the surveillance and monitoring of alcohol-related harms were less common, with 21% of ADPs having alcohol harms groups in place and just 7% reporting having alcohol death audits in place. The latter figures may be an underestimate as some ADPs reported that alcohol deaths were reviewed as part of their area’s drug death review group, and there was also mention of ‘alcohol death review groups’ which were not specifically asked about in this survey.
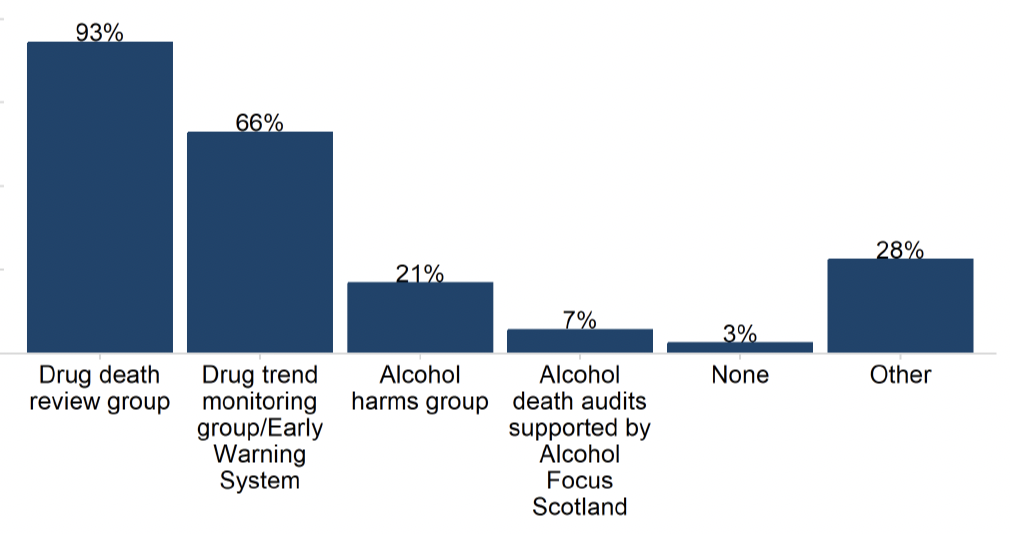
In addition, a quarter of ADPs (28%) said they had ‘Other’ surveillance and monitoring systems in place, which included additional multi-agency groups such as drug death prevention groups and other public health surveillance tools.
The majority (69%) of ADPs reported that Chief Officers for Public Protection receive feedback from drug death reviews. Moreover, 9 out of 10 ADPs (90%) reported having local processes in place for the monitoring and surveillance of alcohol and drugs harms or deaths to record lessons learnt and how these are implemented.
2.3 Workforce
There was a wide range in the size of the drug and alcohol services workforce reported by ADPs (1 WTE to 519 WTEs, median 52.4 WTE). However, only 66% of ADPs had access to this information for their area. The wide range in the reported size of drug and alcohol services workforce statistics may be a result of the variation in both the size and needs of local populations served by the drug and alcohol services workforce in different ADP areas. A median vacancy total of 5.0 WTEs across drug and alcohol services was reported.
ADPs reported that they employed an average of 3.1 whole-time equivalent (WTE) staffing resource routinely dedicated to their ADP support team as at 31 March 2023. The average number of vacancies reported was 0.4 WTEs. When asked about the type of roles/support that they felt their ADP support team might need locally, most ADPs indicated that dedicated project management and business support for various administrative tasks (e.g. contract management) was needed. Most ADPs also identified a specific need for analytical support. Reasons identified for requiring analytical support varied from conducting specific analysis (e.g. Medication Assisted Treatment (MAT) standards experiential data), to contributing more generally to reporting on drug and alcohol deaths or treatment outcomes.
ADPs reported that additional resource might be needed to provide support in specific areas, including the ongoing implementation of MAT standards, community engagement, lived experience, prevention and workforce development.
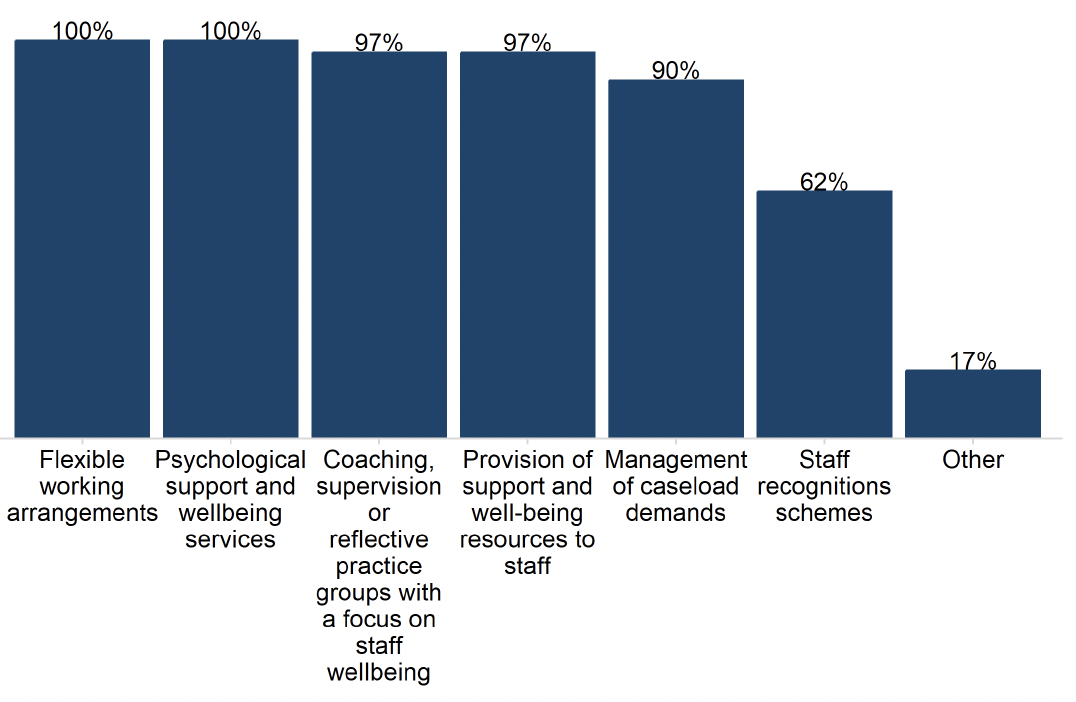
All ADPs reported a range of activities having been undertaken in their ADP area to improve and support workforce wellbeing (volunteers as well as salaried staff) (Figure 2). For example, all ADPs offered both flexible working arrangements and psychological support and wellbeing services. Almost all ADPs also reported having undertaken coaching, supervision or reflective practice groups with a focus on staff wellbeing, and provision of support and wellbeing resources to staff (both 97%), and management of caseload demands activities (90%). Staff recognition schemes were the least commonly reported activity (62%).
2.4 Participation of people with Lived and Living Experience
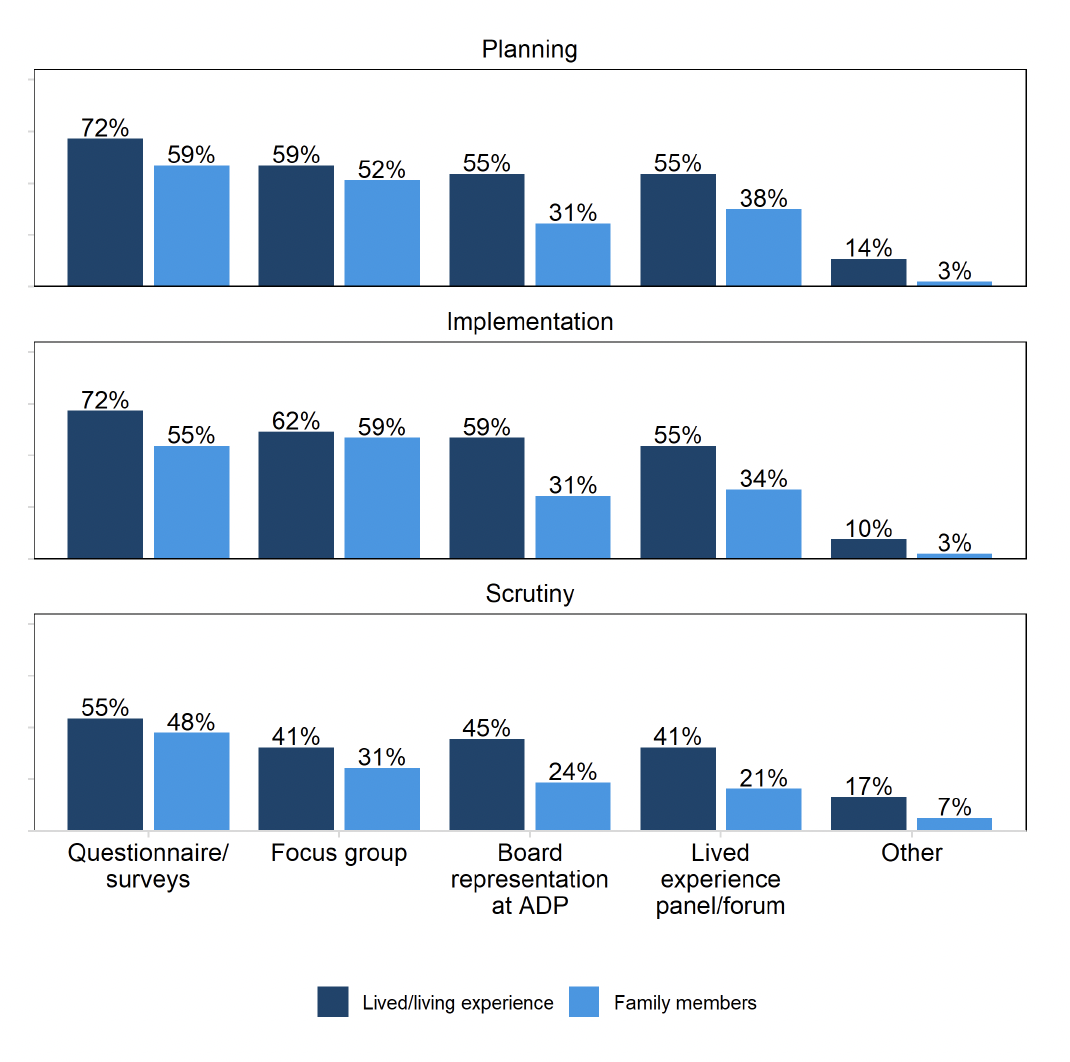
All ADPs reported evidence of some level of involvement of people with lived/living experience and family members within the ADP structure, with higher rates for people with LLE compared to family members (Figure 3). 72% of ADPs reported employing questionnaires and surveys to incorporate feedback from people with LLE during the planning stage (e.g. prioritisation and funding decisions) and implementation stage (e.g. commissioning, service design) – these figures were 59% and 55% respectively for family members. Over half of ADPs also involved people with LLE in planning and implementation via focus groups (59% and 62%, respectively), board representation on the ADP (55% and 59%, respectively) and panels or forums (55% for both).
Generally, ADPs reported fewer opportunities for people with LLE and family members to get involved within the ADP structure during the scrutiny phase (e.g. monitoring and evaluation of services) compared to the planning and implementation phases. Under ‘Other’ methods of inclusion, ADPs reported involvement in their development days and involving individuals as part of research projects such as reviews and scoping studies.
Activities to enable the involvement of LLE or family members within the ADP structure which were reported by ADPs to be in development were largely focused on establishing or improving representation on LLE panels. This included reviewing options on how to better engage with individuals or family members, recruiting dedicated posts to LLE or family member involvement, training opportunities, improving data capture and some specific projects including developing an app and local roadmap for LLE and family member engagement.
ADPs reported a range of different volunteering and employment opportunities were offered by services in their area for people with LLE. These included job skills support (97%), as well as community/recovery cafes, naloxone distribution and peer support/mentoring (all 93%). Six in ten (62%) of ADPs reported offering psychosocial counselling. ADPs also reported other volunteering and employment opportunities offered by services in their area for people with lived and living experience including through funded training programmes.
ADPs highlighted a number of barriers to both providing and accessing volunteering and employment opportunities for people with LLE. Some ADPs noted resourcing challenges associated with finding opportunities and providing training and other support to volunteers. A few indicated challenges in communicating with local businesses or organisations to network, address reservations and objections, and generate opportunities.
Stigma was also identified as a barrier to accessing volunteering and employment opportunities for people with LLE by some ADPs. This included challenges arising from the Disclosure Scotland checks as potential employers have been found to be deterred by the historic criminal convictions some people with LLE have. A few ADPs also reported that employers may also be reluctant to grant interviews or employment opportunities to people with LLE of substance use.
Most of the ADPs in rural areas mentioned that accessibility and cost of transportation act as barriers to accessing volunteering and employment for people with LLE. Some also noted that the geographic composition and employment density of their areas meant that often fewer opportunities were available and accessible than in urban centres. Finally, a few ADPs also mentioned financial barriers such as the cost of childcare and concerns about how voluntary work might affect benefit payments.
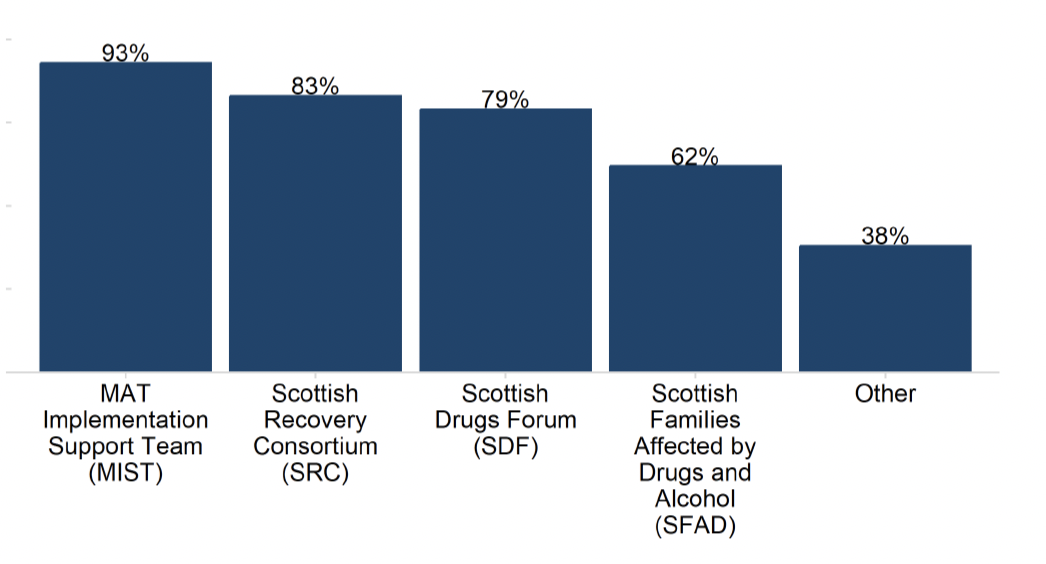
Finally, ADPs also reported high levels of working with organisations and groups to develop their approaches and support their work on meaningful inclusion (Figure 4). Ninety-three percent of ADPs reported working with the MAT Implementation Support Team on meaningful inclusion, followed by 83% with Scottish Recovery Consortium, 79% with Scottish Drugs Forum and 62% with Scottish Families Affected by Drugs and Alcohol. Just over a third of ADPs (38%) also collaborated with other organisations, including Police Scotland, Health Improvement Scotland, Turning Point, lived experience panels and other third sector organisations.
Most ADPs reported that some form of monitoring mechanism was in place to ensure that services they fund are encouraged/supported to involve people with LLE and/or family members in different stages of service delivery. Most ADPs noted that this is required information as part of the funding applications they receive and some specified that this expectation is written into contractual agreements with services or third sector partners. ADPs reported monitoring this in a number of ways, including quarterly, bi-annual or annual monitoring meetings or reports received from commissioned services, contract monitoring and visits to services.
All ADPs reported that some form of support is available to people with LLE and/or family members to reduce barriers to involvement. Ninety-seven percent offered peer support, while 93% offered advocacy and training and development opportunities. Provision of technology/materials and travel expenses/compensation were each offered by 86% of ADPs and wellbeing support was offered by 83%.
All but two ADP areas reported a formal mechanism at the ADP level for gathering feedback from people with lived/living experience (LLE) using services the ADP fund. The most common method was via feedback/complaints processes (83%). Two thirds (66%) reported using questionnaires/surveys. Seven in ten (69%) also reported other ways of gathering feedback from people with lived/living experience, which mostly consisted of LLE groups or panels that contribute at various levels of service development or implementation.
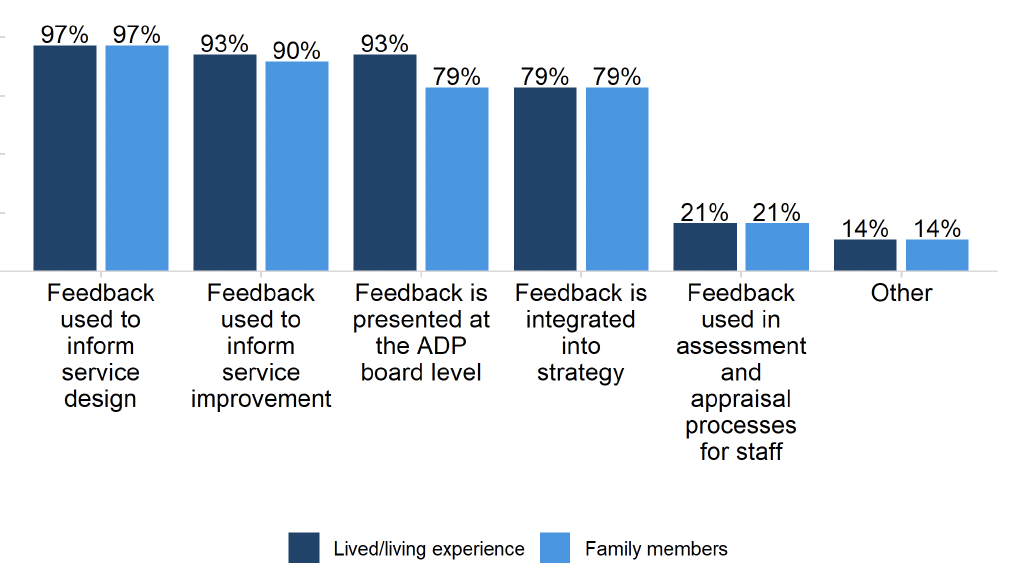
ADPs reported using this feedback in a variety of ways (Figure 5), such as informing service design (97% for both people with lived/living experience and family members), informing service improvement (93% and 90%, respectively), presenting feedback at the ADP board level (93% and 79%, respectively) and integrating feedback into strategy (79% for both groups).
2.5 Stigma
All ADPs reported that they consider stigma reduction for people who use substances and/or their families in at least one of their written strategies or policies. ADPs reported a range of areas where this was the case, most commonly within their ADP strategy and within delivery and action plans. The development of local level stigma strategies or charters of rights were mentioned as key activities taking place, as was taking a person centred or rights based approach. MAT standards implementation plans, operating procedures and communication strategies were also noted as areas where stigma reduction for people who use substances and/or their families was considered. Further, a need to build the requirement to tackle stigma into local service level agreements and review existing local policies was also highlighted by some ADPs.
Most ADPs reported providing specific training on stigma to employees of health care and third sector organisations. Most ADPs also reported having some form of local communication strategy in place to highlight issues around stigma and the impact it can have on individuals. This included organising or participating in stigma reduction campaigns and events involving people with LLE, working with local media, or producing resources, e.g. a guide to non-stigmatising language. Some ADPs made specific mention of recruiting dedicated roles to tackle stigma.
2.6 Fewer people develop problem substance use
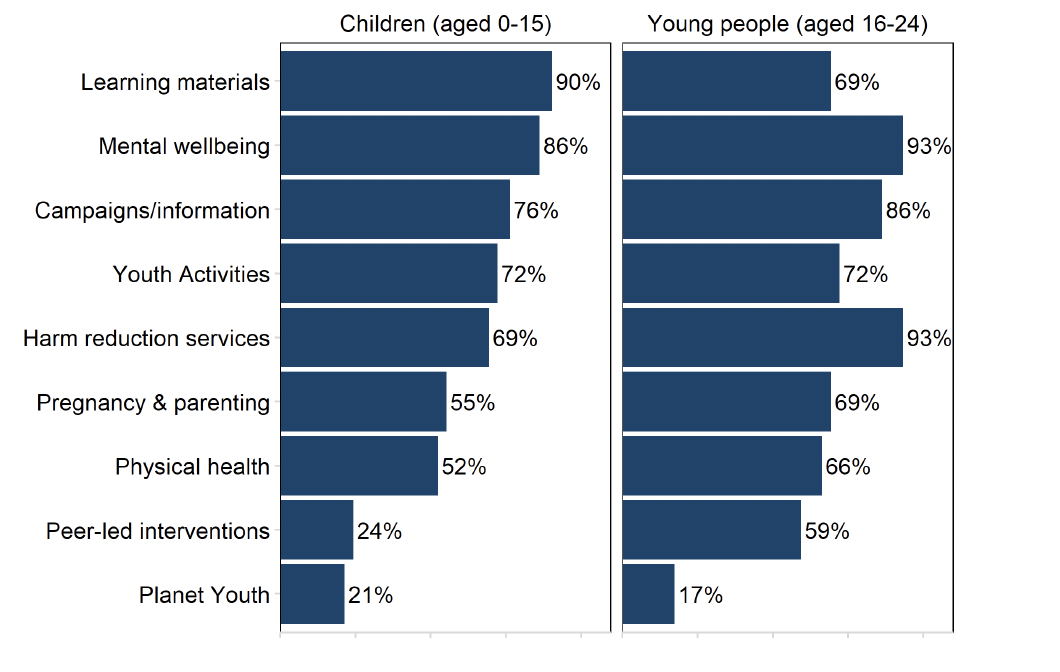
All ADPs have funded or supported education and prevention activities[2] across a range of audiences. For children (aged 0-15), the most commonly reported activities ADPs funded or supported were some form of learning materials (90%) and mental wellbeing activities (86%). The activities ADPs most commonly reported for young people (aged 16-24) were harm reduction activities and mental wellbeing activities, with 93% of ADPs funding or supporting these activities in some form. Overall ADPs generally funded or supported education and prevention activities to young people at higher rates compared to children.
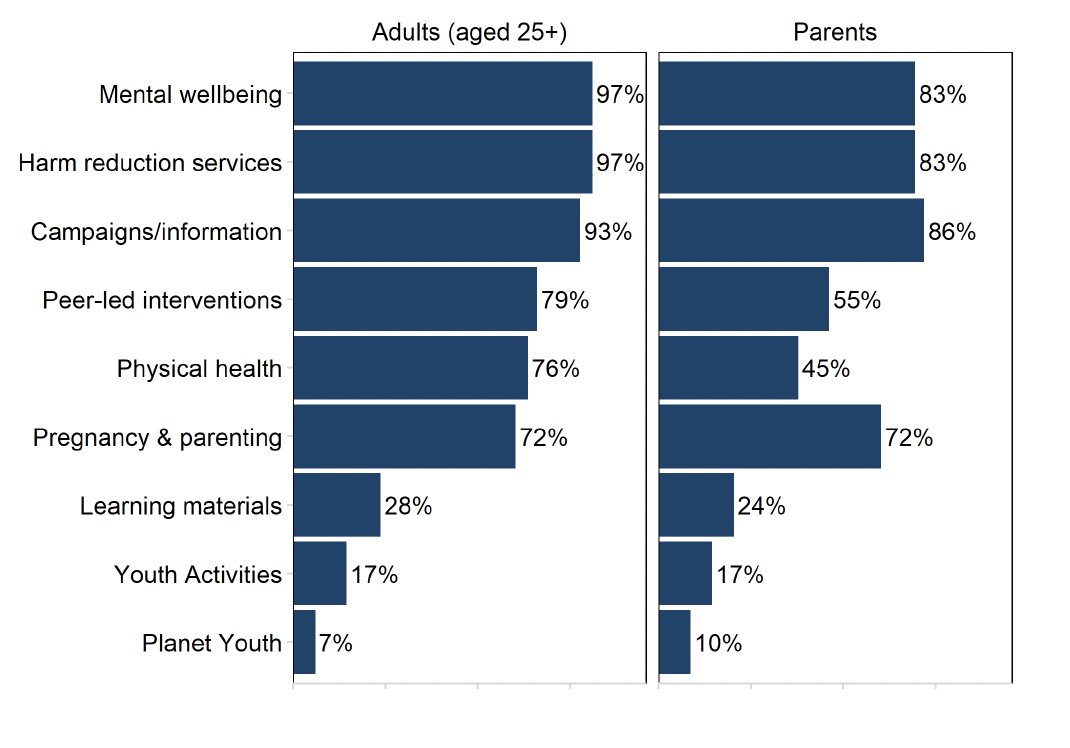
ADPs also reported funding or supporting a range of education and prevention activities[3] aimed at adults (aged 25 years+) and parents. For adults, ADPs most frequently reported funding or supporting harm reduction activities and mental wellbeing activities in some form (97%) (Figure 7). By contrast, the most frequently reported ADP funded or supported education or prevention activity aimed at parents was some form of campaign/information activity (86%). Peer-led interventions and physical health activities were comparatively less available for parents compared to adults – 55% and 45% compared to 79% and 76%, respectively. With the exception of physical health for parents, at least half of ADP areas reported funding or supporting some form of education and prevention activity across all categories in the survey (excluding the explicitly youth-focused activities, i.e. learning materials, youth activities and Planet Youth).
ADPs reported making information on ADP level local treatment and support services accessible to select audiences[4] through various media. This was most commonly done through online platforms (such as websites, social media and apps) for all audiences (41% of ADPs reported offering information online for at least one audience). ADPs also used printed materials such as leaflets/posters (34% of ADPs reported offering information in this format for at least one audience) and in-person forums such as events and workshops (31% of ADPs reported offering information in this format for at least one audience).
2.7 Risk is reduced for people who take harmful substances
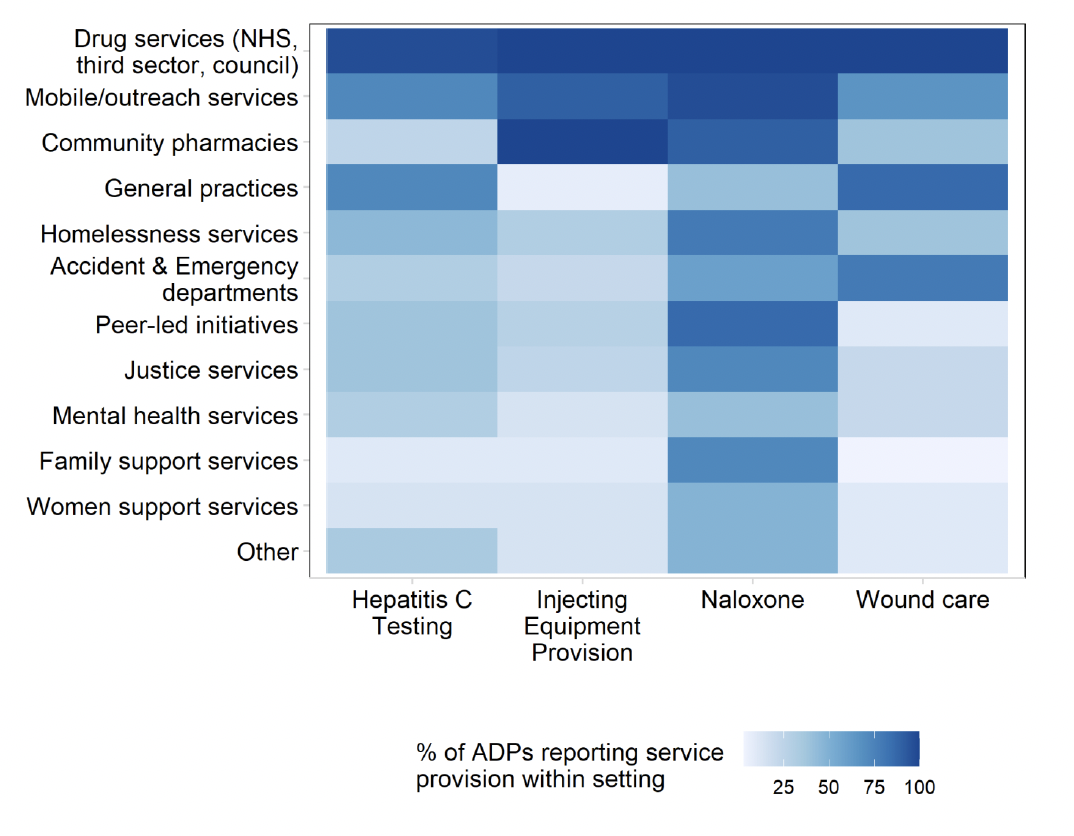
ADPs reported on the availability of four key harm reduction services in their ADP area: naloxone supply, Hepatitis C testing, injecting equipment provision and wound care, across a range of settings. The heat map below (Figure 8) describes the distribution in the availability of these services across a range of settings. Generally, of the harm reduction services, naloxone was most widely available. Of the settings, drugs services offed the widest range of services.
- Hepatitis C testing: 97% of ADPs offered hepatitis C testing in drug services (NHS, third sector, council), followed by 72% in both general practices and mobile/outreach services. Hepatitis C testing was least frequently reported as delivered in family support service (10%), women support services (14%) and community pharmacies (24%).
- Injecting equipment provision (IEP): all ADPs offered IEP in both drug services (NHS, third sector, council) and community pharmacies, followed by 90% in mobile/outreach services. Only 14% of ADPs reported offering IEP in women support services, 21% in Accident & Emergency departments and 31% in homelessness services.
- Naloxone: all ADPs reported offering supply of naloxone in drug services (NHS, third sector, council), followed by 97% in mobile/outreach services, and 90% in community pharmacies. Naloxone supply was least frequently reported as offered in general practices (41%), mental health services (41%) and women support services (48%). All the ADPs with prisons in their area (15 ADPs) reported having protocols in place to ensure that all prisoners identified as ‘at risk’ were offered naloxone upon release
- Wound care: all ADPs delivered wound care in drug services (NHS, third sector, council), followed by 86% in general practices and 79% in Accident & Emergency departments. Only 10% of ADPs reported delivering wound care in women support services.
2.8 People at most risk have access to treatment and recovery
All ADPs reported having referral pathways in place in their area to ensure people who experience a near-fatal overdose (NFO) are identified and offered support. Moreover, every ADP reported that people who have experienced a near-fatal overdose have been successfully referred using this pathway.
All ADPs reported that justice partners are represented on the ADP and reported a range of other ways of working with them. There were high rates of information sharing (93%), justice partners contributing toward justice strategic plans e.g. diversion from justice (86%), and provision of advice/guidance (83%). Nearly two in three ADPs (62%) also reported joint funding of activities.
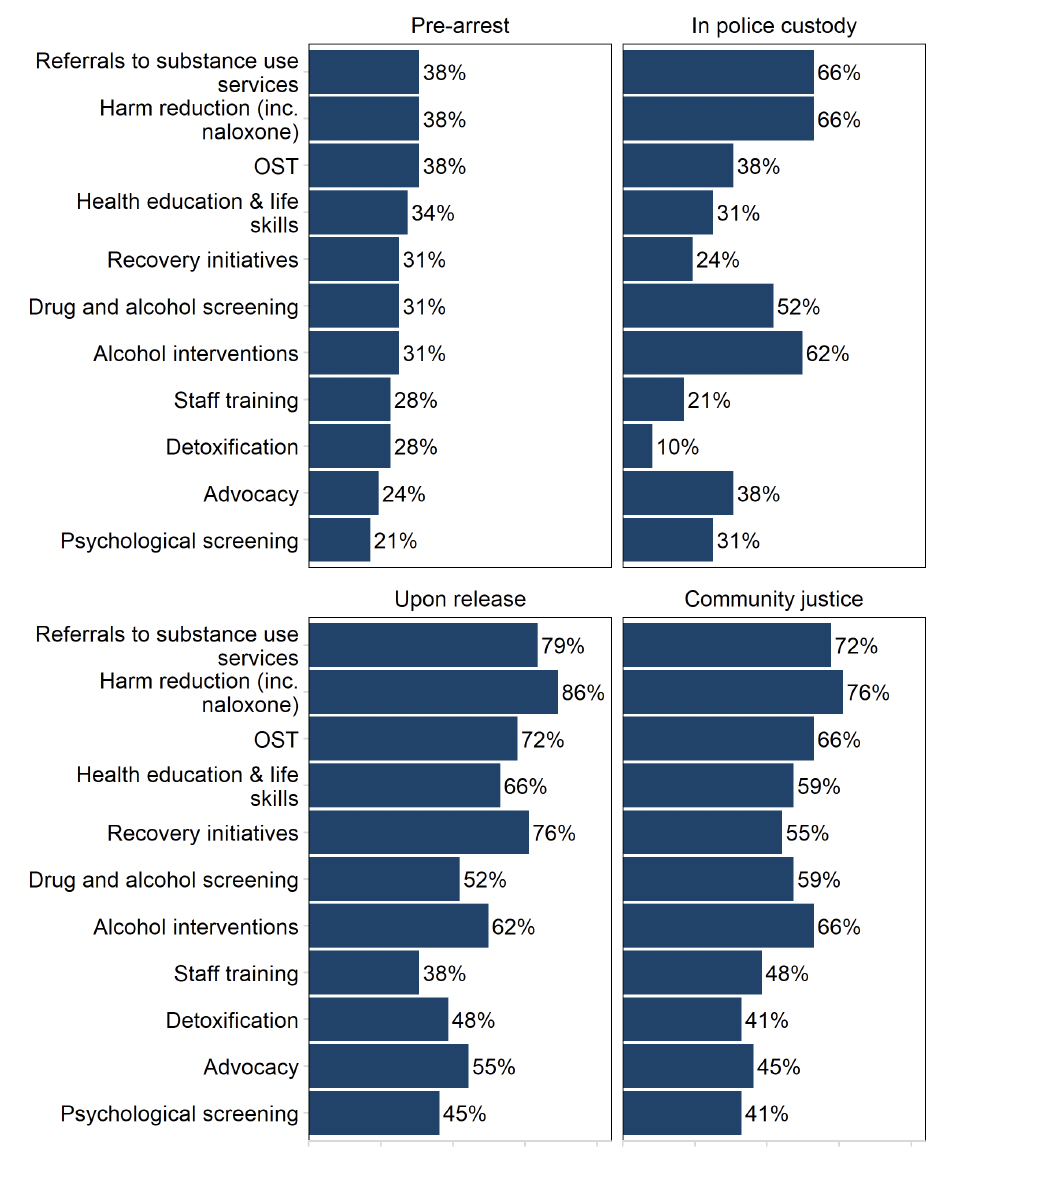
ADPs also supported or funded a range of activities at the different stages of engagement with the justice system (Figure 9)[5]. At the pre-arrest stage, Opioid Substitution Therapy (OST), harm reduction and referrals to substance use services were funded or supported by 38% of ADP areas. Once in police custody, over two-thirds (66%) of ADPs reported supporting or funding referrals to substance use services (including both drugs and alcohol) and some form of harm reduction. Upon release, the service most commonly funded or supported by the ADP was harm reduction services (86%). Harm reduction was also the most common activity at community justice stage with almost three in four ADPs (76%) reporting funding or supporting these services in some form. Psychological screening was the least funded or supported activity for the pre-arrest (21%) and community justice (41%) stages, whereas staff training was the activity supported or funded by the fewest ADPs upon release (38%), and detoxification was supported or funded by the fewest ADPs at the police custody stage (10%).
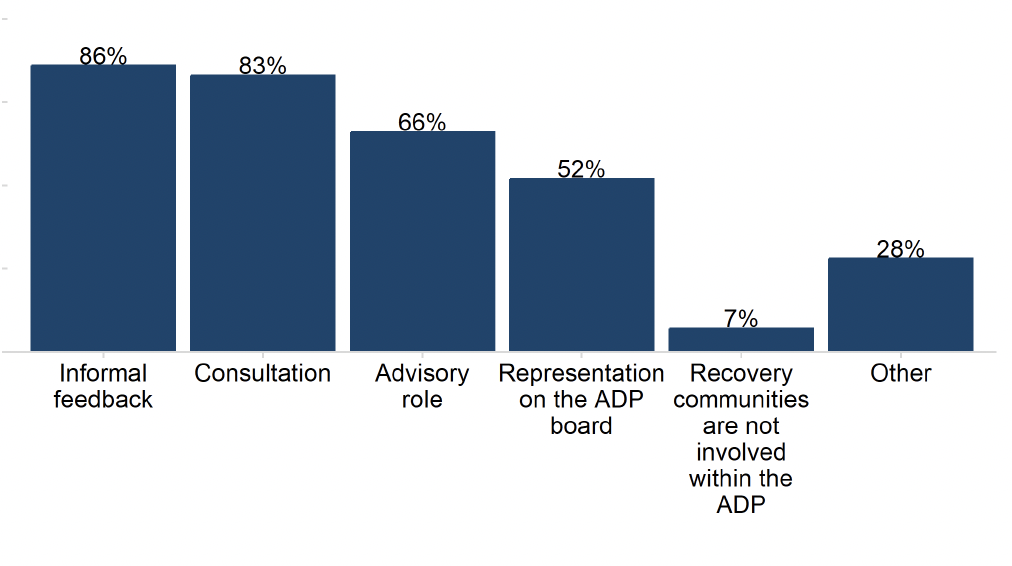
Recovery communities were prevalent across ADPs, with survey respondents reporting a range of 0 to 43 recovery communities in their areas, with a sector-wide average of eight.[6] Moreover, ADPs reported actively engaging with or providing support to an average of six recovery communities. For the majority of ADPs this engagement or support consisted of providing funding and networking opportunities (both 93%) and training (90%). ADPs reported involving recovery communities within the ADP in a range of ways (Figure 10), the most common of which was through informal feedback (86%), followed by consultation (83%). Recovery communities were also reported to be involved within the ADP in an advisory capacity by 66% of ADPs, and were represented on more than half (52%) of ADP boards. Only two ADP areas (7%) reported that they were not actively engaged with, or providing support to, recovery communities.
2.9 People receive high quality treatment and recovery services
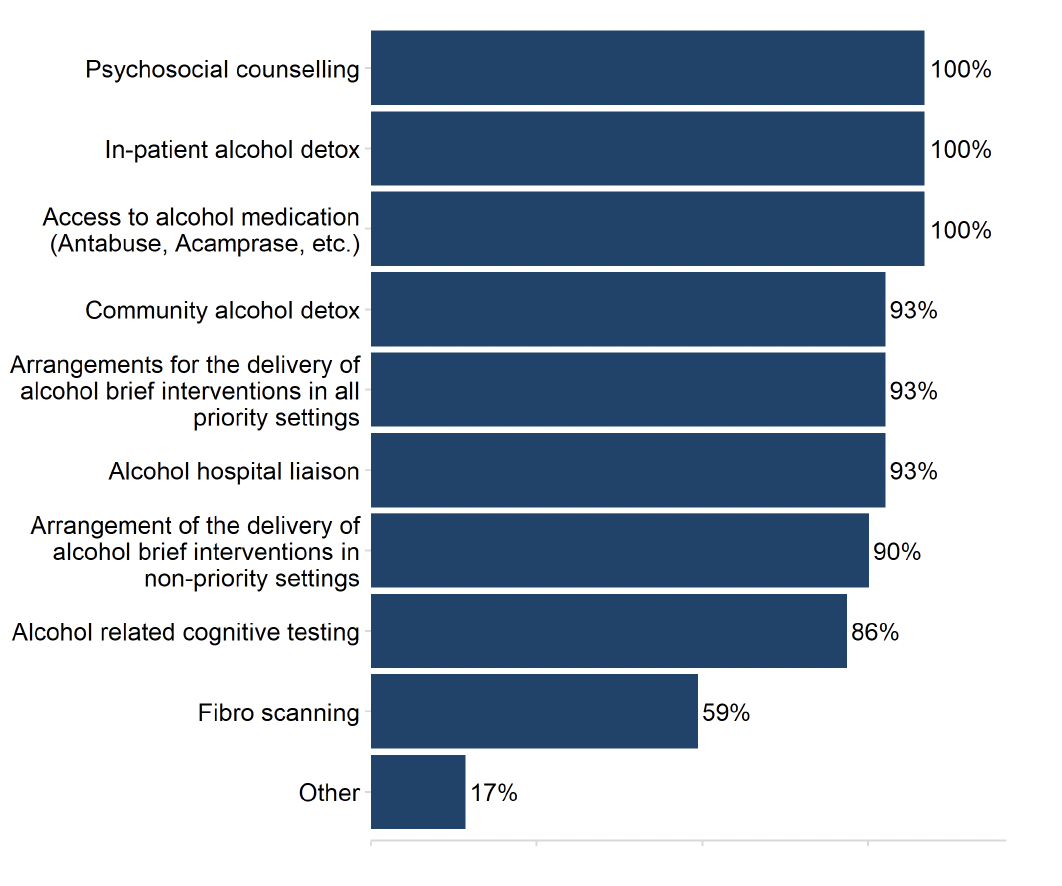
All ADPs reported having some form of treatment or screening options in place to address alcohol harms (Figure 11). All ADPs reported that people in their area had access to alcohol medication, in-patient alcohol detox and psychosocial counselling. In addition, 93% of ADPs offered community alcohol detox, arrangements for the delivery of alcohol brief interventions (in all priority settings) and alcohol hospital liaison. The treatment or screening option offered at the lowest rate was fibro scanning, which was available in 59% of ADP areas.
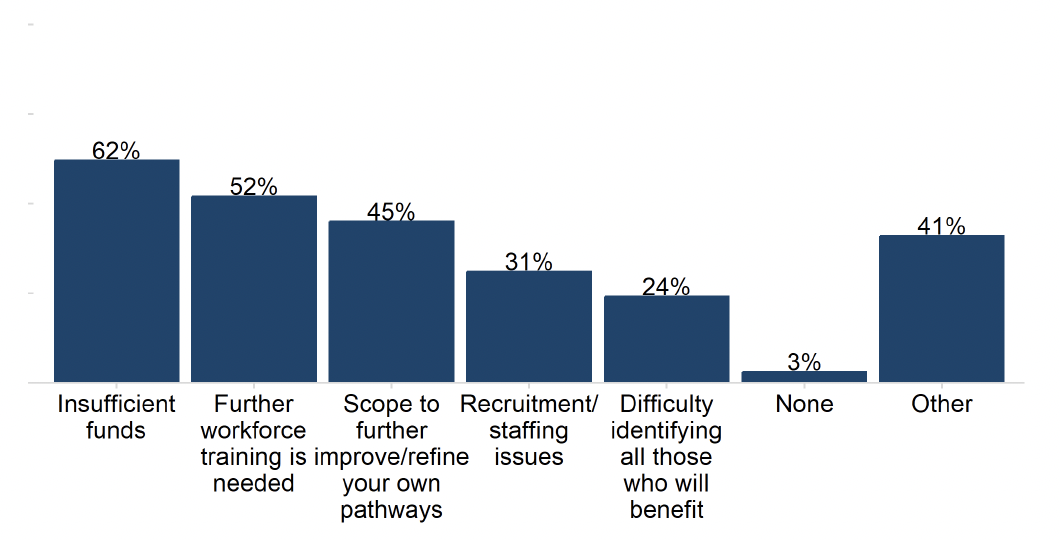
ADPs cited a range of barriers to implementing MAT Standards in their area (Figure 12). Nearly two in three ADP areas reported insufficient funds was a barrier (62%), and over half reported the need for further workforce training (52%). A quarter of ADPs (24%) reported difficulty identifying all those who will benefit. Four in ten (41%) also listed 'Other' barriers to implementing MAT, which included challenges associated with reporting, geography, and project management. Only one ADP reported no barriers to implementing MAT Standards in their area.[7]
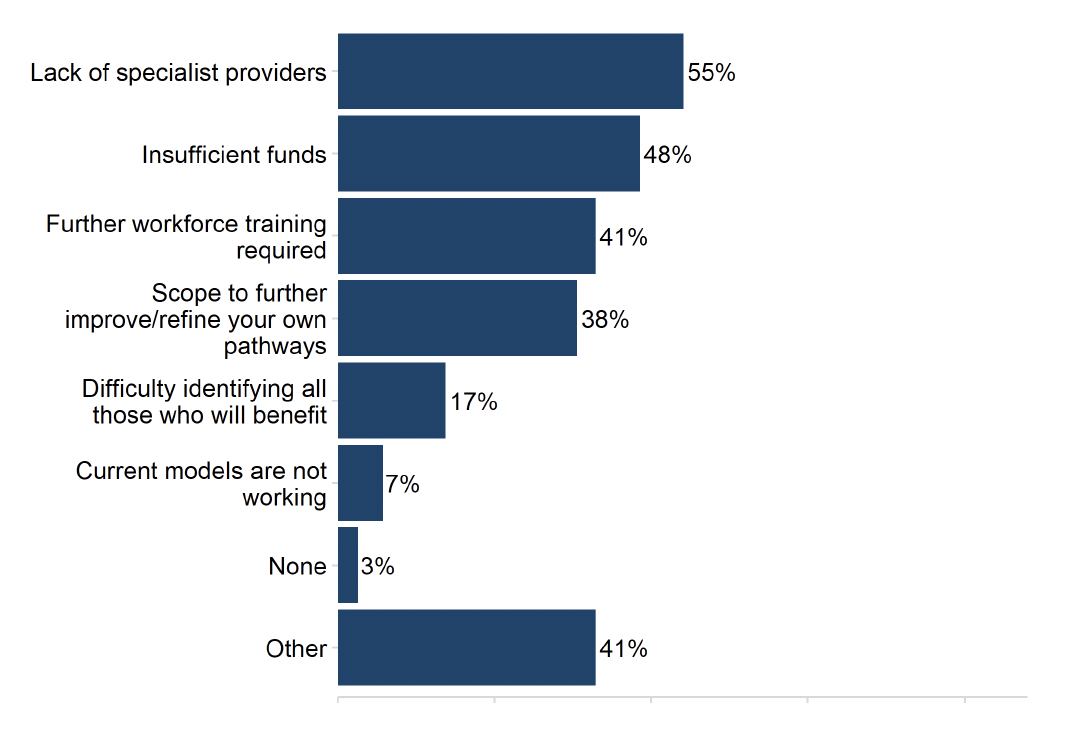
ADPs reported a range of barriers to residential rehabilitation in their area (Figure 13). The most commonly cited barriers were a lack of specialist providers (55%), insufficient funds (48%) and the requirement for further workforce training (41%). Waiting times and insufficient pre or aftercare support were among the ‘Other’ barriers cited. Only two ADPs (7%) reported that current models are not working. Only one ADP area responded that there were no barriers to accessing residential rehabilitation in their area.
More than four in five ADPs (83%) had published a revision or update to their residential rehabilitation pathway in 2022/23, while 17% had not made any revisions or updates.[8]
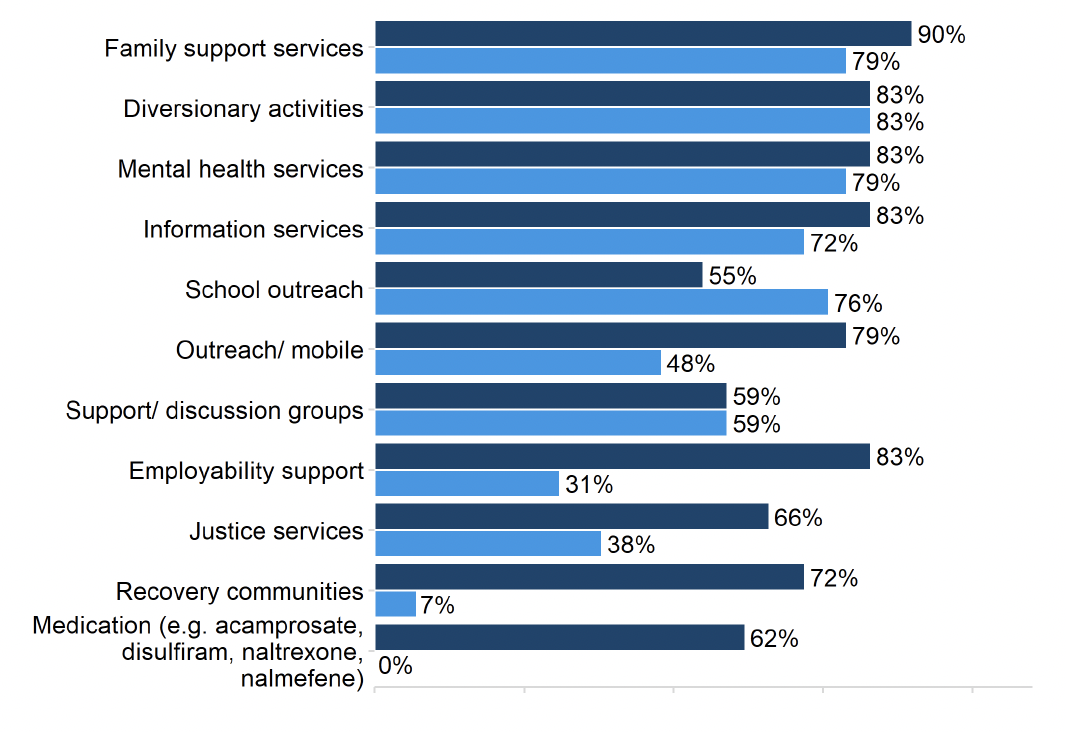
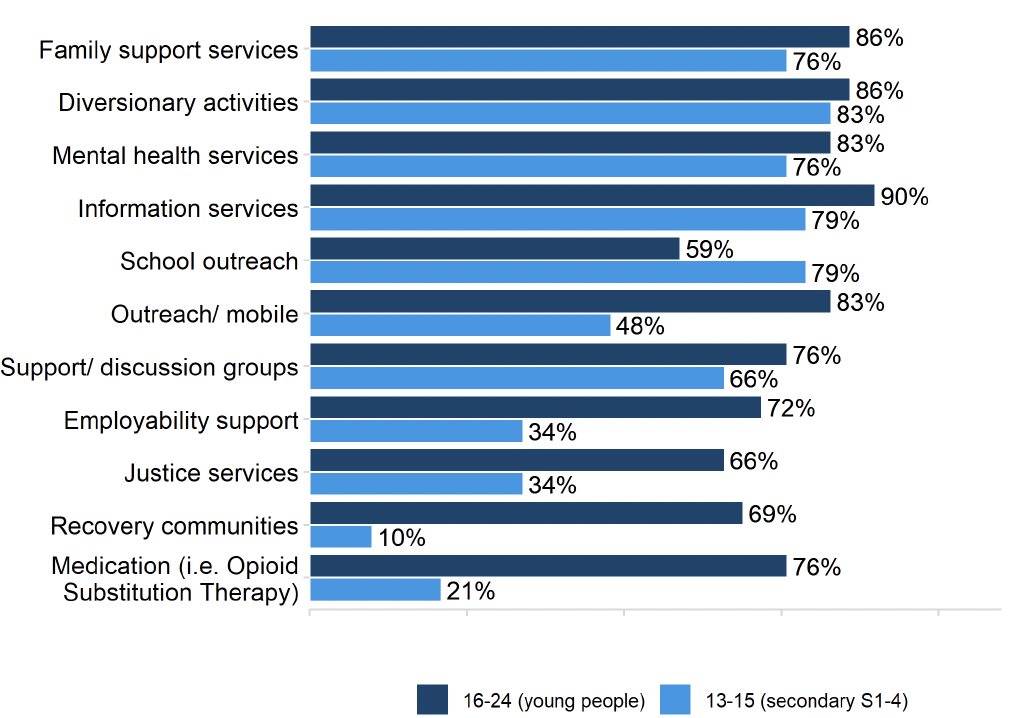
ADPs reported a range of treatment and support services in place specifically for children and young people aged between 13 and 24 years using drugs and alcohol (Figure 14). However, there is evidence of different ranges of support depending on age and the substance for which the support is needed. For example, diversionary activities were most commonly reported as being in place for children aged 13-15 years using alcohol (83%) and drugs (83%). For 16-24 year olds, family support services were in place at the highest rates for those using alcohol (90%), whereas information services were most commonly reported as in place for people in this age bracket using drugs (90%).
Overall, treatment and support services were typically in place more widely for young people aged 16-24 compared to children aged 13-15, with the exception of school outreach (available in 76% of ADP areas for children aged 13-15 and 55% for young people aged 16-24 using alcohol; and 79% to 59% respectively for those using drugs).
Alcohol
Drugs
Most ADPs reported that they had specific treatment and support services aimed for children up the age of 12 years affected by alcohol or drugs. There was overlap in what was available for children who were primarily affected by alcohol or primarily by drugs. Most ADPs indicated that the support available was integrated into a Whole Family Approach, drawing on Family Inclusive Practices. Specific support available to children included bespoke educational support (e.g. homework hubs) or training (e.g. trauma), wellbeing hubs or support for young carers, among others. Neonatal treatment and support to mothers during their pregnancy was more commonly reported in the context of children affected by alcohol use than drug use. Some ADPs reported employing specialist substance use nurses who could provide treatment and support to children in their early years (aged 0-4 years). Only a few ADPs reported not offering any specific services for this demographic.
2.10 Quality of life is improved by addressing multiple disadvantages
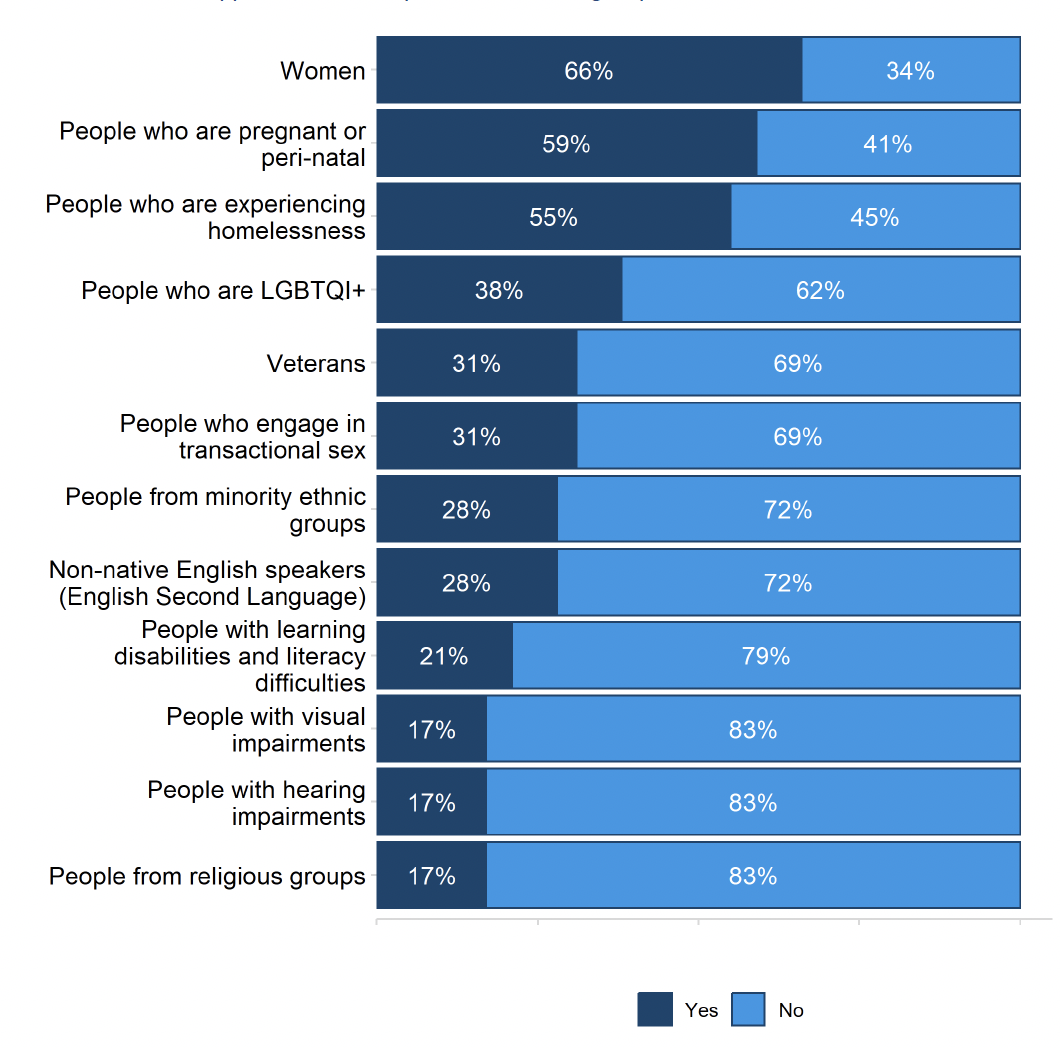
ADPs reported having specific treatment and support services in place for a range of groups (Figure 15). Around two thirds (66%) of ADPs indicated there were specific services in place for women, followed by 59% for people who are pregnant or peri-natal, and 55% for people experiencing homelessness. By contrast, only 17% of ADPs offered specific services for people with visual impairments, hearing impairments, or people from religious groups.
Over half of ADPs (59%) reported that they had formal joint working protocols in place to support people with co-occurring substance use and mental health diagnoses to receive mental health care. The ADPs that did not have joint working protocols in place indicated that it was in development, especially in relation to implementing standard nine of the MAT standards.
ADPs were also asked to outline local arrangements for people who present at substance use services with specific (undiagnosed) mental health concerns. Most ADPs indicated that substance use services were either staffed by mental health professionals (e.g. psychiatrist and community mental health nurses) or have pathways in place for referral to mental health services or other multi-disciplinary teams in the area. This included collaboration with hospital-based mental health services or establishing links between services to facilitate referrals for psychiatric assessment.
Some ADPs reported arrangements being in place to support the care of people with co-occurring substance use and mental health concerns, regardless of whether a pre-existing diagnosis existed (e.g. joint working protocols, dedicated coordinating staff roles, dual diagnosis teams, established links between services). A few reported that substance use services were able to provide direct access to treatment from psychiatrists or specialist nurses and providing psychological interventions in-house.
Most ADPs reported having established links with support services not directly related to substance use (e.g. welfare advice, housing support etc.). The most commonly cited were housing, employability and welfare support. The ADP tended to be linked to these services through representation on strategic groups or topic-specific sub-groups, or through membership on the ADP board. Partnership working and the establishment of close working relationships at an ADP and service level was also reported by some ADPs. Only a few ADPs made explicit mention of funding being provided.
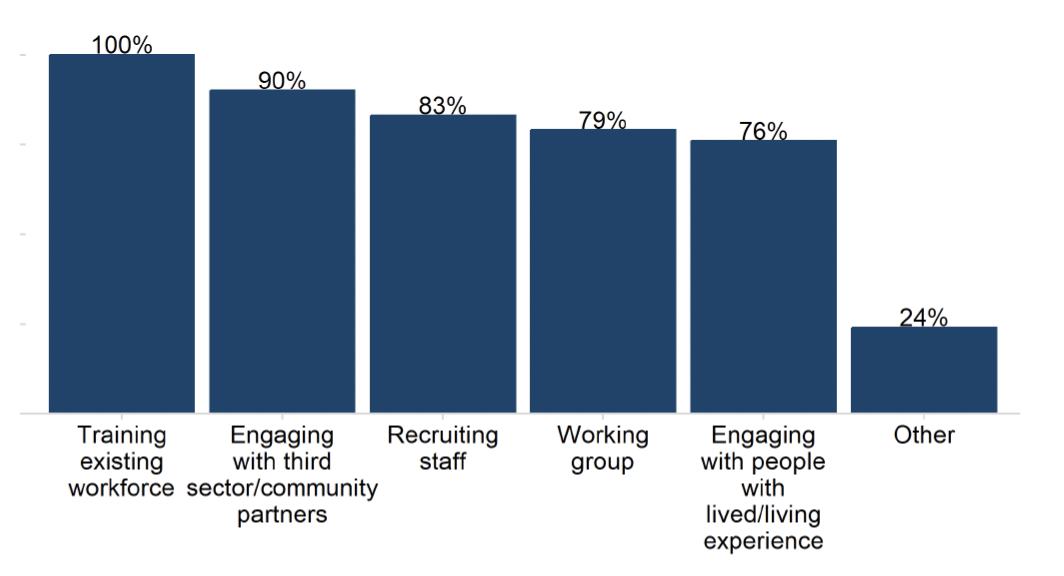
ADPs also reported a range of activities having being undertaken in local services in their area to implement a trauma-informed approach (Figure 16). All ADPs reported training their existing workforce, and 90% had engaged with third sector / community partners. There was also evidence of recruitment (83%), working groups (79%) and engaging with people with lived/living experience (76%). One in four ADPs (24%) were also aware of ‘Other’ activities having been undertaken in their area, such as the embedding of these principles in a local recovery hub or supported accommodation unit.
2.11 Children, families and communities affected by substance use are supported
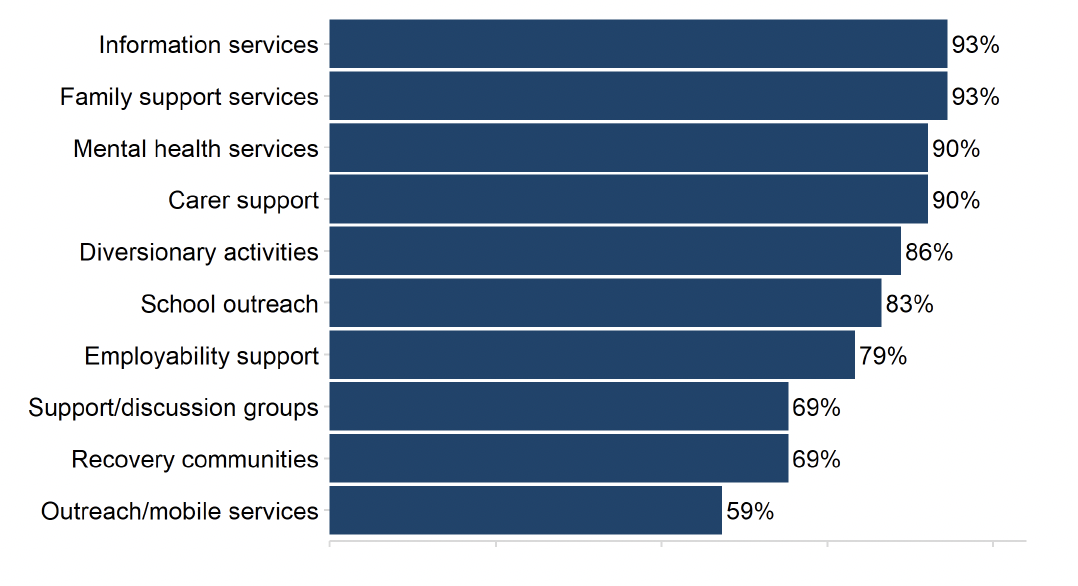
ADPs reported a range of treatment and support services in place for children and young people (under the age of 25 years) affected by a parent’s or carer’s substance use (Figure 17). Almost all ADPs reported having family support services (93%), information services (93%), carer support services (90%) and mental health services (90%) in place for one or more age groups under 25 years.[9]
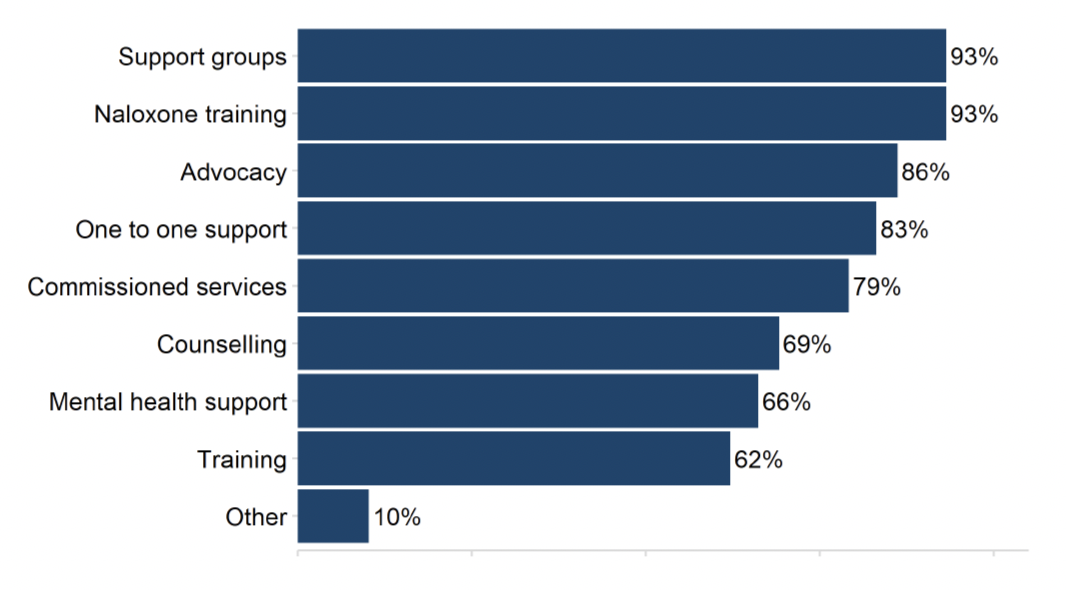
ADPs also outlined a range of support services in place for adults affected by another person’s substance use (Figure 18). All but two ADPs (93%) offered both naloxone training and support groups, while 86% had advocacy services in place and 83% had one-to-one support services in place.
Most ADPs (97%) reported that they contributed to the integrated children’s service plan, and 72% of ADPs have an agreed set of activities and priorities with local partners to implement the Holistic Whole Family Approach Framework[10] in their area.
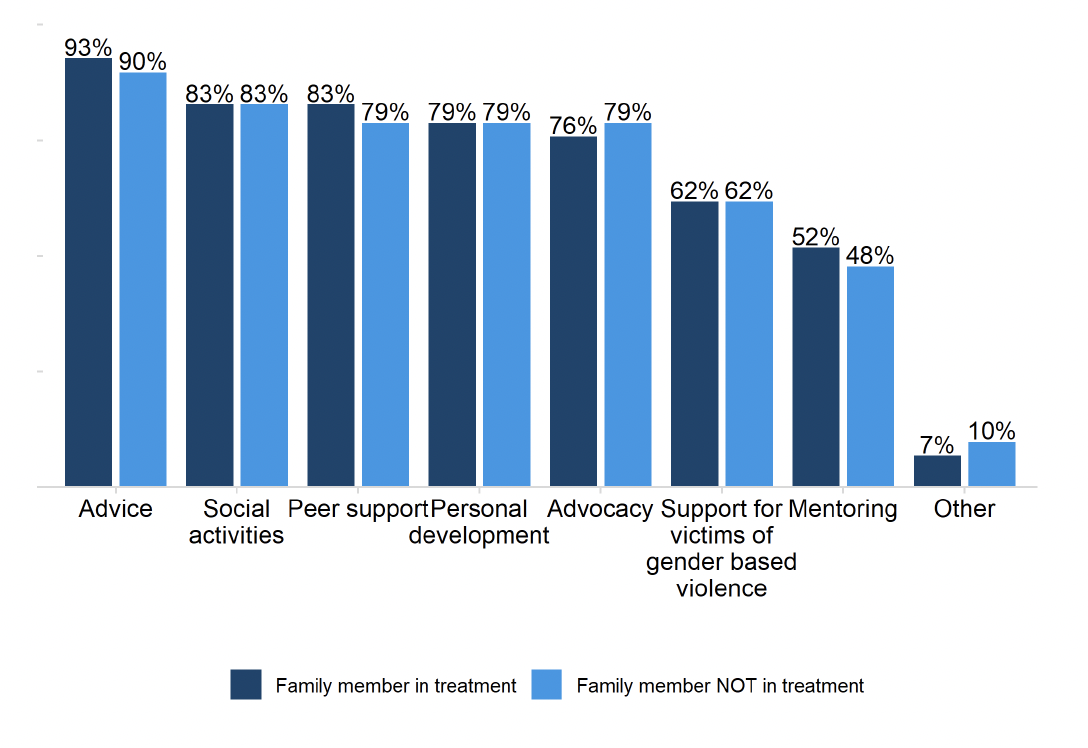
A variety of services were reported to be in place to support Family Inclusive Practice or a Whole Family Approach (Figure 19). These included services tailored to different groups – 93% of ADPs had advice services in place for people with a family member in treatment and 90% had advice services in place for people with a family member not in treatment. Over three quarters of ADPs (83%) offered social activities for people in both groups, and there was also evidence of high rates of peer support services, personal development services and advocacy services for both groups.
Contact
There is a problem
Thanks for your feedback