Alcohol and Drug Partnerships (ADP) 2023/2024 Annual Survey
This publication reports on responses to the annual survey of Alcohol and Drug Partnerships (ADPs) in Scotland for 2023/24. Its main aim is to evidence progress of the National Mission by providing information on the activity undertaken by ADPs.
Findings
1. Response rates
Responses were received from all 30 ADP areas in Scotland. It is important to note that ADP areas vary considerably by size, population and demographics.
At the time of publication 27 ADPs had confirmed that responses were signed off at ADP level and 17 had confirmed that were signed off at the Integrated Joint Board (IJB) level. Some ADPs were unable to provide IJB sign off prior to report publication due to meetings being held outwith the timescales for reporting.
2. Cross cutting priority: Surveillance and data informed
Structures to inform surveillence and monitoring
Almost all ADP areas reported having specific groups or structures in place at ADP level to inform surveillance and monitoring of drug harms or deaths. As shown in Figure 1, all but two (93%) of ADPs reported having a drug death review group and 77% reported having a drug trend monitoring group or early warning system. Fewer ADPs reported groups relating to alcohol, with a quarter (27%) reporting having an alcohol death review group and 30% reporting having an alcohol harms group.
A third of ADPs reported having other structures in place for informing surveillance, which included multi-agency groups working on drug death prevention and action plan groups, wider public health monitoring which included drug and alcohol harms and sudden death groups whose remits include both drug death reviews and suicides reviews. Several ADPs indicated that alcohol harm and death review groups are currently in development.
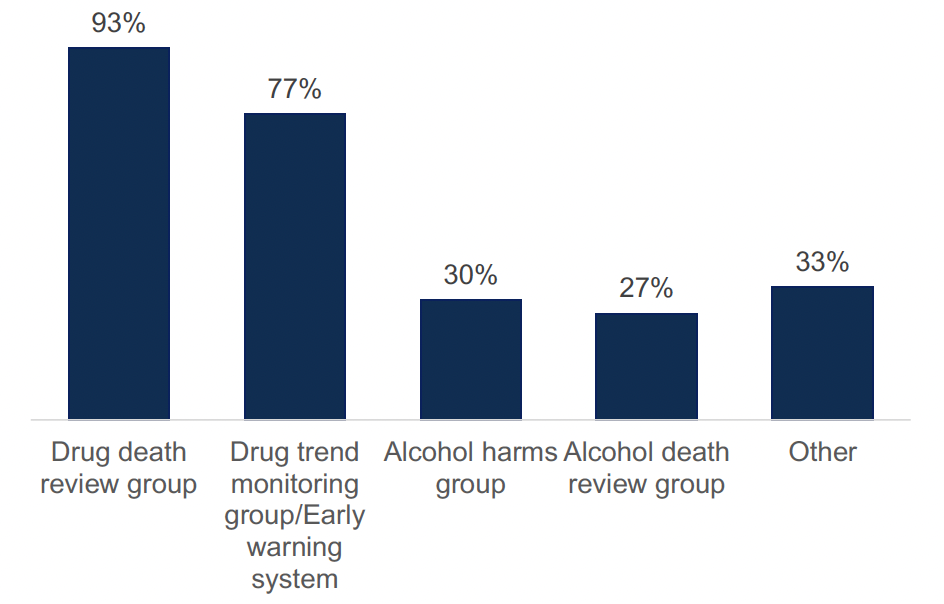
Percentage of ADPs who have structures in place at ADP level to inform surveillance and monitoring of alcohol and drug harms or deaths.
Figure 1 Chart showing the percentage of ADPs who have structures in place at ADP level to inform surveillance and monitoring of alcohol and drug harms or deaths.
Most (80%) ADPs reported that Chief Officers for Public Protection receive feedback from drug death reviews. Among the 20% who did not, several reported that processes are currently under review or that other mechanisms to provide feedback and assurances are in place.
ADPs described a range of local and national structures in place for the monitoring and surveillance of alcohol and drug harms and deaths. These include:
- Use of data and alerts from Public Health Scotland (PHS), including Rapid Action Drug Alerts and Response (RADAR) and the Drug and Alcohol Information System (DAISy).
- Review of outputs from National Records of Scotland (NRS), including drug death publications.
- Use of data collected through the Welsh Emerging Drugs and Indentification of Novel Substances (WEDINOS).
- Local survellience, including early warning systems related to alcohol and drug harms, non-fatal overdoses and alcohol and drug related deaths. This data is gathered and collated locally in collaboration with public health intelligence officers, medical staff and consultants.
- Reviews following adverse events, including drug deaths, with relevant agencies.
ADPs described a range of ways in which monitoring and surveillance are used to inform local decision making. These include:
- Use of multi agency groups who meet to assess harms and determine appopriate courses of action. Agencies, organisations and individuals included in these groups vary across ADPs, but include: ADP support teams, Police Scotland, forensic toxicology services, Scottish Ambulance Service (SAS), third sector partners including the Scottish Drugs Forum (SDF) and CREW, RADAR, people with lived and living experience, local drug treatment services, pharmacy colleagues, social work, homelessness partners, children and families and other youth services, mental health services, assertive outreach, housing and education.
- Engagement through a range of wider groups who utilise and contribute to surveillance and subsequent actions, which include: alcohol harms, drug and alcohol death review groups, overdose prevention and near-fatal overdose (NFO) groups, substance trend monitoring groups, quality and patient safety groups and incident management teams.
- Development of appropriate responses through consultation with clinical governance and primary care colleagues.
- Reviews of circumstances associated with each death and person’s journey, to inform learning.
- Assessment of risks around novel substances, to issue alerts and advice.
- Action taken to inform staff training and guidance in harm reduction and develop advice to give to people most at risk of drug and alcohol harms.
Response to emerging threats
ADPs were asked if specific revisions had been made to any protocols in response to emerging threats, such as novel synthetics. The majority (73%) indicated that they had made revisions, with changes including:
- Updated emergency plans and processes put in place to respond to incidents of near-fatal overdoses or suspected drug deaths.
- Increased use of RADAR, with staff training on what RADAR can support and regular assessment and communication of localised trends.
- Specific groups established to respond to emerging threats, often with multi-agency, multi-disciplinary membership to co-ordinate responses.
- Development of escalation policies and monitoring based on increases in clusters of drug deaths, near-fatal overdoses, hospital admissions and emergency department attendances.
- Updated advice, for instance, to ensure widespread availability of naloxone through services and advice to carry additional naloxone kits.
- Provide additional peer training in harm reduction.
- More visible warnings in ADP buildings and community settings.
- Guidance put in place with relevant partners and services for instances of suspected clusters of overdoses due to novel synthetics.
- Provision of nitazine testing strips and on-site fentanyl testing, as well as support through services to have substances checked via the Welsh Emerging Drugs and Indentification of Novel Substances (WEDINOS).
- Implementation of regular updates for staff relating to local drug trends.
3. Cross cutting priority: Resilient and skilled workforce
Staffing resources
ADPs reported that they employed an average of 3.5 whole-time equivalent (WTE) staffing resource routinely dedicated to their ADP support team as of 31 March 2024. This is a slight increase from 3.1 WTE in the 2022/2023 survey. The WTE resource across all ADPs ranged from 0.8 WTE to 8.5 WTE, which is likely reflective of the differing sizes and needs of the geographical areas served. Some ADPs indicated that they did not have a dedicated ADP support team, where staff worked across a number of different areas. In these cases an estimate of the WTE allocated to ADP specific areas was provided.
Vacancies were reported in 11 ADPs, with an average 0.4 WTE. These included vacancies for ADP co-ordinators, strategic leads and development officers, as well as project managers, business and clerical support, and specific roles relating to experiential leads and harm reduction.
Employee wellbeing
ADPs reported a range of initiatives that have been undertaken at ADP level or in services that ADPs commission that are aimed at improving employee wellbeing. These include:
- Staff surveys to understand wellbeing needs and the establishment of working groups and events to understand and implement approaches to support staff wellbeing.
- Information and awareness-raising through wellbeing sessions and signposting.
- Team development and staff training on a range of issues, including trauma awareness and crisis management.
- Occupational health services made available, along with access to wellbeing and psychological resources, such as counselling.
- Regular check ins with employees and volunteers, with mentoring, coaching and regular supervision.
- Peer support initiatives, including for team members with lived experience.
- Social and physical activities, such as wellbeing walks, networking lunches and yoga.
- Caseload management.
- Flexible working, with protected time to support wellbeing.
- Disability passports.
- Efforts to support inclusive and supportive workplaces, such as having wellbeing champions and staff networks to support equalities groups.
4. Cross cutting priority: lived and living experience
Living and living experience feedback
All ADPs reported having formal mechanisms in place at an ADP level to gather feedback from people with lived and/or living experience who use ADP-funded services. All ADPs reported collecting experiential data as part of the Medication Assisted Treatment (MAT) programme and 97% of ADPs reported having a lived/living experience panel, forum and/or focus group. Four in five (83%) ADPs reported having feedback or complaints processes in place and 63% reported that they used questionnaires and surveys. Other mechanisms which ADPs reported included options to contact the ADP support team through the ADP website, engagement through existing forums at a range of levels (including national level networks and local recovery networks), attendance at lived experience events (including meetings and annual conferences), and case studies developed by services shared through quarterly monitoring submissions.
ADPs were asked how they use feedback received from people with lived/living experience and family members to improve service provision, shown in Figure 2.
- Service improvement All ADP areas reported using feedback from people with lived/living experience to inform service improvement, and 93% reported using feedback from family members.
- Service design All ADP areas reported using feedback from people with lived/living experience to inform service design, and 90% reported using feedback from family members.
- Strategy Nine in ten (90%) reported integrating feedback from people with lived/living experience into their strategies, and 83% reported integrating feedback from family members.
- Board level feedback Nearly all ADPs (97%) reported that they present feedback from people with lived/living experience at a board level, and 87% reported presenting feedback from family members.
- Assessment and appraisal Feedback from both people with lived/living experience and family members was less commonly reported for use in assessment and appraisal processes for staff (37% and 33% of ADP areas respectively).
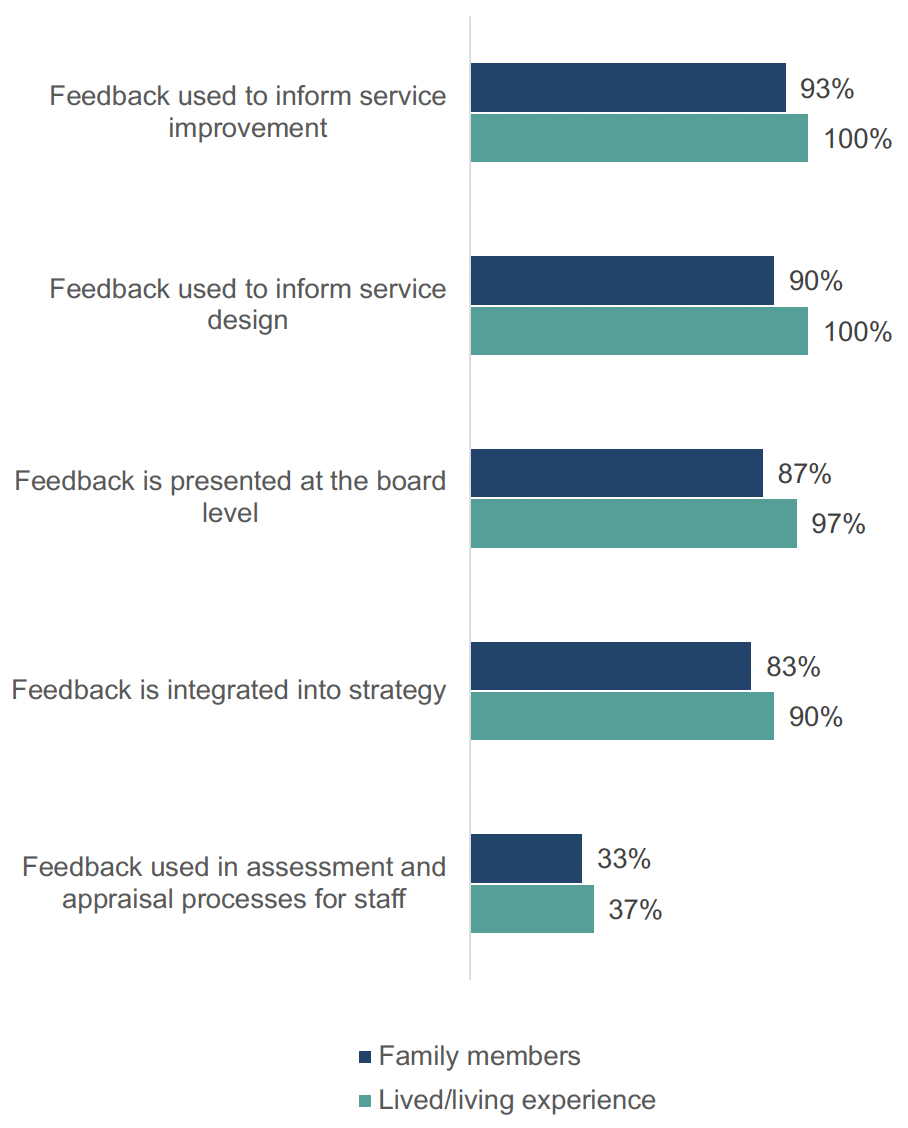
Percentage of ADPs who use feedback from people with lived/living experience and family members
Figure 2 Chart showing the percentage of ADPs who use feedback from people with lived/living experience and family members
Lived and living experience participation
All ADPs reported a range of mechanisms through which people with lived/living experience were able to participate in decision-making. In 83% of ADP areas, it was reported that they can participate in decision-making through an existing ADP group/panel/reference group, and in 70% of ADPs it was reported that they can participate through a group or network that is independent of the ADP. In 60% of ADP areas, it was reported that people with lived/living experience can participate through ADP board membership and in 67% of areas they can participate through membership in other areas of ADP governance, such as steering groups. Other reported routes for people with lived/living experience to participate in decision-making included through events such as ADP development days, within focus groups and conversation cafes, through questionnaires and surveys, and being embedded within ADP commissioned services and programmes.
Nearly all (97%) of ADPs reported that family members were able to participate in ADP decision-making. It was reported that in the majority of ADP areas (73%), family members could participate through an existing ADP group/panel/reference group and 67% reported they could participate through a group or network that is independent of the ADP. In 43% of ADP areas family members could reportedly participate through ADP board membership and in 53% they could participate through membership of other areas of ADP governance, such as steering groups. Other responses included participation through surveys and questionnaires and through ADP events.
All ADPs reported having mechanisms in place to ensure that services they fund involve people with lived/living experience and/or family members in their decision-making, shown in Figure 3. Three quarters (77%) of ADP areas reported asking about this in their reporting, two thirds (67%) mentioned this in their contracts and two thirds (67%) reported including it as a prerequisite for their commissioning. 43% of ADPs reported having all three mechanisms in place. Other answers indicated that information would be asked for in relation to specific pieces of commissioned work and as part of quality improvement work.
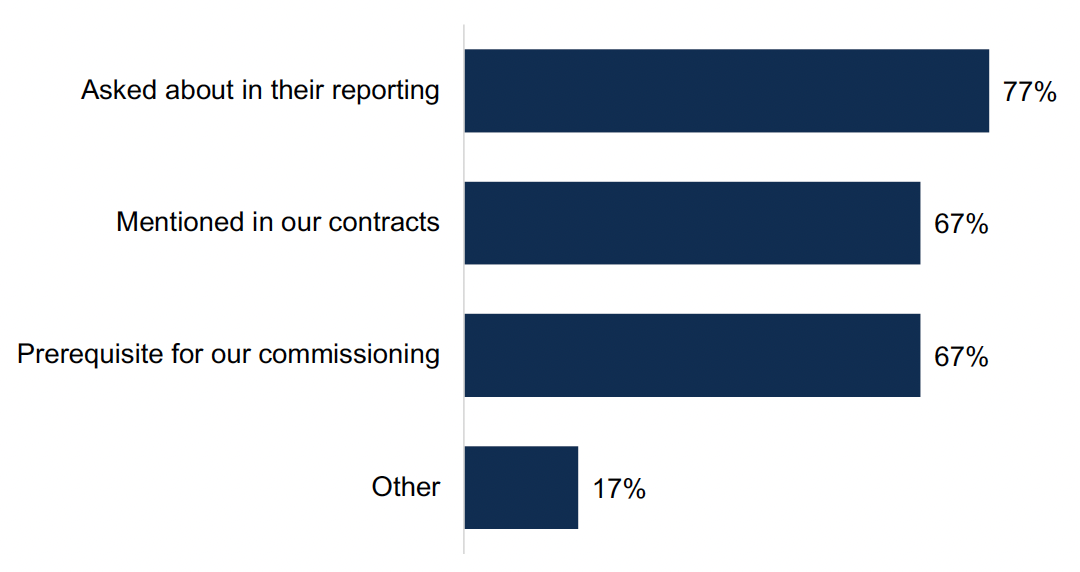
Percentage of ADPs which use different mechanisms to ensure the services they fund involve people with lived/living experience and/or family members in decision making
Figure 3 Chart showing the percentage of ADPs which use different mechanisms to ensure the services they fund involve people with lived/living experience and/or family members in decision making
Lived and living experience allocated funding
ADPs described a range of ways in which they have used ADP allocated funding to enable lived/living experience participation in the previous financial year. These included:
- Funding for workshops and events, including conversation cafes and training and development sessions. Funding was used for venue hire and to cover transport and travel costs to remove barriers to engagement.
- Honorariums and renumeration for contribution from people with lived/living experience and family volunteers who participate in ADP processes and governance, including within lived experience advisory panels, as well as covering expenses for participants.
- Funding to employ peer workers in services, including independent advocacy and recovery.
- Funding for officers dedicated to experiential work within the ADP co-ordination team, including coordination of MAT experiential work and coordination of existing reference groups.
- Funding for community consultations, peer research projects and projects with partnership around gathering lived/living experiences.
- Data collection as part of the MAT experiential programme.
- Development of lived experience forums, panels, community groups and networks, including funding third sector organisations to facilitate these.
- Grants to third sector organisations to support with the development of lived experience panels and recovery support.
- Funding for recovery coaching.
- Commissioning training for lived experience forums to enhance development of members and staff supporting the forum, on topics around roles and responsibilities, local and national structures, policy and strategy, rights in recovery and terms of reference training.
5. Cross cutting priority: Stigma reduction
ADPs were asked about considerations for stigma reduction for people who use substances and/or their families within written strategies or policies, shown in Figure 4. All ADPs included stigma reduction within at least one written policy. All but two ADPs (93%) included stigma reduction within the ADP strategy, delivery and/or action plan, 83% within their MAT standards delivery plan and 73% within their service development, improvement and/or delivery plan. Additionally, 40% included stigma reduction within their communication strategy, 33% within their drug deaths and harms prevention action plan and 27% in each community action plan and alcohol deaths and harms prevention action plan. Other answers included allocated funding within family support services, stigma action groups and inclusion within documentation relating to mental health, suicide prevention and adverse childhood experiences (ACEs) and substance use.
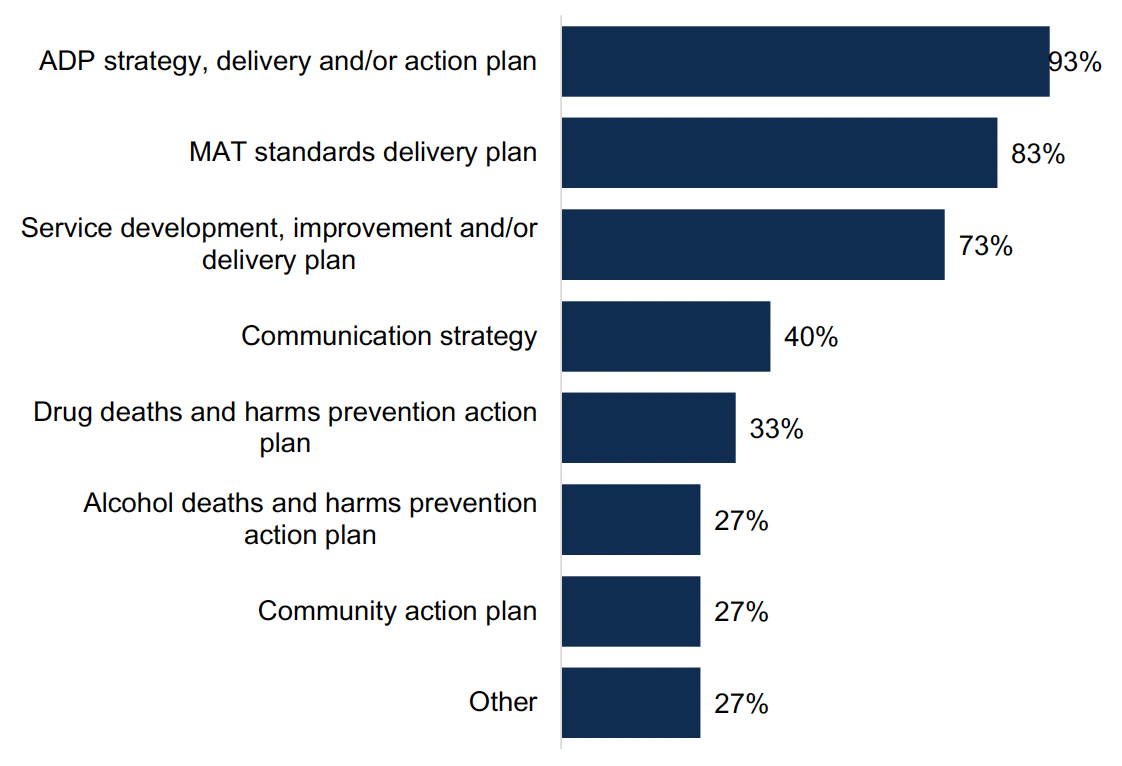
Percentage of ADPs who include stigma in their written policies or strategies
Figure 4 Chart showing percentage of ADPs who include stigma in their written policies or strategies
ADPs described a range of ways in which work is underway to reduce stigma for people who use substances and/or their families. These include:
- Developing local charters of rights, with engagement from organisations such as the National Collaborative, as well as stigma strategies, guidance and planning.
- Running campaigns and promotion of services and support, alongside awareness events, visibility programmes and arts events.
- Facilitating community cafes and drop ins, and ensuring the delivery of recovery and support events in neutral community venues.
- Delivery training to staff and students on issues around rights and stigma awareness, including stigma training from Scottish Drugs Forum.
- Adopting trauma-informed approaches within existing activities.
- Working with partners, including those working in mental health, violence against women, child protection, justice and community planning.
- Engaging with people with lived experience, including through engagement events, to provide feedback to service providers on stigmatising experiences.
- Allocating funds to deliver activities relating to prevention and stigma reduction through local projects.
- Providing outreach within schools and community settings.
- Providing information on recommended language for services and key stakeholders.
ADPs were asked what data they have access to that could be used to capture the impact of the work underway to reduce stigma for people who use substances and/or their families. For those who reported that they had access to data that could be used to capture evidence of the impact of work underway, sources included:
- Evaluations from specific projects funded by ADPs.
- Feedback from training sessions to highlight gaps in knowledge, as well as information on who has completed local stigma awareness training.
- Feedback from networks and individuals gathered through routes such as local drop ins and events.
- Case studies based on reporting from commissioned services.
- Peer research linked to recovery communities, MAT standards and lived/living experience groups led by partners.
However, many ADPs reported that they did not currently have access to relevant information, with some indicating future plans to report through evaluations, performance frameworks, experiential data gathering and updates from organisations receiving grants.
6. Outcome 1: Fewer people develop problem substance use
Information provision
ADPs were asked how information on local treatment and support services is made available to different audiences at an ADP level[1], shown in Figure 5. Across all groups, ADPs primarily utilised online approaches to communicate information, such as the use of websites, social media and apps. Leaflets and posters were next most common, followed by in-person events and workshops. Generally, ADPs appeared to focus on one or two key modes of communication. Three ADPs used all methods of sharing information across the different audiences, and five ADPs did not report sharing information with the different audiences through any of these means.
Overall, the groups most widely targeted across the different communication methods were women, people who are experiencing homelessness, people who are LGBTQI+ and people who are pregnant or peri-natal. Groups least targeted through different mechanisms were non-native English speakers, people with hearing and/or visual impairments and people with learning disabilities and literacy difficulties.
There was some variation in how information was targeted to different groups, with in-person events most commonly used to engage with women, reported in half of ADP areas. Online approaches were most commonly used to engaged with LGBTQI+ people, reported in 70% of ADPs. Leaflets and posters were mostly commonly used to target people experiencing homelessness, reported in 50% of ADP areas, and women, reported in 47% of ADP areas.
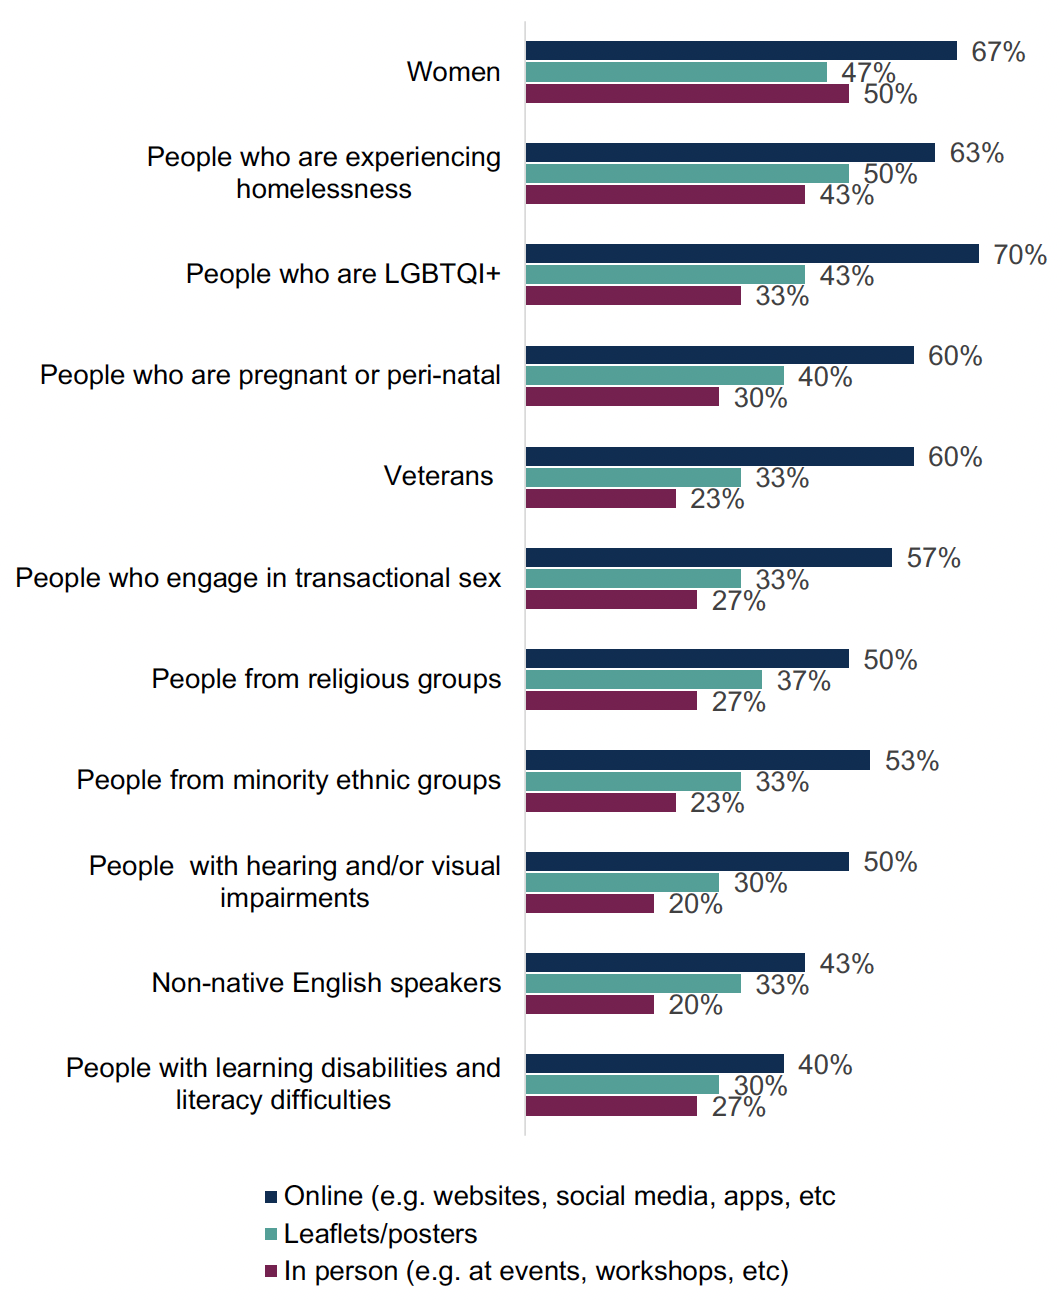
Ways in which information on local treatment and support services is provided to different audiences
Figure 5 Chart showing ways in which information on local treatment and support services is provided to different audiences
Prevention activities
ADPs reported that they funded or supported a range of education and prevention activities for different age groups, shown in Figure 6[2]. Across ADPs, the widest variety of education and prevention activities was available for young people (ages 16-24 years), followed by adults (age 25+ years) and then children (0-15 years).
For children, the most common activities provided were youth activities (77% of ADP areas), learning materials (73% of ADP areas) and mental wellbeing activities (67% of ADP areas). The least common activities were peer-led interventions (23% of ADP areas) and Planet Youth[3] (27% of ADP areas). For young people, the most common activities provided were harm reduction (97% of ADP areas), mental wellbeing activities (90% of ADP areas), campaigns/information (83% of ADP areas) and learning materials (83% of ADP areas). The least commonly provided activity was Planet Youth (23%). For adults, the most commonly provided activities were harm reduction (90% of ADP areas), campaigns/information sharing (83% of ADPs) and mental wellbeing activities (80%).
Other responses across all age groups included counselling services.
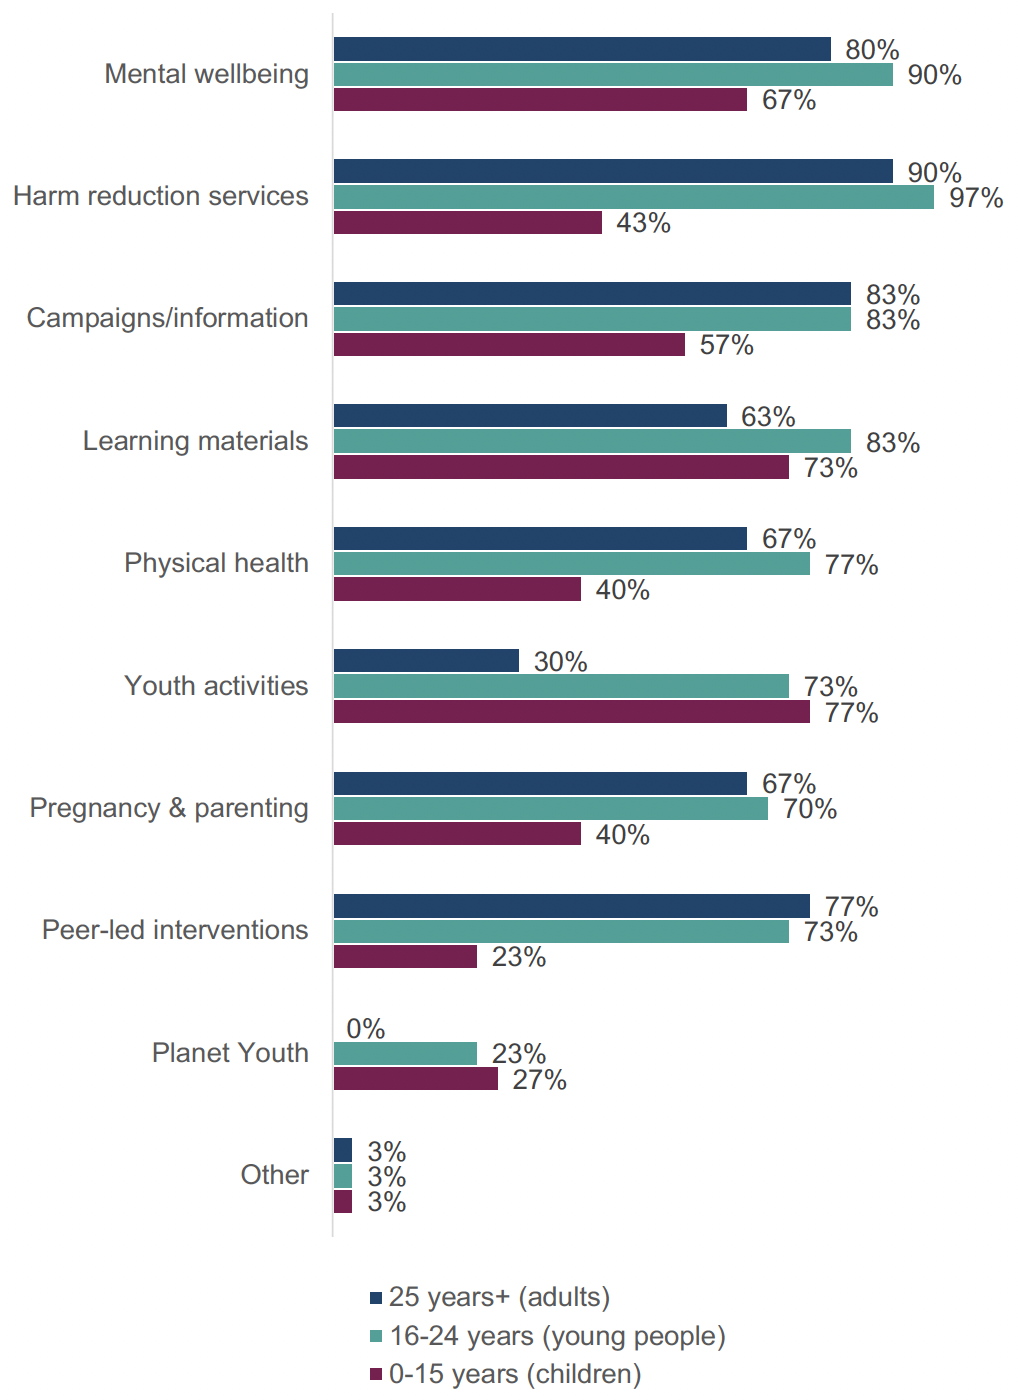
Education or prevention activities funded or supported by ADPs by age group
Figure 6 Chart showing education or prevention activities funded or supported by ADPs by age group.
7. Outcome 2: Risk is reduced for people who use substances
Harm reduction initiatives
ADPs were asked to report on the availability of four key harm reduction initiatives in their area: naloxone supply, Hepatitis C testing, injecting equipment provision and wound care, shown in Figure 7. Overall, naloxone was most widely available, with drug services and mobile/outreach services providing most initiatives in most areas. Since last year’s survey there were changes in services where ADPs reported harm reduction initiatives being available, the reasons for which are currently being explored in wider work.
- Supply of naloxone Supplies of naloxone were available in drug services in all ADP areas, followed by mobile/outreach services in 90% of areas, peer-led initiatives in 83% of areas and community pharmacies in 77% of areas. Supplies of naloxone were least likely to be carried in general practices (33% of ADP areas), sexual health services (33%) and women’s support services (37%). In general, there was a reduction in ADPs reporting availability of naloxone across many services since last year’s survey, including a 13% reduction in the number of ADPs where naloxone is supplied in community pharmacies and a 12% reduction in ADPs where it is supplied in women’s support services.
- Hepatitis C testing Hepatitis C testing was provided in drug services in 97% of ADP areas and in mobile/outreach services in 80% of areas, as well as in sexual health services in 70% of areas and in general practices in 67% of areas. Hepatitis C testing was only available in young people’s services in 10% of ADP areas and in women’s support services in 20% of ADP areas. The number of ADPs reporting Hepatitis C testing being offered in many services has increased since last year, such as in family support services (increase of 13% of ADPs reporting its availability) and in community pharmacies (increase of 9% of ADP areas), though a reduction in some, including in justice services (decrease of 11% ADP areas) and in peer-led initiatives (decrease of 11% ADP areas).
- Injecting Equipment Provision IEP was provided in drug services in all ADP areas, in mobile/outreach services in 93% of ADP areas and in community pharmacies in 87% of ADP areas. IEP was provided least often in young people’s services (7% of ADP areas), in women’s support services (10%) and in general practice (10%). Across ADP areas there were both increases and reductions in the range of services IEP is provided in, including a reduction of 13% of ADP areas providing IEP in community pharmacies and 11% in justice services, and an increase of 6% of ADPs reporting availability of IEP in both homelessness services and family support services.
- Wound care Wound care was provided in drug services in 97% of ADP areas, in hospitals in 83% of ADP areas and in general practice in 73% of ADP areas. It was least likely to be provided in peer-led initiatives (7% of ADP areas), in young people’s services (7% of ADP areas) and in women’s support services (10%). Since last year, there was an increase in ADPs reporting wound care availability in services including in family support services (10%) and in mental health services (6%), and a decrease in services including in general practices (13%) and in mobile/outreach services (6%).
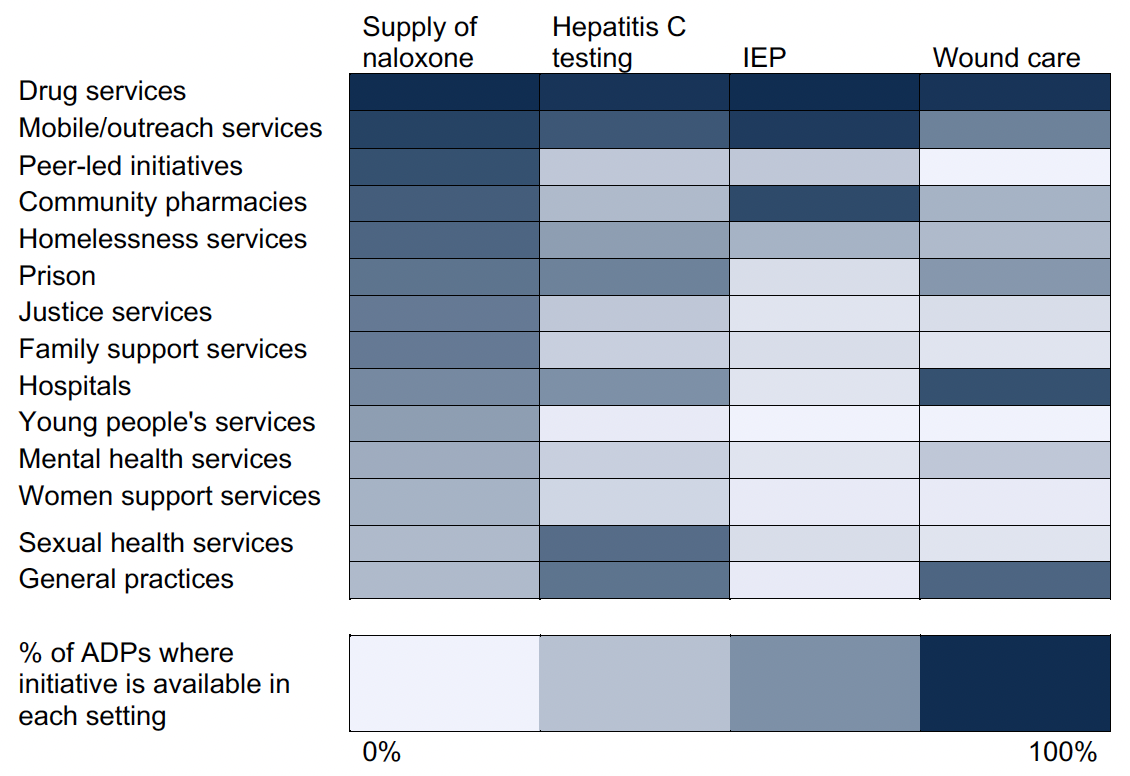
Percentage of ADPs reporting services in which harm reduction initiatives are available
Figure 7 Heatmap showing services in which harm reduction initiatives are available
Demand for harm reduction interventions
ADPs were asked what harm reduction interventions there was currently a demand for in their area, either where the intervention is not currently provided or where demand exceeds current supply, shown in Figure 8. Three quarters (73%) of ADPs reported a demand for drug checking and 60% reported a demand for safer inhalation pipe provision. Half of ADPs (50%) reported demand for drug testing strips and around a quarter reported demand for safer drug consumption facilities[4] (27%), Heroin Assisted Treatment (27%) and safe supply of substances[5] (23%). The ADPs who reported a demand for safer drug consumption rooms were primarily those with a greater proportion of urban areas. The other response reported a demand for harm reduction advice and support in relation to psychostimulant use, specifically cocaine and ketamine.
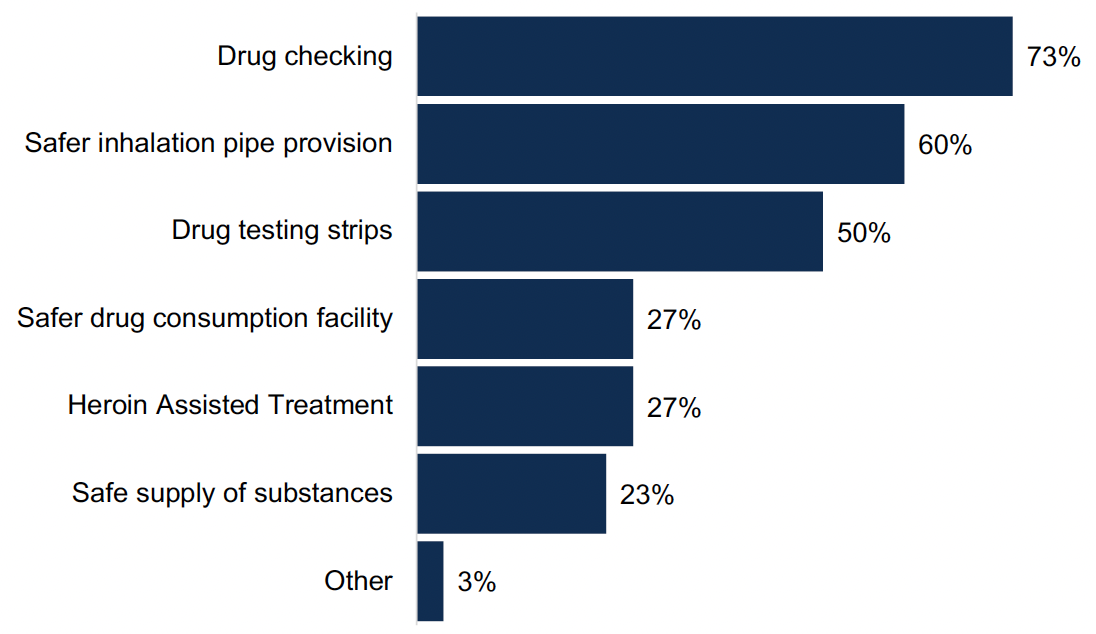
Percentage of ADPs where there is a demand for harm reduction interventions
Figure 8 Chart showing the percentage of ADPs where there is a demand for harm reduction interventions
Several ADPs reported that while demand was difficult to quantify, needs assessments, surveys and more anecdotal engagement with both staff and people with lived/living experience indicated demand for harm reduction interventions not currently provided. ADPs highlighted increased use of crack cocaine as being related to a higher demand for safer inhalation pipe provision, as well as growing concerns about xylazine and nitazines increasing the need for drug checking. ADPs noted the legal and practical obstacles to providing some interventions.
8. Outcome 3: People most at risk have access to treatment and recovery
Near-fatal overdose pathways
All ADPs reported having documented pathways for people who have experienced a near-fatal overdose (NFO) to be identified and offered support, shown in Figure 9. Pathways were most commonly in place through the Scottish Ambulance Service (97%), specialist substance use treatment services (93%), third sector (77%) and hospitals (73%). ADPs identified areas where pathways were in development, particularly in mental health services (in 20% of ADP areas), hospitals (in 17% of ADP areas) and housing services (in 17% of ADP areas). Other responses included pathways through criminal justice services.
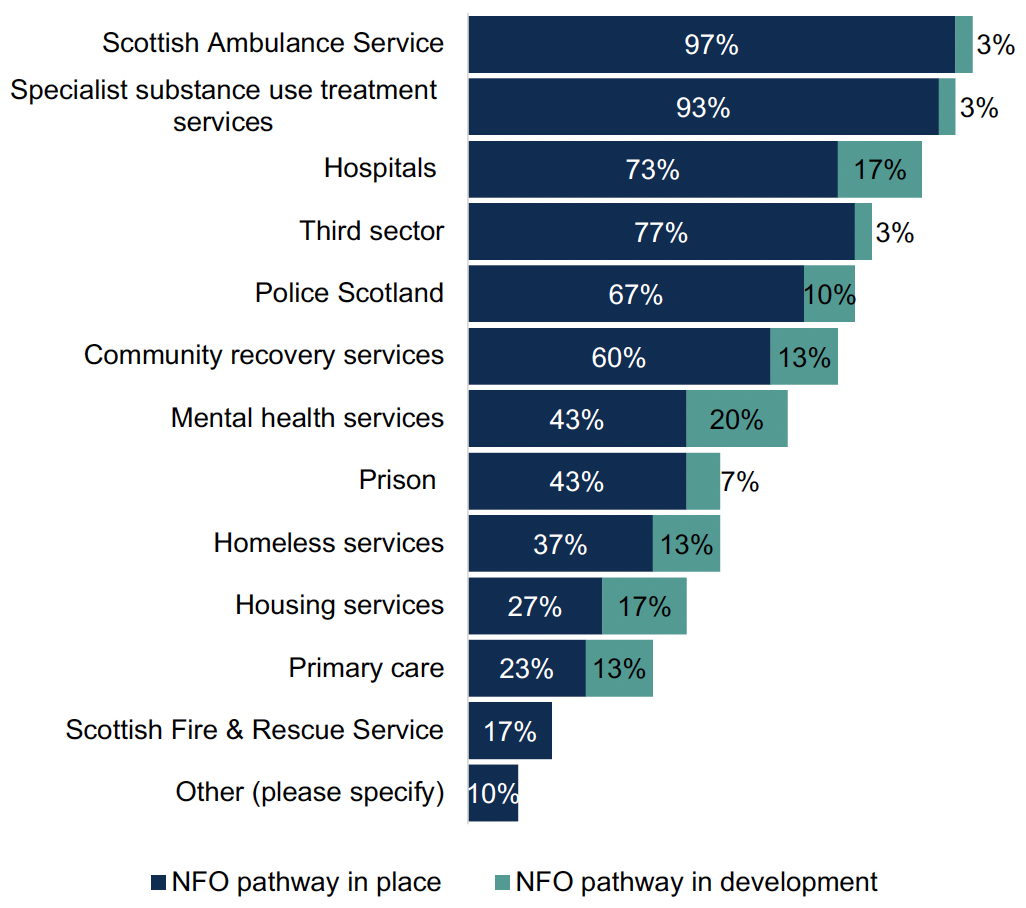
Percentage of ADPs with documented NFO pathways in place and in development
Figure 9 Chart showing the percentage of ADPs with documented NFO pathways in place and in development
The most commonly reported barriers to implementing NFO pathways, shown in Figure 10, were issues around information sharing (reported by 53% of ADPs), workforce capacity (50% of ADPs) and insufficient funds (50% of ADPs). Other barriers reported included poor staff retention and the barrier this places on effective communication, and lack of infrastructure and staffing to support out of hours working or expanded core business hours.
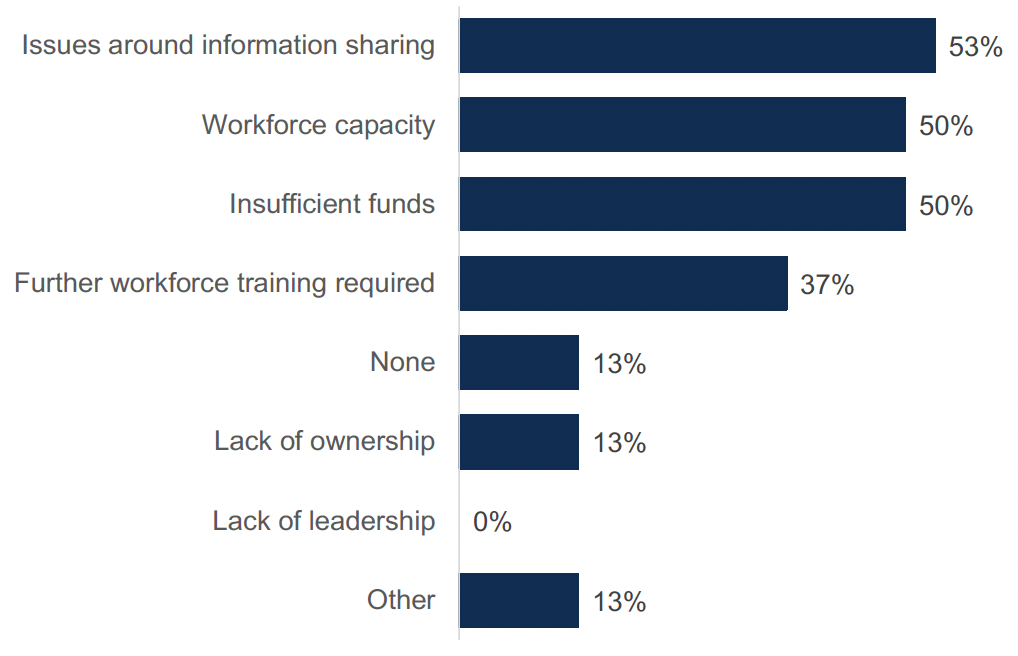
Percentage of ADPs reporting barriers to implementing NFO pathways
Figure 10 Chart showing the reported barriers to implementing NFO pathways
Justice partnerships
ADPs were asked in what ways they have worked with justice partners at strategic, operational and service levels.
At a strategic level, all ADPs had justice organisations represented on the ADP and 93% had ADP representation on local Community Justice Partnerships. 87% had coordinated activity between justice, health or social care partners and 87% had justice partners contributing to strategic planning. Two thirds (67%) had data sharing. Other responses included collaborative working across a range of areas which can intersect with criminal justice, such as child protection and mental health and wellbeing, development of strategies around areas such as stigma and within specifically funded projects.
At operational level, 77% of ADPs supported staff training for professionals in justice partner agencies on drug and alcohol related issues, 70% raised awareness about community-based treatment options and 27% provided funding or staff for a specialist court[6]. Other responses were reported by 20% of ADPs, which included: work with criminal justice partners to fund staff costs for roles including justice support, addiction and peer workers in justice settings; having Community Justice Partnerships fund specialist staff from substance use services to support people within the justice systeml; awareness raising activities in prison settings; and funding provided to Women’s Justice Services.
At service level, shown in Figure 11, 73% of ADPs indicated that they funded or supported services for people transitioning out of custody and 67% said that they funded or supported services in police custody suites. 57% said they funded or supported services specifically for people served Community Payback Orders with a Drug or Alcohol Treatment Requirement and 53% said they funded or supported for Drug Treatment and Testing Orders (DTTOs)[7]. Around half (47%) said they funded or supported services in prison or young offenders institutions and 30% said they funded or supported navigators for people in the justice system who use drugs. Other responses included funding or support for recovery communities and peer support provision.
Note not all ADPs have prisons or custody facilities. In one case criminal justice support was led by partners and not the ADP.
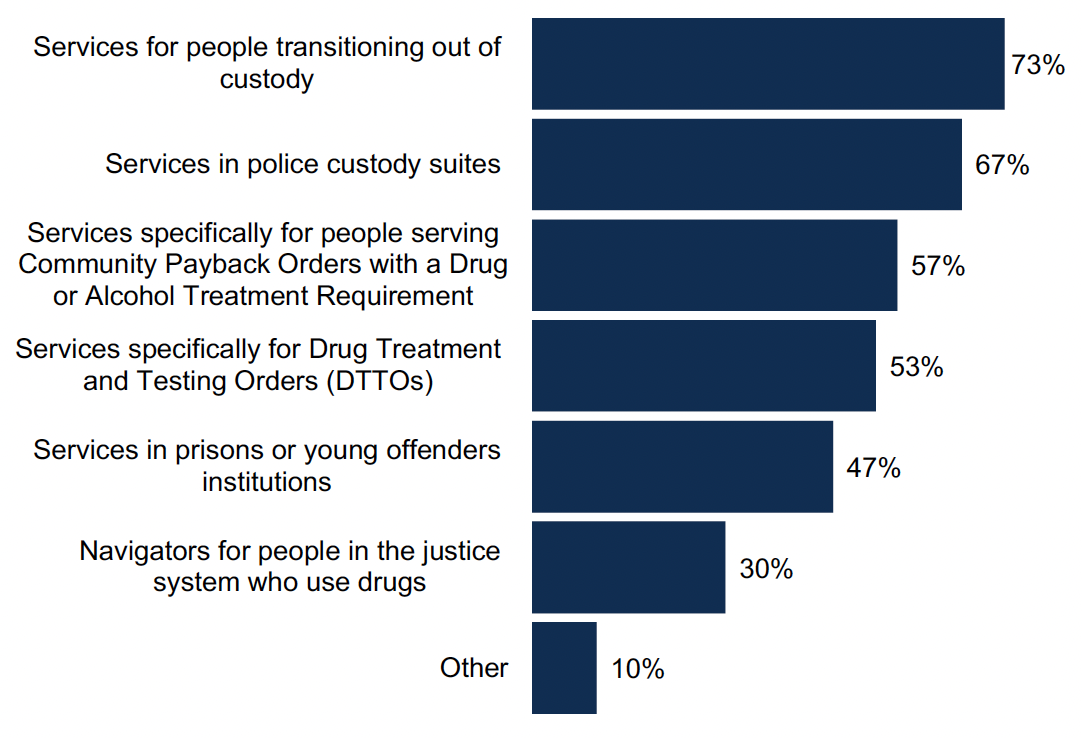
Percentage of ADPs reporting ways in which the ADP works with justice partners at a service level
Figure 11 Chart showing ways in which ADPs work with justice partners at a service level
Activities within justice system
ADPs supported a range of activities at different stages of engagement with the justice system, shown in Figure 12. Compared with last year’s survey, the percentage of ADPs supporting activites had mostly increased at pre-arrest and police custody stages, and had mostly stayed the same upon release (in courts and in prisons were not included in the survey last year). Like last year, there were still the highest range of reported activities upon release, followed by those in police custody, in prison[8] and pre-arrest. ADPs were least likely to support activities in courts.
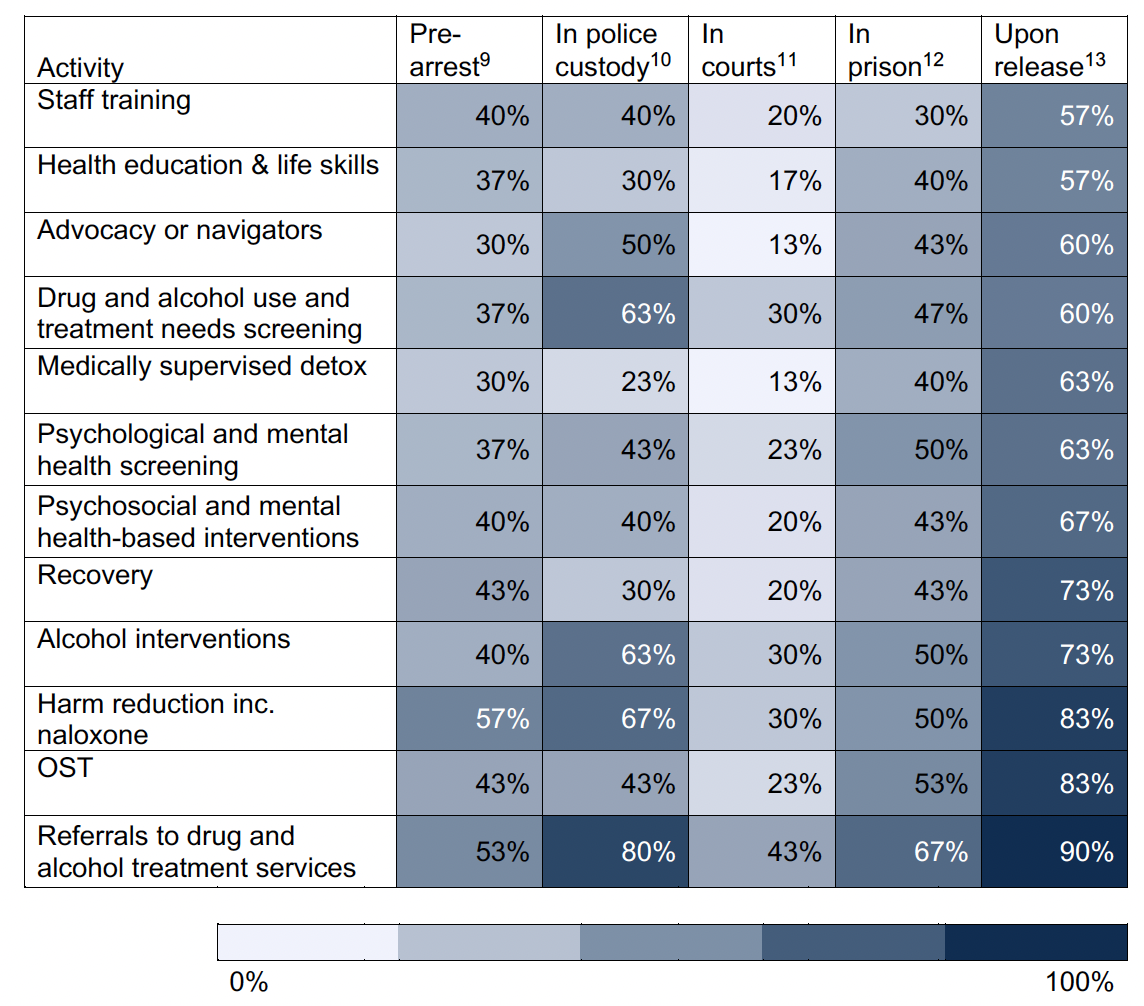
Percentage of ADPs who reported supporting activities at each stage of the justice system.
Figure 12 Table showing the percentage of ADPs who supported activities at each stage of the justice system.
Nine out of ten ADPs said that they have testing services available in the ADP area for individuals who have had a court order given to them in relation to their substance use[14]. This includes urine and saliva testing and breathalyser testing for alcohol, which was most commonly available through justice social work settings. ADPs were asked if they fund or support any residential services that are aimed at those in the justice system (who are subject to Community Payback Orders, Drug Treatment and Testing Orders, Supervised Release Orders and other relevant community orders) and asked to list the relevant services. A number of ADPs reported that they had residential services which are accessible to those engaged in the justice system, which included commissioned residential rehabilitation facilities and the Turnaround Service, provided by Turning Point. However, due to inconsistencies in the responses and therefore a likelihood that there were different interpretations of this question, it is not possible to report on this question.
9. Outcome 4: People receive high quality treatment and recovery services
Screening options for alcohol harms
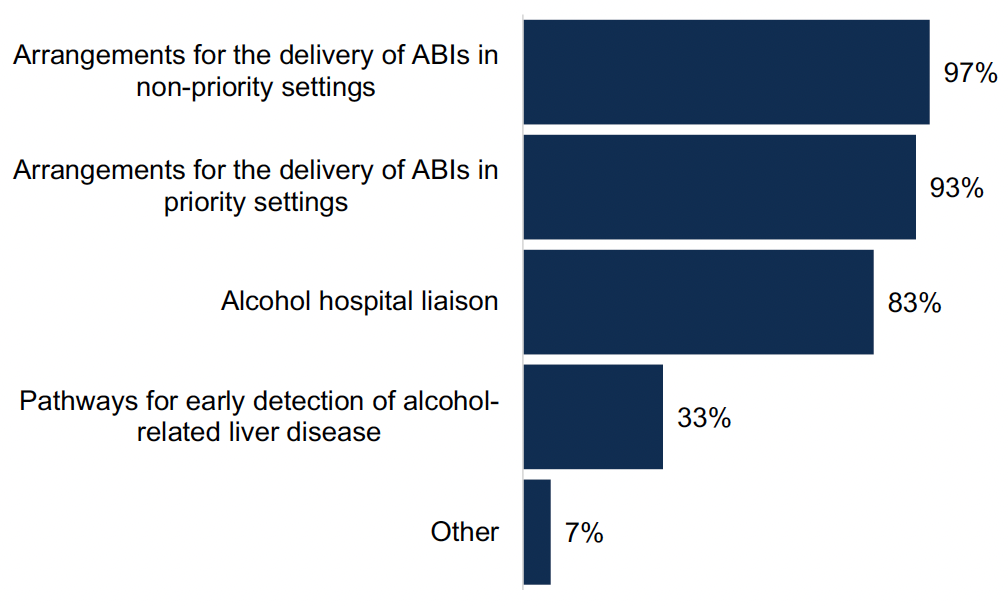
All ADP areas reported having screening options in place to address alcohol harms, shown in Figure 13. Nearly all (97%) ADP areas had arrangements for the delivery of alcohol brief interventions (ABI)[15] in non-priority settings, an increase of 7% since last year, and 93% had arrangements for the delivery of ABI in priority settings, which was the same as last year. Around four in five ADPs (83%) had alcohol hospital liaison in place, which was ten percentage points lower than last year, while one third (33%) had pathways for the early detection of alcohol-related liver disease. Other responses for screening options were fibro screening and alcohol screening on admission to prison.
Percentage of ADPs with screening options to address alcohol harms in place
Figure 13 Chart showing the percentage of ADPs with screening options to address alcohol harms in place
Treatment options for alcohol harms
A range of treatment options to address alcohol harms were in place in all ADP areas. Residential rehabilitation, community alcohol detox and access to alcohol medication were available in all ADP areas. Psychosocial counselling and in patient alcohol detox were available in 97% of ADP areas, and pathways into mental health treatment and alcohol hospital liaison were available in 93% of ADP areas. Alcohol related cognitive testing was available in 80% of ADP areas. This is similar to last year, with a small reduction in the number of ADP areas providing alcohol related cognitive testing. Other responses included referrals to in patient detox in other areas where beds are not available within that ADP area, and primary care-based alcohol assertive outreach.
Residential rehabilitation
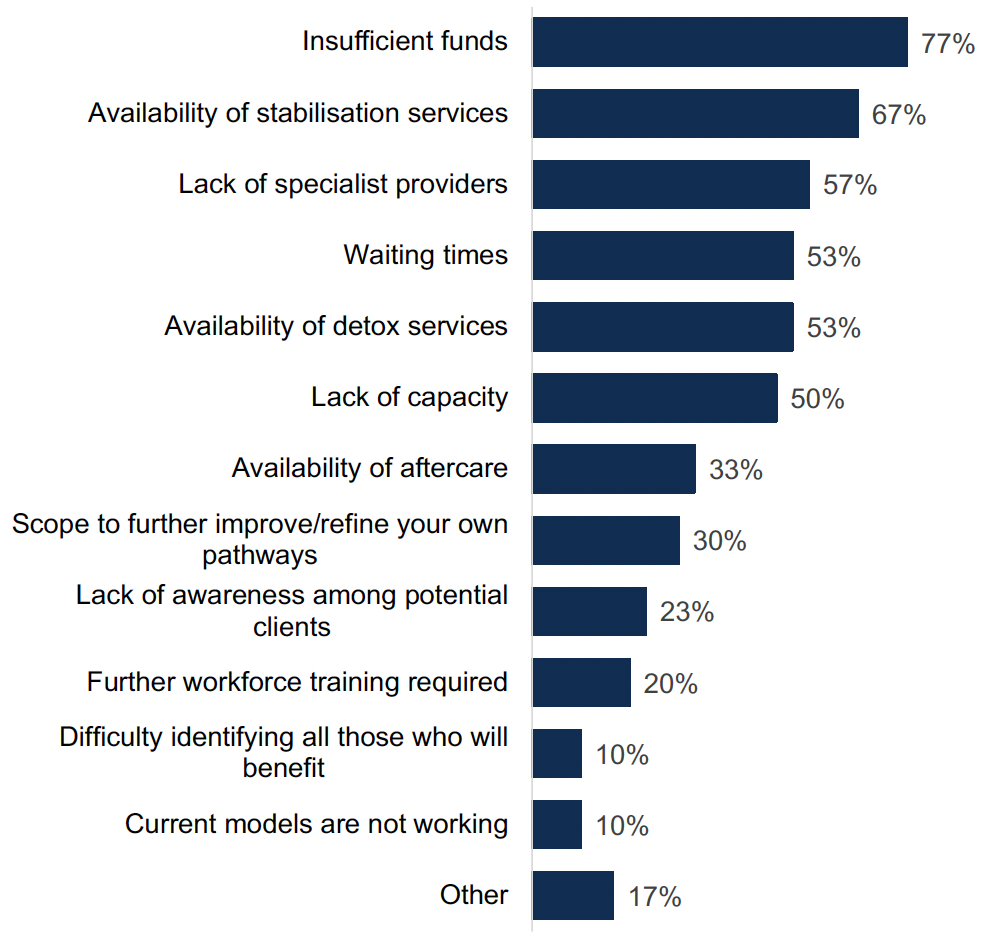
All ADPs reported barriers to residential rehabilitation, shown in Figure 14, with changes to the barriers which were reported last year. The most commonly reported barrier was insufficient funds, reported in 77% of ADP areas, an increase from 48% of ADP areas last year. Availability of stabilisation services was the next most commonly reported barrier (67% ADPs), and lack of specialist providers (57%), which were similar to last year. Around half of ADP cited barriers around waiting times (53%), availability of detoxification services (53%) and lack of capacity (50%). There was reduction in the reporting of barriers around further workforce training required (41% of ADPs last year compared to 20% this year), scope to further improve/refine your own pathways (38% last year compared to 30% this year) and difficulty identifying all those who will benefit (17% last year compared to 10% this year).
Other responses included:
- The need to understand unmet need within vulnerable communities, with barriers including fear of loss of tenancy and benefits, and concerns about social connections.
- Geographical distance to residential rehabilitation.
- Lack of facilities in the ADP area.
- Lack of availability of dedicated support for families.
- Lack of crisis services.
- Variation in prices across different rehab providers.
- Lack of service providers who offer continued OST and other medication.
Percentage of ADPs who identified barriers to residential rehabilitation in their area
Figure 14 Chart showing the percentage of ADPs who identified barriers to residential rehabilitation in their area
ADPs described a range of actions being undertaken to overcome these barriers to residential rehabilitation. Actions reported focused around areas including the improvement of local pathways, the provision of pre- and post-rehab support, development work with providers of residential rehabilitation and utilisation of Corra funding for additional beds, though several noted that this would be unlikely to meet the needs of all those who would benefit from residential rehabilitation.
Just under two thirds (60%) of ADPs had made revisions to their pathways to residential rehabilitation in the last year. Changes were made for a variety of reasons, including consultation with Healthcare Improvement Scotland (HIS), updates to align with changes in the area (such as new funding being available), increased pressures in some areas (such as referrals coming from prison services) and action in response to staff feedback and client need.
The changes made included:
- Ensuring multi-agency involvement.
- Adding information to the pathways to include information on family support and interventions offered by the local Turning Point Scotland Prevention, Early Intervention and Support service.
- Increased focus on support pre and post rehabilitation and continuity of support.
- Updated contact details.
- Additional preparatory work for certain pathways and timescales for referrals.
- Reducing repetition in referral forms and documentation.
- Adding a female worker to the team to support women within the ADP area.
- Increasing availability of external services to provide opportunities around volunteering, employment, outdoor activities, etc.
MAT standards
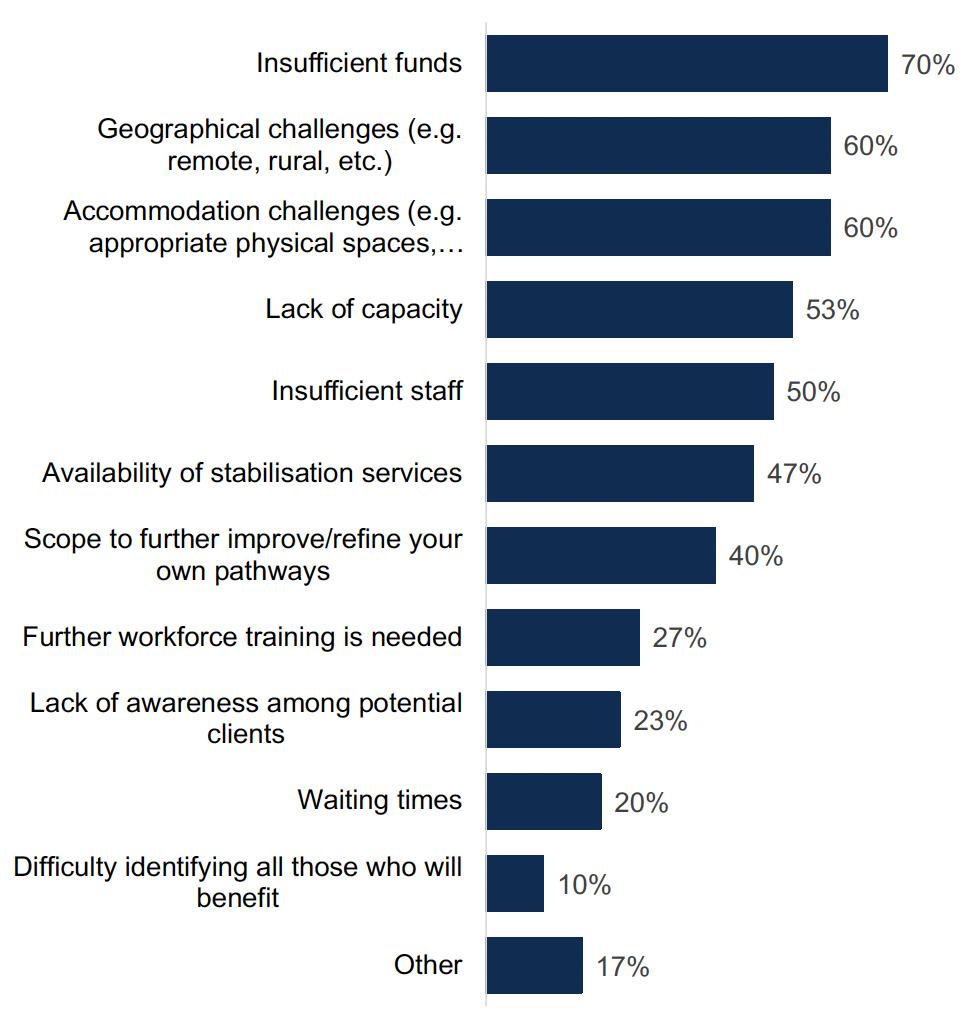
All ADPs reported a range of barriers to implementing MAT in their area, shown in Figure 15. The most commonly reported barriers were insufficient funds (70% of ADP areas), geographical challenges (60% of ADP areas) and accommodation challenges such as appropriate physical spaces (60% of ADP areas). Results were relatively similar to last year, though there was a reduction in the number of ADPs reporting difficulty identifying all those who will benefit (24% last year to 10% this year). Other reported barriers included:
- Lack of staff in specific areas, particularly relating to MAT standards 6, 9 and 10.
- Ambiguity in the measurements and exact definitions of the standards.
- Lack of sustainable funding.
- Demand for treatment for substances, like alcohol, which are not currently included in MAT.
- Fragility of small clinical teams.
Percentage of ADPs who identified barriers to implementing MAT in their area
Figure 15 Chart showing the percentage of ADPs who identified barriers to implementing MAT in their area
ADPs described a range of actions being undertaken to overcome these barriers. These include:
- Work with partners to address financial, staffing and accommodation barriers, including sharing accommodation with third sector organisations and utilising community spaces.
- Work with GPs and primary care to increase community prescribing and integration of teams operationally to provide co-located services.
- Cross boundary working across different ADPs.
- Quality improvement work in collaboration with HIS.
- Engagement with the MAT Implementation Support Team (MIST) to tackle specific remote and rural challenges.
- Reviews of areas including commissioning, recruitment, workforce training, data analysis and capacity building through governance and oversight groups.
- Implementing protected time for psychosocial interventions, coaching and reflective practice.
- Recruitment of additional staff where funding is available - though challenges were highlighted associated with limited recurring funding and the implications for hiring permanent or long-term staff.
Services for young people
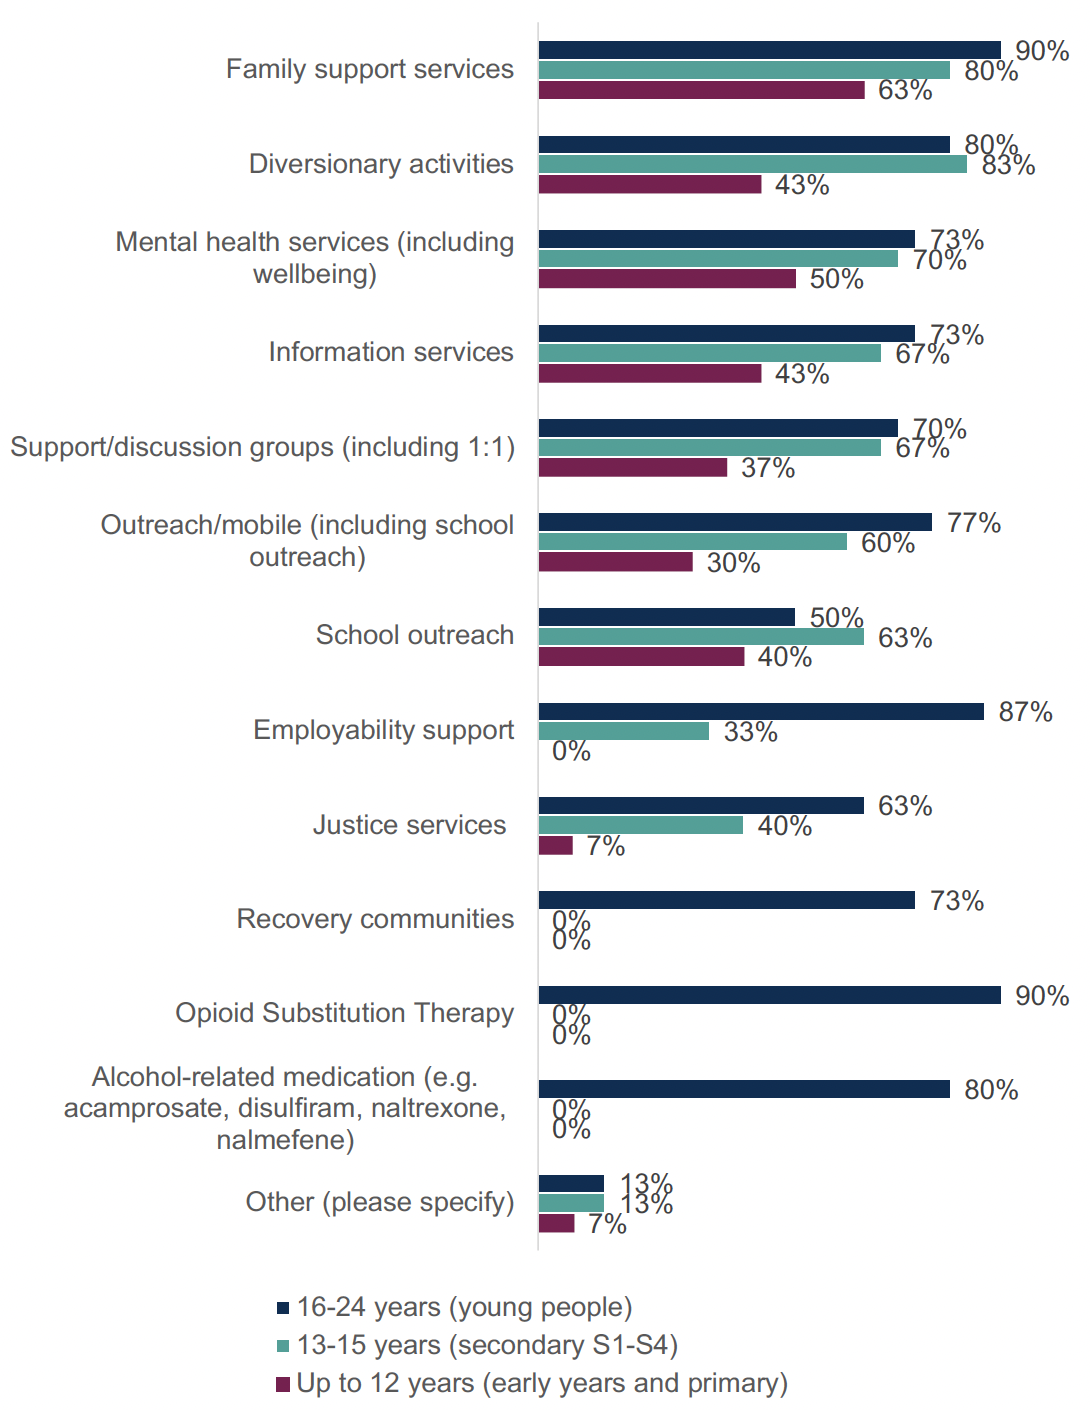
ADPs reported a range of treatment and support services in place specifically for children and young people using alcohol and/or drugs, where different types of support varied by age category, shown in Figure 16[16]. Overall, the widest variety of services were provided for young people (16-24 years), with the smallest range of services being provided for early years and primary (up to 12 years). Combined across all age groups, family support services, diversionary activities, mental health and support/discussion groups were the most commonly provided services.
For early years and primary age children, the most commonly reported provision of services relevant for this age group were family support services (in 63% of ADPs), mental health services (in 50% of ADP areas), diversionary activities (in 43% of ADP areas), information services (in 43% of ADP areas) and school outreach (in 40% of ADP areas).
For secondary S1-S4 (13-15 years), the most commonly provided services relevant to this age group were diversionary activities (in 83% of ADP areas), family support services (in 80% of ADP areas), mental health services in (70% of ADP areas) and support/discussion groups (in 67% of ADP areas). Some ADP did have services in place around employability support (33% of ADP areas), recovery communities (23% of ADP areas) and justice services (40% of ADP areas).
For young people (16-24 years), a wide variety of services were provided in the majority of ADP areas. The most commonly provided services were OST (90% of ADP areas), family support services (90% of ADP areas) and employability support (87% of ADP areas). The least common service to be in place to cater for this age category was school outreach (50% of ADP areas).
Other responses included children and young people being supported by a range of services including addiction services, Children and Adolescent Mental Health Service (CAMHS), social work and specialist nurse and community support services, provision of harm reduction training and naloxone in high school settings.
Percentage of ADPs where treatment and support services are in place specifically for children and young people using drugs and/or alcohol
Figure 16 Chart showing percentage of ADPs where treatment and support services are in place specifically for children and young people using drugs and/or alcohol.
10. Outcome 5: Quality of life is improved by addressing multiple disadvantages
Services for specific groups
ADPs reported having specific treatment and support services for a range of groups, shown in Figure 17. Around three quarters (73%) of ADPs reported that there were specific services in place for women, an increase from 66% of ADPs in last year’s survey. Six in ten ADPs reported services in place for people who are pregnant or peri-natal and the same proportion reported services for people who are experiencing homelessness, which was similar to last year. There were smaller proportions of ADPs who reported services for people with learning disabilities and literacy difficulties (13%), people with hearing impairments and/or visual impairments (17%) and people from religious groups (20%). These were similar proportions to last year’s survey.
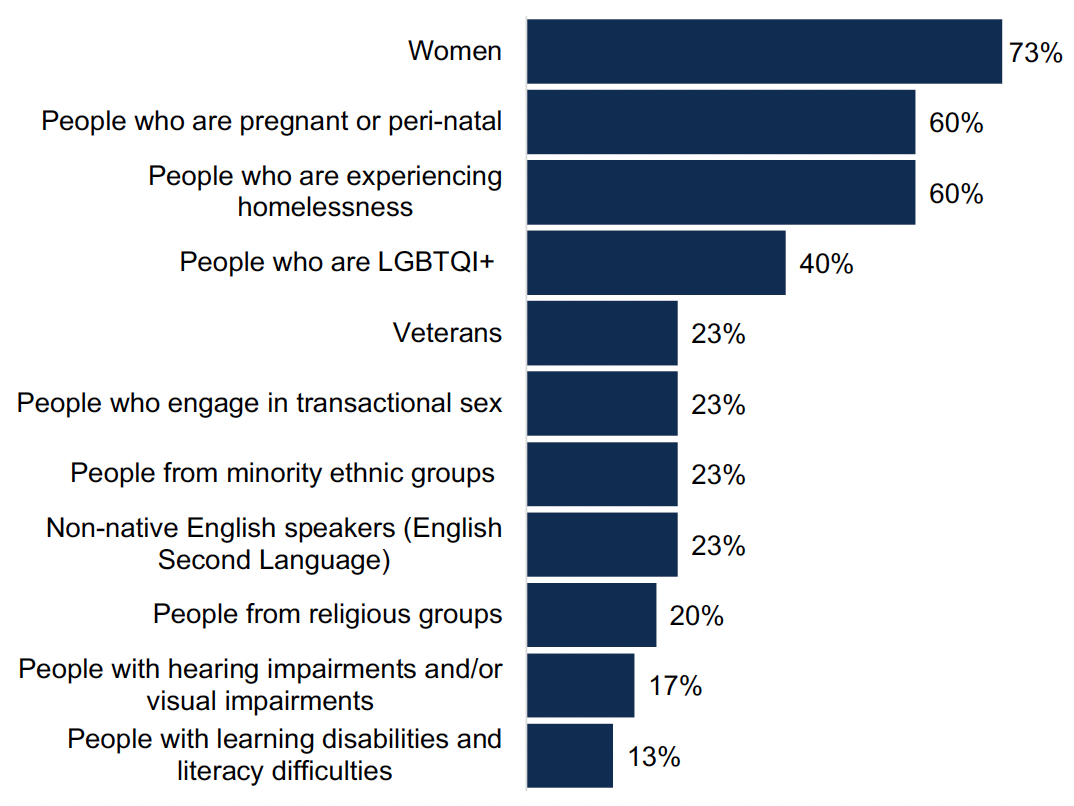
Percentage of ADPs with treatment and support services in place for specific groups
Figure 17 Chart showing percentage of ADPs with treatment and support services in place for specific groups
Mental health
Nearly nine in ten (87%) ADPs reported that they had formal joint working protocols in place to support people with co-occurring substance use and mental health diagnosis to receive mental health care, shown in Figure 18. This was an increase from 59% in last year’s survey.
Nearly all (97%) ADP areas had arrangements in place within their area for people who present at substance use services with mental health concerns for which they do not have a diagnosis. In 97% of areas, ADPs reported professional mental health staff within substance use services, such as psychiatrists, community mental health nurses etc. In 80% of areas ADPs reported pathways for referral to mental health services or other multidisciplinary teams and in 67% of areas there are formal joint working protocols between mental health and substance use services specifically for people with mental health concerns for which they do not have a diagnosis. In 17% of ADP areas dual diagnosis teams were reported. Other arrangements included the provision of mental health assessments for patients who are presenting with mental health problems, the organisation of joint appointments where cooccurring mental health and problem substance use is identified, and triage of appointments jointly between drug and alcohol services and mental health, with professionals meeting to discuss cases.
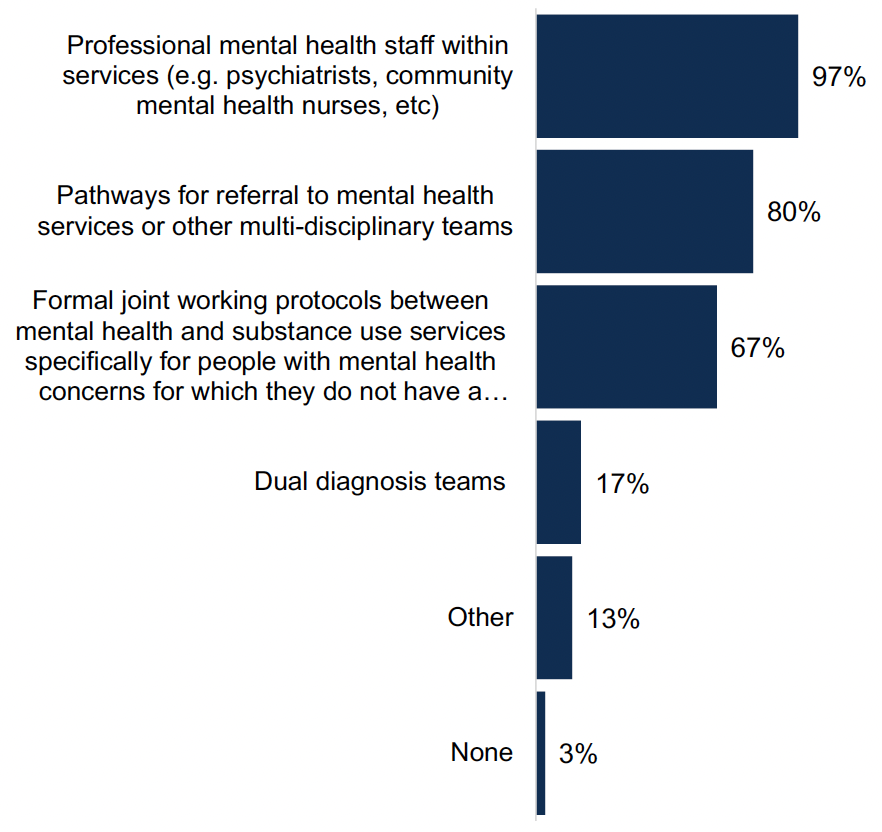
Percentage of ADPs with arrangements in place for people who present at substance use services with mental health concerns for which they do not have a diagnosis
Figure 18 Chart showing the percentage of ADPs with arrangements in place for people who present at substance use services with mental health concerns for which they do not have a diagnosis
Other support services
ADPs used a variety of approaches to work with support services not directly linked to substance use (e.g. welfare advice and housing support). Nearly all ADPs reported working with these services through partnership working (97% of ADPs) and/or by representation on strategic groups or topic-specific sub-groups (97% of ADPs). Nine in ten ADPs (90%) worked with them through their representation on the ADP board and 60% worked via provision of funding. Other reported responses included engagement from ADPs with whole system and community planning groups, as well as wider HSCP, council, third sector and NHS forums, the co-development and planning of “one-stop shops” and links with homelessness coordination. Some ADPs also reported that proactive work takes place at a service level which they are aware of, but which does not always directly involve ADPs themselves.
Trauma-informed approaches
All ADPs reported a range of activities which have been undertaken in ADP-funded or supported services to implement a trauma-informed approach, shown in Figure 19. Over nine in ten (93%) ADPs reported that services were engaging with people with lived/living experience, which was an increase from 76% of ADPs who reported this last year. A similar number (93%) reported training the existing workforce (compared to 100% last year). Around six in ten ADP areas reported that working groups (60%) and staff recruitment (63%) were approaches being taken to implement a trauma-informed approach, a decrease on last year's survey (79% and 83% respectively). Most (63% of ADP areas) reported provision of trauma-informed spaces/accomodations. Other activites that were reported included the implementation of trauma-informed principles in local recovery hubs, training specifically aligned with MAT standards 6 and 10, and trauma “walk through” events with staff and lived/living experience forums.
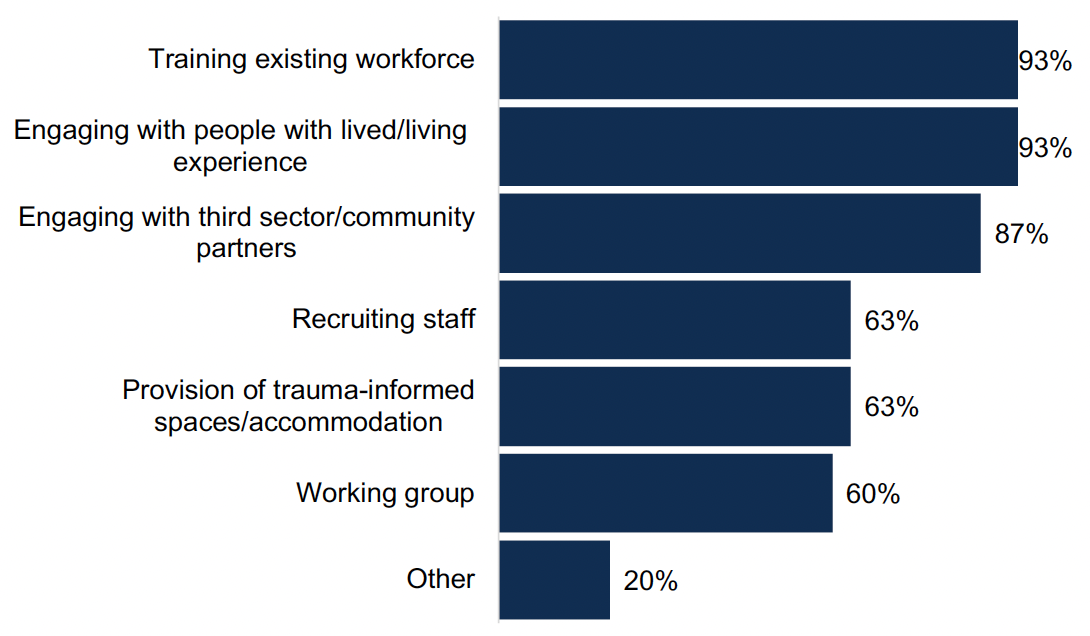
Proportion of ADPs in which activities have been undertaken to implement a trauma-informed approach in services funded or supported by ADPs
Figure 19 Chart showing proportion of ADPs in which activities have been undertaken to implement a trauma-informed approach in services funded or supported by ADPs
Over nine in ten (93%) ADPs reported that they have a specific referral pathway for people to access independent advocacy, with 79% of those being commissioned directly by the ADP.
11. Outcome 6: Children, families and communities affected by substance use are supported
Services for children and young people affected by a parent or carer’s substance use
ADPs reported a range of treatment and support services in place for children and young people who are affected by a parent or carer’s substance use, shown in Figure 20[17]. The most commonly provided services across age categories were carer support, diversionary activities and family support services. The age group with the widest range of services offered to them across all ADPs was 16-24 years, followed by 13-15 years and then up to 12 years.
For early years and primary (up to 12 years), the most commonly reported services in place were carer support (83% of ADPs) and family support services (83% of ADPs). The least commonly reported services relevant for this age group were recovery communities (7% of ADPs), mobile/outreach services (27% of ADPs) and support/discussion groups (33% of ADPs).
For secondary S1-S4 (age 13-15 years), the most commonly reported services relevant for this age group were carer support (90% of ADPs), diversionary activities (87%) and family support services (83%). The least reported services were employability support (27% of ADP areas) and recovery communities (27% of ADP areas).
The majority of ADPs reported a wide range of services aimed at young people (age 16-24 years). This includes carer support, diversionary activities and family support services reported in 87% of ADP areas. The least commonly reported services were support/discussion groups in 60% of ADP areas and outreach/mobile and school outreach services, which were each available in 67% of ADP areas.
Other reported services included social work services, providing support to young people aged up to 25 years if care experienced, first aid training and specific youth work services targeting children and young people affected by others’ substance use.
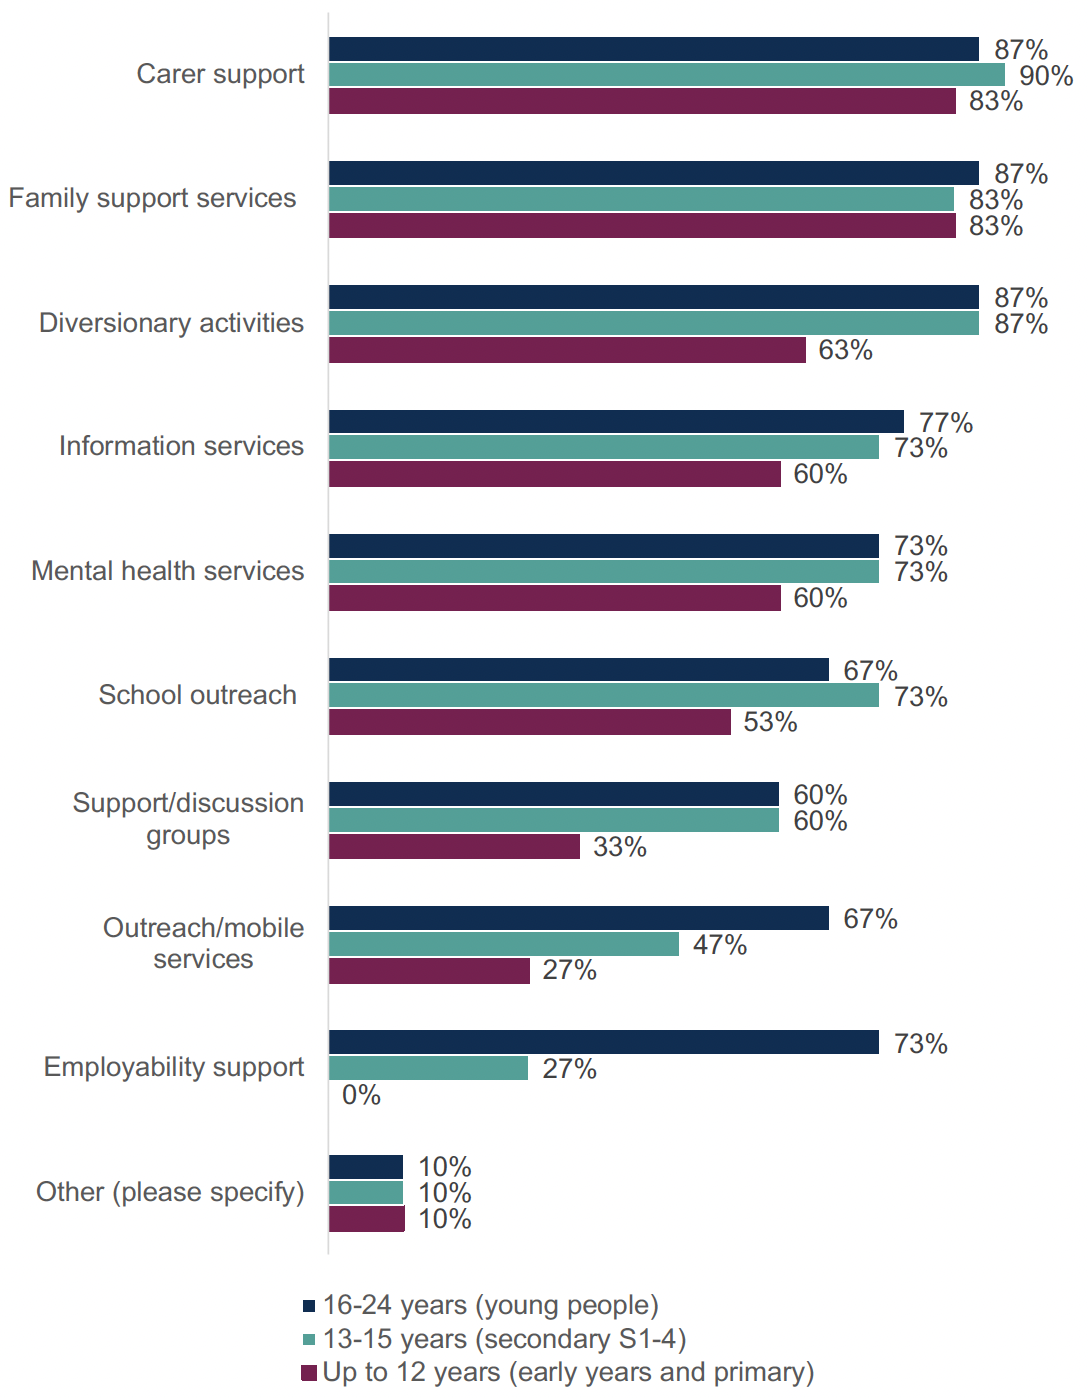
Percentage of ADPs with treatment or support services in place for children and young people affected by a parent or carer’s substance use
Figure 20 Chart showing the percentage of ADPs with treatment or support services in place for children and young people affected by a parent or carer’s substance use.
Services for adults affected by another person’s substance use
All ADPs outlined a range of support services in place for adults affected by another person’s substance use. All but one ADP (97%) offered naloxone training and nine in ten offered support groups (90%), which is in line with last year’s survey. Commissioned services were in place in 93% of ADP areas, a reported increase from 79% in last year’s survey. There was a reduction in the number of ADPs reporting mental health support in place, from 66% last year to 43% this year. Other support services reported included social work services where the overall family needs meet the threshold for support and specific family support services provided by SFAD.
Whole Family Approach & Family Inclusive Practice
Over three quarters (77%) of ADPs have an agreed set of activities and priorities with local partners to implement the Holistic Whole Family Approach Framework in their ADP area. Activities varied but included training sessions for statutory services and third sector partners, family learning hubs, parenting groups and support, outdoor activity programmes for young people and the introduction of a mother and baby rehab unit.
ADPs reported a range of services in place to support Family Inclusive Practice or Whole Family Approach, shown in Figure 21, which were similar for those with family members both in and out of treatment. For those with family members in treatment, most ADPs indicated that advice (97%), peer support (83%), advocacy (80%), social activities (77%), youth services (70%), support for families/victims of GBV (60%), and personal development (60%) were in place. Mentoring was less widely available (30% for those in treatment). This service profile is similar to the range of services reported last year, with a reduction in reported services for personal development and mentoring. Other services included bereavement support and support where young people have been targeted by organised crime groups (OCGs).
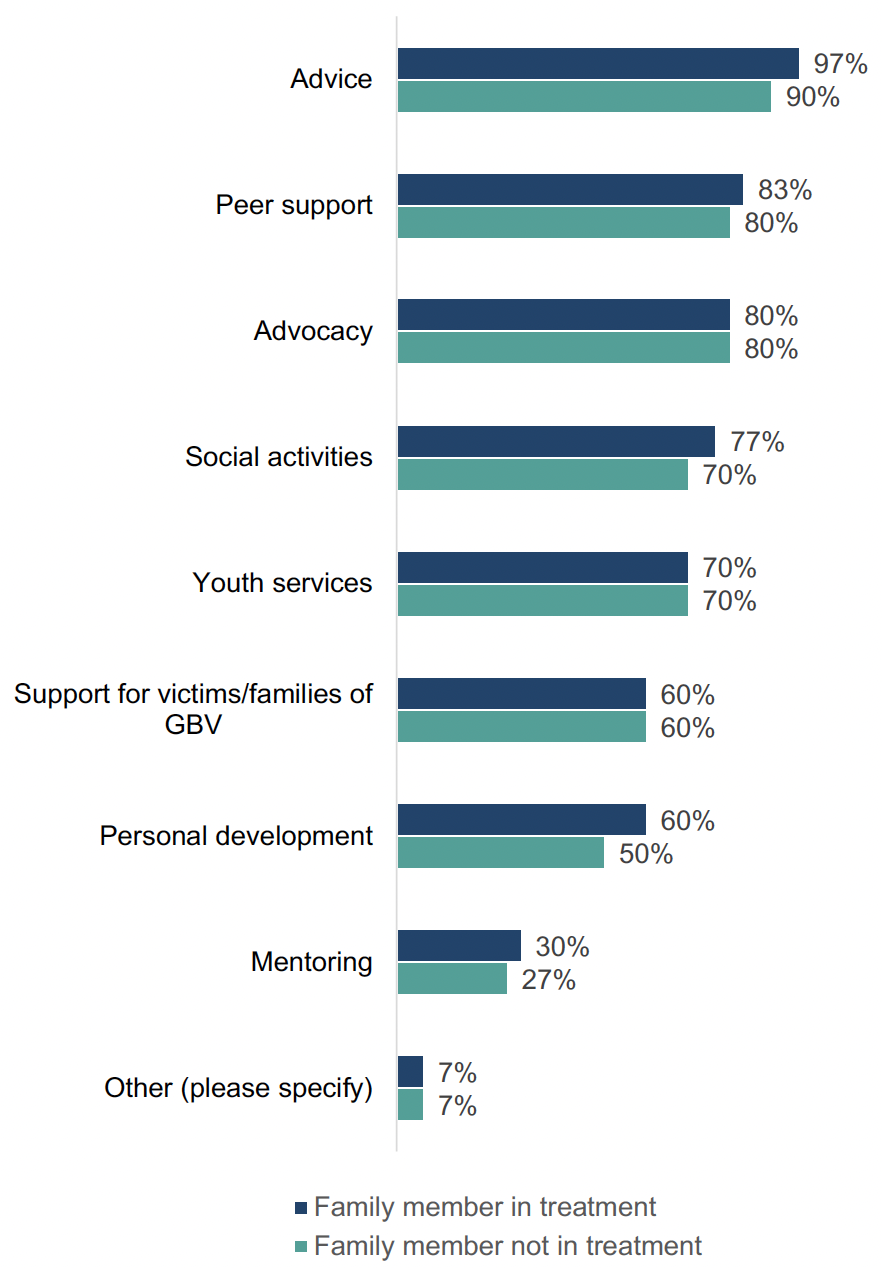
Percentage of ADPs with services in place for supporting family inclusive practice or a Whole Family Approach
Figure 21 Chart showing the percentage of ADPs with services in place for supporting family inclusive practice or a Whole Family Approach
Most (63%) ADPs reported that there are activities in their area which are currently integrated with planned activity for the Whole Family Funding in your Children’s Services Planning Partnership area. These include:
- Co-management of projects, such as those for families affected by substance use.
- Cross-representation on various working groups, with information sharing and joint working where appropriate.
- Joint referrals processes to relevant services, such as kinship support services.
- Development of joint strategies, including around advocacy, children’s services planning and whole family support.
- Joint funding allocations for relevant cross-cutting services, including a health visiting post and services supporting families affected by alcohol and drugs.
- Co-location of services, for example, for vulnerable adolescents.
- Co-ordination around staff training, including around trauma informed care.
Contact
There is a problem
Thanks for your feedback