NHS Scotland assets and facilities 2017: annual report
Seventh edition of the state of NHS Scotland assets and facilities report (SAFR).
Annex B
Review of NHSScotland’s Vehicle Assets
Analysis of vehicle assets is based on annual pro-forma information returned by each NHS Board. NHSScotland’s vehicle assets comprise of approximately 9,600 vehicles, the majority of which are staff car scheme vehicles (54%) and operational cars (17%). The chart below provides a breakdown of NHSScotland's vehicle assets by type.
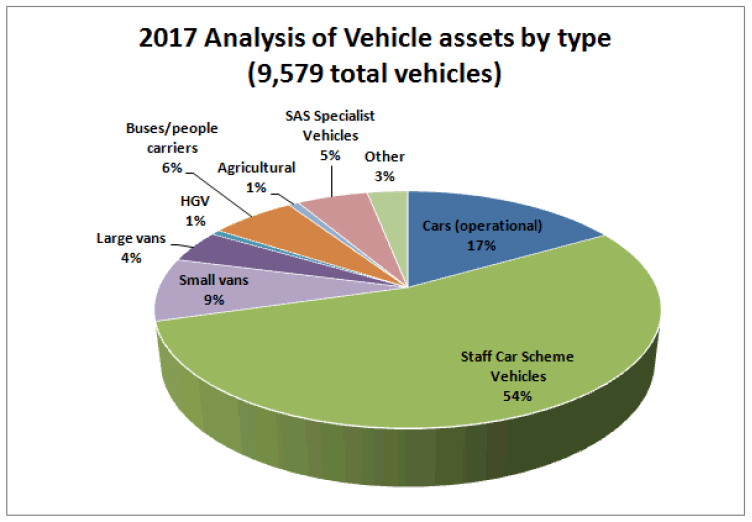
This excludes national logistics vehicles
The distribution of these vehicle assets and their ownership arrangements across NHS Boards and National Health Boards is shown in the following two charts.
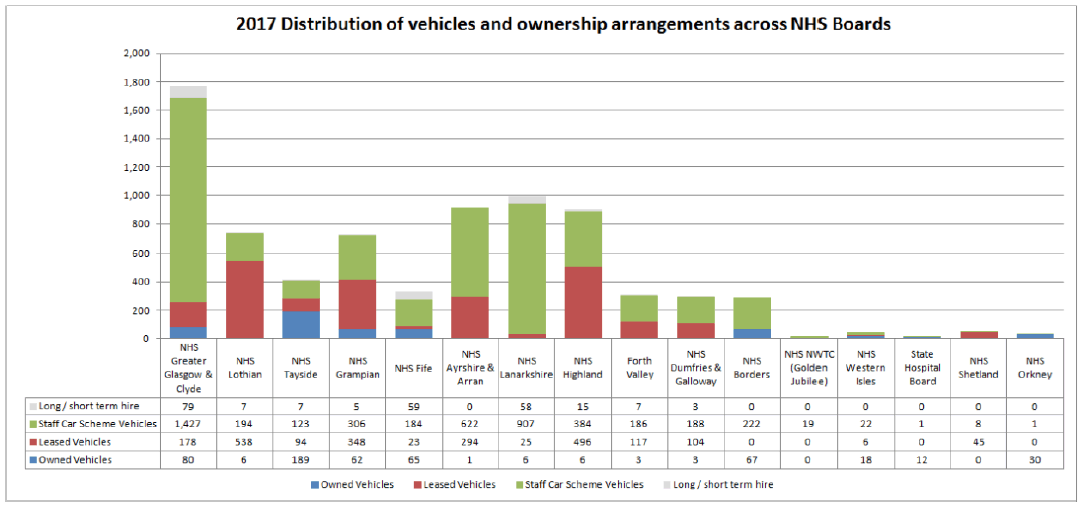
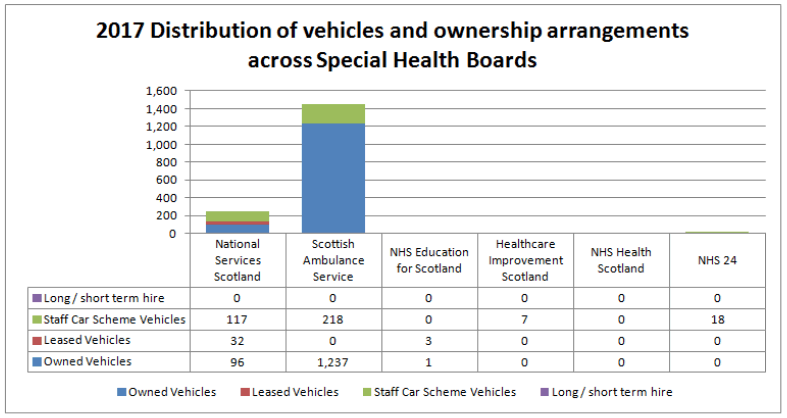
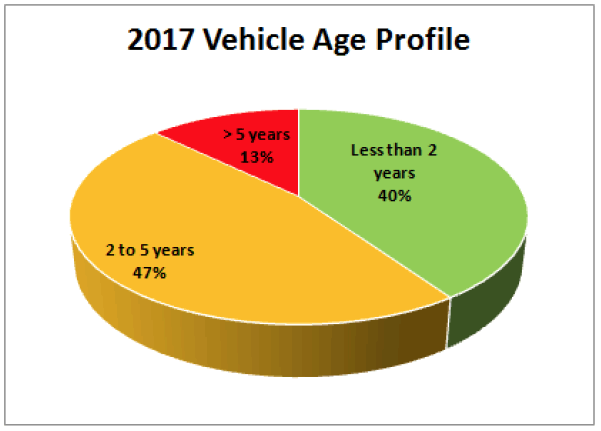
The vehicle age profile for all NHS Boards is shown in the charts that follow and shows that circa 85% of the vehicles are less than five years old. This represents a reasonable age profile for this asset group and indicates that investment is currently maintaining a reasonable standard of vehicle asset provision.
Comparative information on vehicle mileage is sufficient this year to monitor annual changes from the previous year (see table below).
| Total Vehicle Mileage | 2017 | 2016 | % Change in Total Mileage | ||
|---|---|---|---|---|---|
| Total (million) | Per Vehicle | Total (million) | Per Vehicle | ||
| Owned | 28.82 | 15,315 | 32.90 | 16,976 | +7% |
| Leased | 24.11 | 10,468 | 19.84 | 8,764 | -18% |
| Staff Car Scheme | 27.42 | 5,321 | 21.53 | 4,020 | -20% |
| Staff Private Car | 49.35 | 51.09 | -1% | ||
| TOTAL Mileage | 129.70 | 125.37 | |||
The type of fuel used by these vehicles is also an important consideration and the following chart shows the current reliance on diesel fuel (77% of vehicles). However, there continues to be a gradual increase in the number of alternatively fueled vehicles, which is now at 100 vehicles, a 50% increase from last year.
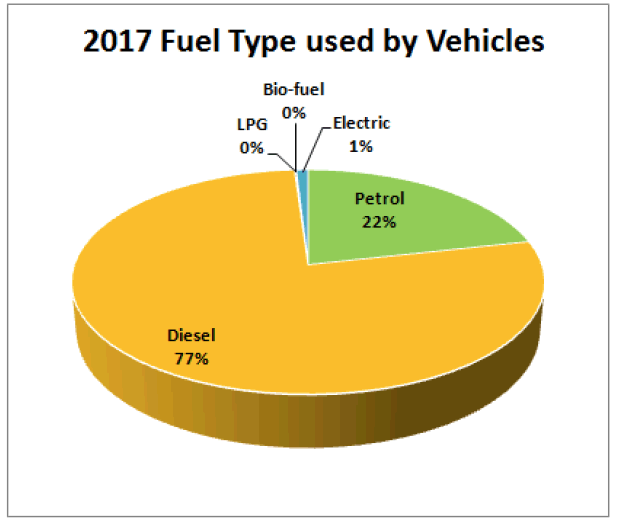
Electric accounts for 1%, and the other alternatives 0.14%
Contact
There is a problem
Thanks for your feedback