Adult social care labour supply: pay increase impact assessment
The University of Kent conducted analysis to estimate the impact, on recruitment and retention, of an increase in the minimum wage for adult social care workers from £10.90 to £12.00 per hour in Scotland.
Technical Appendix A3. The impact of a minimum wage increase in ASC on ASC employment in Scotland
We predicted labour supply effects from a change in wages based on estimated wage elasticities of labour supply to the sector. The wage elasticities of labour supply to the sector are based on wage elasticities of job separation obtained from the estimation of models of job separation overall and of separation/transition the other ASC jobs; see Equation (1). The full estimation results of the models of job separation/transition (under the form of marginal effects) are presented in Table A5 (for all care settings) and Table A6 (for residential care). The wage elasticities and predicted labour supply effects are summarised in Table A7 to A9. The labour supply effects are predicted under four different assumptions:
1. The wage responsiveness of ASC labour supply in Scotland is similar to that of ASC labour supply in England;
2. The wage responsiveness of ASC labour supply in Scotland is similar to that of ASC labour supply in residential care in England;
3. The wage responsiveness of ASC labour supply in Scotland is similar to that of ASC labour supply in residential care in England’s North and Midlands.
4. The wage responsiveness of ASC labour supply in Scotland is similar to that of ASC labour supply in the weighted sample of residential care staff in England’s North and Midlands resembling the sectoral split in Scotland.
The rationale behind these assumptions and the predicted employment effects are presented below.
Model 1: Wage responsiveness of ASC labour supply in Scotland assumed similar to that of ASC labour supply in England
In our baseline model we consider the wage responsiveness of ASC labour supply in Scotland is similar to that of ASC labour supply in England. Table A7 presents the wage elasticities of separation (overall and to jobs inside ASC based on the estimations in Table A5, column 1 and 2 respectively), the share of recruitment from inside ASC, and the wage elasticities of labour supply to the ASC sector for England, for deciles of the wage distribution in the ASC sector in Scotland.
For simplicity, we assumed that the hourly wages paid are at the increments given by the deciles of the wage distribution. For a wage floor increase of k wage increments, the predicted increases in in labour supply ( ) equals the weighted sum of the percentual increase in wage from increment n to the next (
 ) times the average wage elasticity of labour supply between wage increments n and n+1 (
 ). The weights being the cumulated share of workers paid at wage increment n or below, which are either:
A)  , if we consider that the workers with wages between to increments are paid at the lower increment, and giving a predicted increases in in labour supply of:

(4)
B)  , if we consider that the workers with wages between to increments are paid at the lower increment, and giving a predicted increases in in labour supply of:

(5)
The two predicted values giving an upper ( ) and lower (
 ) bound.
Our model shows that an increase in the minimum wage floor in ASC in Scotland from £10.90 to £12.00 in 2024/25 (i.e., a 10.1% nominal increase or a 6.1% real wage increase if we take into account the Bank of England predicted 3.75% year-on-year inflation rate in Q2 2024), would lead to an ASC employment increase of between 4.3% and 6.2%; an increase of the wage floor to £12.50 (i.e., 14.7% nominal or a 10.5% real wage increase) would lead to an ASC employment increase of between 8.6% and 11.7%, while an increase of the wage floor to £13.00 (i.e., 19.3% nominal or a 15.0% real wage increase) would lead to an ASC employment increase of between 13.3% and 17.6%.
Model 2: Wage responsiveness of ASC labour supply in Scotland assumed similar to that of ASC labour supply in England, excluding home care
As showed in Vadean et al. (2024), the ASC-WDS data may include some measurement issues with respect to individual hourly wages in home care, with some home care employers paying higher wages (but only for client contact time), while others paying lower wages (but for travel time as well). This may lead to biased results of wage elasticities for home care workers. We, therefore, suggested to consider the wage elasticities of labour supply estimated for staff employed in settings excluding home care as applying for the whole sector.
Wage elasticities of labour supply from Table A8 (based on estimates with the sample excluding home care; see Table A5, column 3 and 4) are rather similar to those for all care settings, but leading to slightly smaller predictions of labour supply increases. An increases in the minimum wage floor to £12.00 in 2024/25 (i.e., 10.1% nominal or a 6.1% real wage increase), would lead to an ASC employment increase of between 4.0% and 5.9%; an increase of the wage floor to £12.50 (i.e., 14.7% nominal or a 10.5% real wage increase) would lead to an ASC employment increase of between 8.2% and 11.2%, while an increase of the wage floor to £13.00 (i.e., 19.3% nominal or a 15.0% real wage increase) would lead to an ASC employment increase of between 12.8% and 17.0%.
Model 3: Wage responsiveness of ASC labour supply in Scotland assumed similar to that of ASC labour supply in England’s North and Midlands, excluding home care
The labour market in Scotland differs from that in England. For example, the average job density (i.e., the number of jobs divided by the resident population aged 16-64) is higher (0.86) and the economic inactivity rate lower (21.2%) in England as compared to Scotland (0.81 and 23.5% respectively); see Figure 4. This would mean that the job opportunities outside ASC faced by care staff in Scotland would be different to those faced by care staff in England, and their responsiveness to wages would be also different. We, therefore, experimented with combinations of English regions that would have similar labour market conditions in terms of job density and economic inactivity with Scotland. The closest identified was North and Midlands (i.e., North East, North West, Yorkshire and The Humber, East Midlands, and West Midlands), which has a job density of 0.81 and economic inactivity rate of 23.0%.
Wage elasticity estimates for predicting the wage responsiveness of a change in the minimum wage floor for the ASC sector in Scotland are, therefore, based on an ASC-WDS sample including only care staff in England’s North and Midlands regions and excluding home care; see Table A9 and Table A6 (column 1 and 2). These are lower than for England overall (excluding home care) and leading to a lower predicted labour supply increase: an increases in the minimum wage floor to £12.00 in 2024/25 (i.e., 10.1% nominal or a 6.1% real wage increase) is predicted to lead to an ASC employment increase of between 3.1% and 4.5%; an increase of the wage floor to £12.50 (i.e., 14.7% nominal or a 10.5% real wage increase) would lead to an ASC employment increase of between 6.2% and 8.5%, while an increase of the wage floor to £13.00 (i.e., 19.3% nominal or a 15.0% real wage increase) would lead to an ASC employment increase of between 9.7% and 12.8%.
Model 4: Wage responsiveness of ASC labour supply in Scotland assumed similar to that of ASC labour supply in England’s North and Midlands, excluding home care; sample reweighted to resemble the ASC sectoral split in Scotland
This model builds on Model 3 by performing wage elasticity estimations on a weighted version of the sample of residential care staff located in England’s North and Midlands regions. A weight for each observation was computed by entropy balancing such that the respective aggregate shares of care staff employed by public, private, and voluntary care providers in the weighted sample are close to the corresponding values for Scotland; see Figure 5. In practice that meant giving higher weights to care staff employed by public and voluntary care providers and lower weights to care staff employed by private care providers.
Public and voluntary care providers are known to pay higher hourly wages, employ a lower share of staff on contracts with no guaranteed working hours, and offer better benefits (e.g., sick pay and pension), and consequently have also better staff retention rates (Skills for Care, 2023; Vadean and Allan, 2023; Vadean and Saloniki, 2023). We would, therefore, expected labour supply to be relatively less responsive to wages in the public and voluntary sectors compared to the private sector, and the wage elasticities of labour supply obtained from the weighted estimations to be comparatively lower.
Our results of the weighted regressions led indeed to lower wage elasticities of labour supply and a lower predicted labour supply effect of the minimum wage increase: the minimum wage floor increase to £12.00 in 2024/25 (i.e., 10.1% nominal or a 6.1% real wage increase) is predicted to lead to an ASC employment increase of between 2.7% and 4.0%; an increase of the wage floor to £12.50 (i.e., 14.7% nominal or a 10.5% real wage increase) would lead to an ASC employment increase of between 5.4% and 7.5%, while an increase of the wage floor to £13.00 (i.e., 19.3% nominal or a 15.0% real wage increase) would lead to an ASC employment increase of between 8.4% and 11.2%.
| All care settings | ||
|---|---|---|
| Observations (spell-years) | 903,690 | |
| Job spells | 431,336 | |
| Care staff | 395,281 | |
| Establishments | 13,291 | |
| Job spells ending in separation | 133,148 | 30.9% |
| Job spells ending in identified transitions to other ASC job | 39,896 | 9.2% |
| Share of recruits from other ASC employers | 61.9% | |
| Excluding home care | ||
| Observations (spell-years) | 570,407 | |
| Job spells | 268,294 | |
| Care staff | 249,850 | |
| Establishments | 9,260 | |
| Job spells ending in separation | 79,517 | 29.6% |
| Job spells ending in identified transitions to other ASC job | 24,374 | 9.1% |
| Share of recruits from other ASC employers | 63.2% | |
| Job spells by care setting | ||
| Adult residential care | 224,190 | 52.0% |
| Adult home care | 163,042 | 37.8% |
| Other adult community care (excl. home care) | 44,104 | 10.2% |
| Job spells by sector | ||
| Statutory LA | 61,490 | 14.3% |
| Private | 308,920 | 71.6% |
| Voluntary | 60,926 | 14,1% |
Data source: Adult Social Care Workforce Data Set (ASC-WDS); pooled Oct 2016 to Oct 2021.
| Percentile | 10 | 20 | 30 | 40 | 50 | 60 | 70 | 80 | 90 |
|---|---|---|---|---|---|---|---|---|---|
| Hourly pay distribution – ASC Scotland (excluding overtime) 2023 | |||||||||
| Residential care activities | 10.84 | 10.90 | 11.23 | 11.71 | 12.38 | 13.21 | 15.03 | 17.60 | x |
| Social work activities without accommodation | 10.71 | 10.96 | 11.30 | 11.71 | 12.83 | 14.04 | 15.43 | 17.58 | x |
| ASC overall | 10.76 | 10.94 | 11.27 | 11.71 | 12.64 | 13.70 | 15.27 | 17.59 | x |
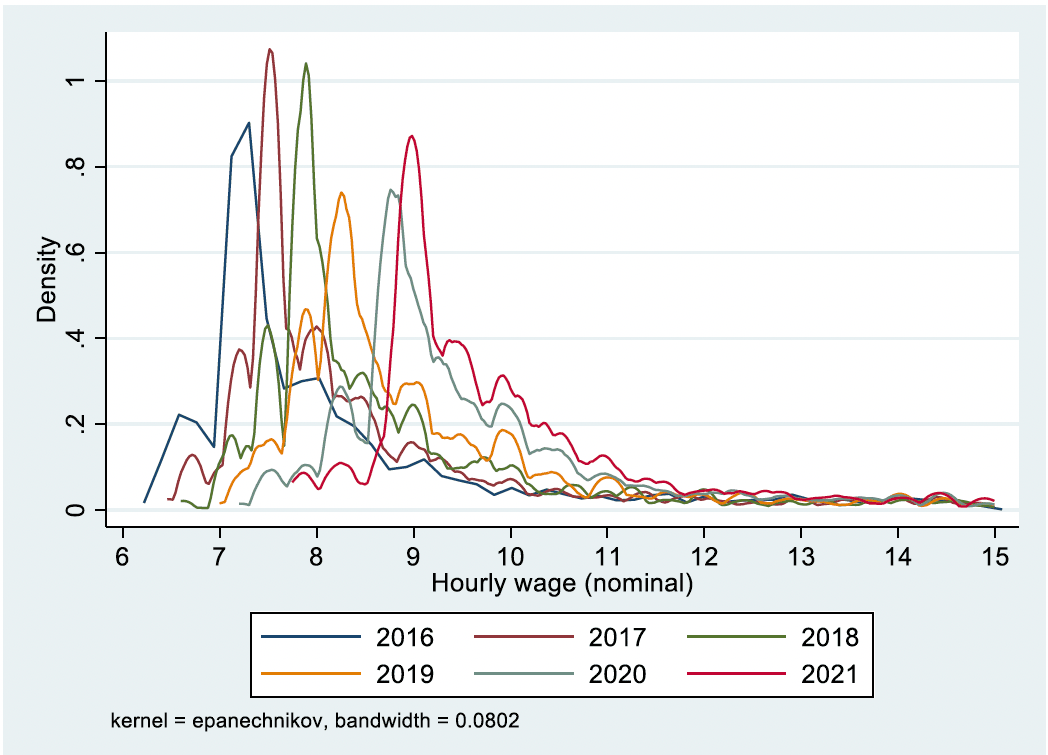
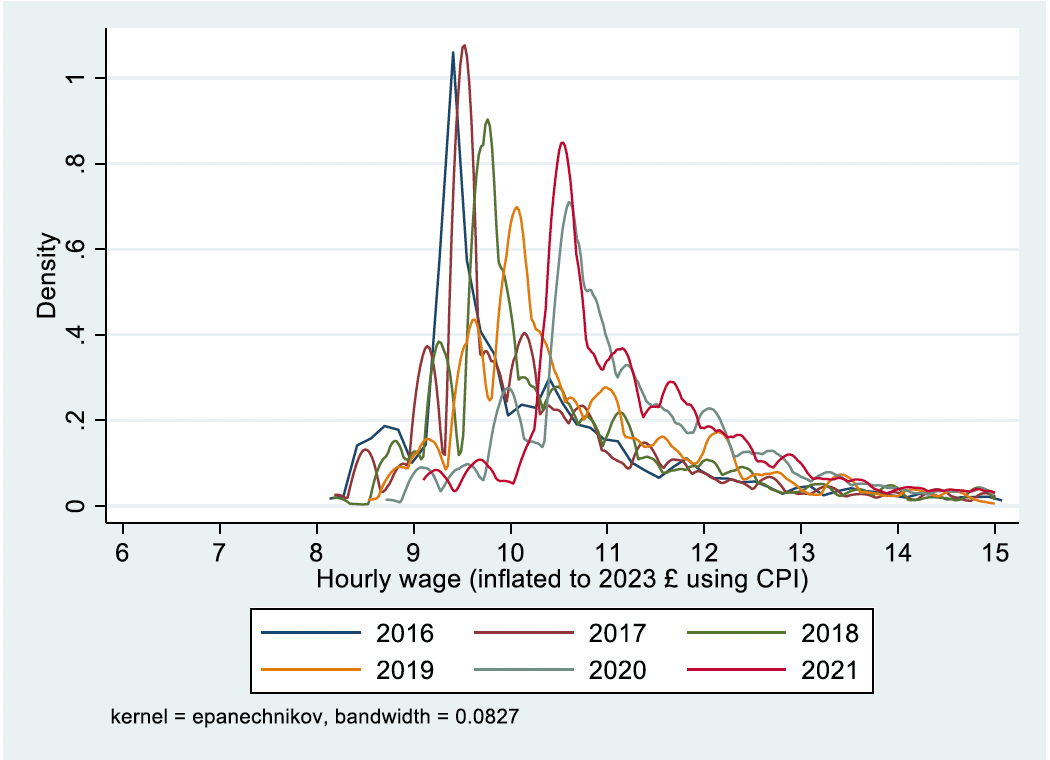
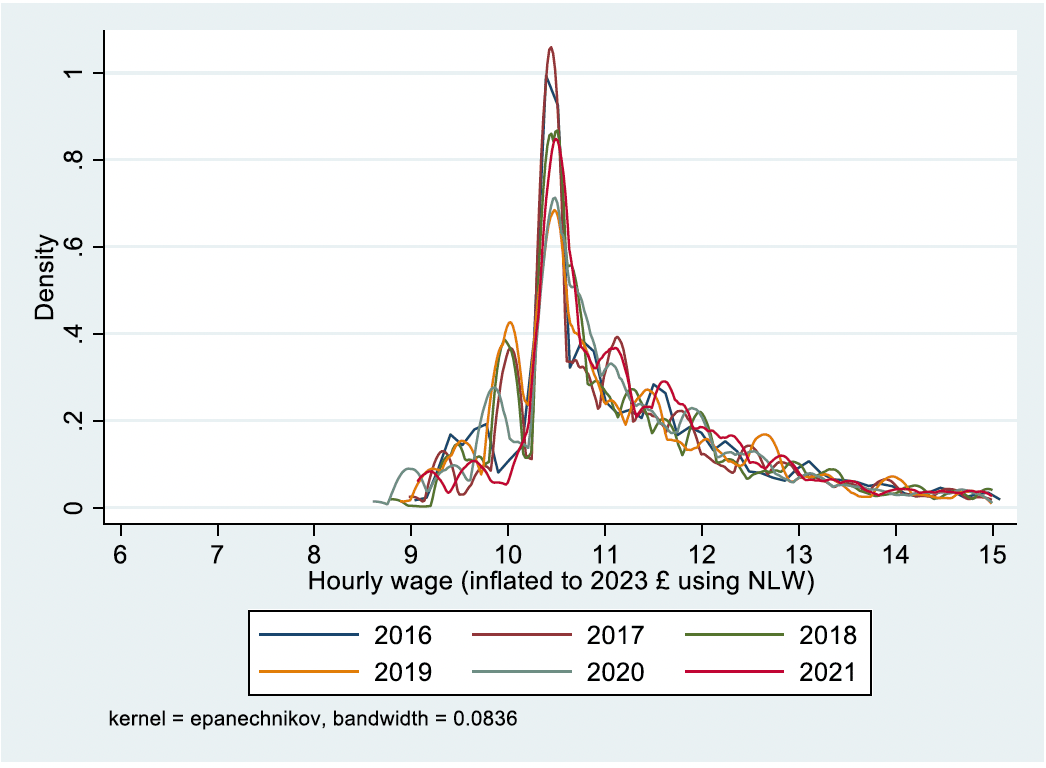
| Hourly pay distribution – ASC-WDS sample England | |||||||||
| ASC overall (inflated to 2023 using NLW) | 9.98 | 10.42 | 10.45 | 10.72 | 11.11 | 11.58 | 12.27 | 13.64 | |
| % difference to ASC Scotland | 7.8% | 4.9% | 7.9% | 9.2% | 13.8% | 18.3% | 24.4% | 28.9% | |
| ASC overall (inflated to 2023 using NLW + scaled to Scottish ASC min wage) | 10.44 | 10.90 | 10.93 | 11.22 | 11.62 | 12.11 | 12.83 | 14.27 | |
| % difference to ASC Scotland | 3.1% | 0.3% | 3.1% | 4.4% | 8.8% | 13.1% | 19.0% | 23.3% | |
Data source: Pay data for ASC Scotland are from the ONS: ASHE Table 5 Earnings and hours worked, UK region by industry by two-digit SIC (ons.gov.uk). The ASC-WDS sample for England includes yearly data for October 2016 to October 2021, as described in the Appendix Section A1.
Notes: Unshaded values are considered to be precise, with a coefficient of variation (CV) (i.e., ratio of the standard error to the estimate itself) <=5%. The light grey shaded values are considered reasonably precise (CV <5% and <=10%). Dark shaded values are considered unreliable for practical purposes and are supressed (CV >20%).
| Job density | Economic inactivity rate | Working age population (mil.) | |
|---|---|---|---|
| Scotland | 0.81 | 23.5 | 3.430 |
| England (overall) | 0.86 | 21.2 | 34.903 |
| North East | 0.75 | 25.6 | 1.624 |
| North West | 0.84 | 23.4 | 4.480 |
| Yorkshire and The Humber | 0.81 | 22.2 | 3.371 |
| East Midlands | 0.80 | 22.3 | 2.948 |
| West Midlands | 0.81 | 22.5 | 3.622 |
| East | 0.84 | 19.2 | 3.790 |
| London | 1.02 | 20.5 | 6.137 |
| South East | 0.85 | 19.0 | 5.591 |
| South West | 0.87 | 19.8 | 3.340 |
| England (North and Midlands) | 0.81 | 23.0 | 16.044 |
Data source: Office of National Statistics (ONS) and Annual Population Survey (APS).
Notes: North and Midlands includes: North East, North West, Yorkshire and The Humber, East Midlands, and West Midlands. The average job density and economic inactivity rate in North and Midlands was computed using the working age populations as weights.
| Headcount | Proportion of total headcount | ||||||
|---|---|---|---|---|---|---|---|
| Public | Private | Voluntary | Public | Private | Voluntary | ||
| Total overall | 36,210 | 62,300 | 43,640 | 0.255 | 0.438 | 0.307 | |
| Care homes for adults | 6,570 | 37,020 | 7,450 | 0.129 | 0.725 | 0.146 | |
| Total non-residential | 29,640 | 25,280 | 36,190 | 0.325 | 0.277 | 0.397 | |
| Housing support/care at home | 20,780 | 20,160 | 33,670 | ||||
| Adult day care | 2,910 | 320 | 2,290 | ||||
| Adult placement services | 150 | 0 | 90 | ||||
| Fieldwork service (adults) | 5,800 | 0 | 0 | ||||
| Nurse agencies | 0 | 4800 | 140 | ||||
Data source: Scottish Social Services Council (2023).
| Variables | (1) | (2) | (3) | (4) |
|---|---|---|---|---|
| All care settings | Excl. home care | |||
| Job separations overall | Job separations to ASC | Job separations overall | Job separations to ASC | |
| Job tenure: >1 & <=2 years | -0.099*** | -0.063*** | -0.089*** | -0.063*** |
| (0.002) | (0.002) | (0.002) | (0.002) | |
| Job tenure: >2 & <=4 years | -0.239*** | -0.138*** | -0.228*** | -0.139*** |
| (0.001) | (0.002) | (0.002) | (0.002) | |
| Job tenure: >4 & <=8 years | -0.352*** | -0.184*** | -0.339*** | -0.186*** |
| (0.001) | (0.002) | (0.002) | (0.002) | |
| Job tenure: >8 years | -0.395*** | -0.198*** | -0.381*** | -0.201*** |
| (0.001) | (0.002) | (0.002) | (0.002) | |
| Age | 0.000 | 0.003*** | 0.001*** | 0.004*** |
| (0.000) | (0.000) | (0.000) | (0.000) | |
| Age squared (x 1,000) | -0.035*** | -0.054*** | -0.042*** | -0.055*** |
| (0.003) | (0.003) | (0.004) | (0.003) | |
| Female | -0.009*** | 0.001 | -0.012*** | 0.000 |
| (0.001) | (0.001) | (0.001) | (0.001) | |
| Nationality: British | -0.042*** | -0.015*** | -0.058*** | -0.027*** |
| (0.009) | (0.006) | (0.012) | (0.007) | |
| Qualification: yes | 0.015*** | -0.001 | 0.007 | -0.005 |
| (0.004) | (0.003) | (0.005) | (0.003) | |
| Training (any): yes | 0.041*** | 0.023*** | 0.038*** | 0.030*** |
| (0.003) | (0.002) | (0.004) | (0.003) | |
| Job group: manager/supervisor | -0.033*** | -0.010*** | -0.052*** | -0.019*** |
| (0.005) | (0.003) | (0.006) | (0.004) | |
| Job group: professional | 0.004 | 0.018*** | -0.002 | 0.011 |
| (0.010) | (0.007) | (0.010) | (0.007) | |
| Job group: other | -0.004 | -0.008** | -0.011** | -0.012*** |
| (0.005) | (0.003) | (0.006) | (0.004) | |
| Hourly wage (2023 £) | -0.023*** | -0.009*** | -0.019*** | -0.006*** |
| (0.001) | (0.001) | (0.001) | (0.001) | |
| Zero-hours contract | 0.035*** | 0.004 | 0.074*** | 0.015** |
| (0.006) | (0.004) | (0.009) | (0.006) | |
| Sector: Private | 0.035*** | -0.033*** | 0.038*** | -0.026*** |
| (0.002) | (0.002) | (0.003) | (0.002) | |
| Sector: Voluntary | -0.005** | -0.045*** | -0.002 | -0.040*** |
| (0.002) | (0.002) | (0.003) | (0.002) | |
| Care setting: adult home care | 0.011*** | 0.016*** | ||
| (0.001) | (0.001) | |||
| Care setting: adult community (excl. home care) | 0.033*** | 0.032*** | 0.039*** | 0.035*** |
| (0.002) | (0.002) | (0.003) | (0.002) | |
| User type: young adults | -0.039*** | -0.003 | -0.057*** | -0.033*** |
| (0.009) | (0.006) | (0.011) | (0.006) | |
| User type: mixed | -0.071*** | -0.040*** | -0.081*** | -0.048*** |
| (0.006) | (0.003) | (0.006) | (0.003) | |
| Staff size: medium/large (50+ workers) | 0.008*** | -0.003 | 0.019*** | 0.005** |
| (0.003) | (0.002) | (0.004) | (0.002) | |
| Turnover rate (previous 12 months) | 0.018*** | 0.009*** | 0.028*** | 0.014*** |
| (0.002) | (0.002) | (0.003) | (0.002) | |
| Vacancy rate | 0.010 | -0.040*** | -0.009 | -0.041*** |
| (0.011) | (0.007) | (0.014) | (0.010) | |
| Unemployment rate (LAD level) | -0.001 | 0.001* | -0.001 | -0.003*** |
| (0.001) | (0.001) | (0.001) | (0.001) | |
| Mean wage 1st quartile (LAD level; log; 2023 £) | 0.002 | 0.031*** | -0.061*** | -0.013 |
| (0.016) | (0.010) | (0.019) | (0.013) | |
| House price (LAD level; log; 2022 £) | 0.053*** | 0.010 | -0.013 | -0.010 |
| (0.017) | (0.011) | (0.022) | (0.015) | |
| Urban | -0.001 | 0.001 | 0.004** | 0.006*** |
| (0.002) | (0.001) | (0.002) | (0.002) | |
| ASC Unit Costs Residential Care (LA level; log; £/week) | -0.033*** | -0.031*** | -0.039*** | -0.063*** |
| (0.008) | (0.005) | (0.010) | (0.006) | |
| ASC Unit Costs Domiciliary Care (LA level; log; £/hour) | -0.010 | 0.022*** | 0.029*** | 0.051*** |
| (0.009) | (0.005) | (0.011) | (0.007) | |
| Care home competition (distance-weighted HHI) | 0.572 | 0.075 | 3.370*** | 3.196*** |
| (0.463) | (0.279) | (0.720) | (0.459) | |
| Home care competition (count of agencies at LAD level; log) | -0.007 | -0.006* | -0.002 | 0.009* |
| (0.005) | (0.003) | (0.007) | (0.004) | |
| Year fixed effects | yes | yes | yes | yes |
| Region fixed effects | yes | yes | yes | yes |
| Observations | 903,690 | 734,051 | 570,407 | 467,641 |
| Log likelihood/pseudo-likelihood | -405,405 | -176,741 | -250,934 | -111,209 |
| F-test of ; Hausman test | 140,000*** | 58,742*** | 87,267*** | 35,893*** |
| Robust standard errors in parentheses | ||||
| Significance level: *** p<0.01, ** p<0.05, * p<0.1 | ||||
Base categories: Nationality: Other; Qualification: no qualification; Training: no training received; Job group: direct care; Sector: statutory LA; Care setting: adult residential care; User type: old age; Staff size: micro/small (1-49 workers). CRE probit: correlated random effects probit estimation. LAD: local authority district.
| Variables | (1) | (2) | (3) | (4) |
|---|---|---|---|---|
| North & Midlands | North & Midlands (weighted) | |||
| Job separations overall | Job separations to ASC | Job separations overall | Job separations to ASC | |
| Job tenure: >1 & <=2 years | -0.096*** | -0.072*** | -0.093*** | -0.073*** |
| (0.003) | (0.003) | (0.003) | (0.004) | |
| Job tenure: >2 & <=4 years | -0.233*** | -0.146*** | -0.224*** | -0.147*** |
| (0.003) | (0.003) | (0.003) | (0.004) | |
| Job tenure: >4 & <=8 years | -0.345*** | -0.193*** | -0.332*** | -0.192*** |
| (0.003) | (0.003) | (0.003) | (0.004) | |
| Job tenure: >8 years | -0.386*** | -0.206*** | -0.365*** | -0.203*** |
| (0.003) | (0.003) | (0.003) | (0.004) | |
| Age | 0.001* | 0.003*** | 0.000 | 0.004*** |
| (0.000) | (0.000) | (0.001) | (0.000) | |
| Age squared (x 1,000) | -0.041*** | -0.054*** | -0.035*** | -0.057*** |
| (0.006) | (0.004) | (0.006) | (0.005) | |
| Female | -0.015*** | -0.002 | -0.012*** | -0.002 |
| (0.002) | (0.001) | (0.002) | (0.002) | |
| Nationality: British | -0.115*** | -0.053*** | -0.116*** | -0.047*** |
| (0.015) | (0.009) | (0.015) | (0.010) | |
| Qualification: yes | 0.005 | -0.005 | 0.002 | -0.005 |
| (0.007) | (0.004) | (0.007) | (0.005) | |
| Training (any): yes | 0.041*** | 0.035*** | 0.036*** | 0.035*** |
| (0.006) | (0.004) | (0.006) | (0.004) | |
| Job group: manager/supervisor | -0.050*** | -0.016*** | -0.056*** | -0.022*** |
| (0.008) | (0.005) | (0.008) | (0.005) | |
| Job group: professional | -0.015 | 0.012 | -0.015 | 0.004 |
| (0.014) | (0.010) | (0.014) | (0.010) | |
| Job group: other | -0.019** | -0.019*** | -0.023*** | -0.024*** |
| (0.008) | (0.005) | (0.009) | (0.005) | |
| Hourly wage (2023 £) | -0.028*** | -0.013*** | -0.020*** | -0.009*** |
| (0.002) | (0.001) | (0.002) | (0.001) | |
| Zero-hours contract | 0.025** | -0.010 | 0.037*** | -0.007 |
| (0.011) | (0.008) | (0.013) | (0.009) | |
| Sector: Private | 0.048*** | -0.023*** | 0.046*** | -0.023*** |
| (0.003) | (0.003) | (0.004) | (0.003) | |
| Sector: Voluntary | -0.015*** | -0.053*** | -0.017*** | -0.055*** |
| (0.004) | (0.003) | (0.004) | (0.003) | |
| Care setting: adult community (excl. home care) | 0.047*** | 0.038*** | 0.051*** | 0.037*** |
| (0.003) | (0.003) | (0.004) | (0.003) | |
| User type: young adults | -0.042*** | -0.026*** | -0.074*** | -0.046*** |
| (0.015) | (0.009) | (0.017) | (0.012) | |
| User type: mixed | -0.081*** | -0.047*** | -0.113*** | -0.057*** |
| (0.007) | (0.004) | (0.007) | (0.005) | |
| Staff size: medium/large (50+ workers) | 0.036*** | 0.017*** | 0.023*** | 0.015*** |
| (0.005) | (0.003) | (0.005) | (0.004) | |
| Turnover rate (previous 12 months) | 0.019*** | 0.008** | 0.021*** | 0.006 |
| (0.005) | (0.003) | (0.005) | (0.004) | |
| Vacancy rate | 0.049** | -0.069*** | 0.042* | -0.030* |
| (0.021) | (0.015) | (0.022) | (0.017) | |
| Unemployment rate (LAD level) | -0.004** | -0.005*** | -0.009*** | -0.006*** |
| (0.002) | (0.001) | (0.002) | (0.001) | |
| Mean wage 1st quartile (LAD level; log; 2023 £) | 0.112*** | 0.148*** | 0.175*** | 0.172*** |
| (0.031) | (0.020) | (0.034) | (0.023) | |
| House price (LAD level; log; 2022 £) | 0.004 | -0.039* | 0.037 | -0.019 |
| (0.031) | (0.021) | (0.034) | (0.023) | |
| Urban | 0.012*** | 0.017*** | 0.015*** | 0.017*** |
| (0.003) | (0.002) | (0.003) | (0.003) | |
| ASC Unit Costs Residential Care (LA level; log; £/week) | -0.074*** | -0.096*** | -0.054*** | -0.093*** |
| (0.013) | (0.009) | (0.015) | (0.010) | |
| ASC Unit Costs Domiciliary Care (LA level; log; £/hour) | 0.007 | 0.014* | 0.020 | 0.013 |
| (0.012) | (0.008) | (0.014) | (0.009) | |
| Care home competition (distance-weighted HHI) | 4.307*** | 2.984*** | 2.884*** | 1.656*** |
| (0.840) | (0.526) | (0.934) | (0.599) | |
| Home care competition (count of agencies at LAD level; log) | -0.022** | -0.022*** | -0.063*** | -0.036*** |
| (0.009) | (0.006) | (0.010) | (0.007) | |
| Year fixed effects | yes | yes | yes | yes |
| Region fixed effects | yes | yes | yes | yes |
| Observations | 308,273 | 256,712 | 308,273 | 256,712 |
| Log likelihood/pseudo-likelihood | -131,597 | -59,512 | -127,821 | -59,533 |
| F-test of ; Hausman test | 46,757*** | 19,935*** | 33,883*** | 15,789*** |
| Robust standard errors in parentheses | ||||
| Significance level: *** p<0.01, ** p<0.05, * p<0.1 | ||||
Base categories: Nationality: Other; Qualification: no qualification; Training: no training received; Job group: direct care; Sector: statutory LA; Care setting: adult residential care; User type: old age; Staff size: micro/small (1-49 workers). CRE probit: correlated random effects probit estimation. LAD: local authority district.
Contact
Email: lucy.proud@gov.scot
There is a problem
Thanks for your feedback