Adult social care labour supply: pay increase impact assessment
The University of Kent conducted analysis to estimate the impact, on recruitment and retention, of an increase in the minimum wage for adult social care workers from £10.90 to £12.00 per hour in Scotland.
3. Estimating the employment effect of increasing the minimum wage for ASC staff
3.1 Data
In the absence of individual level data on social care staff for Scotland, we analysed the relationship between wages and employment using a large dataset for England; see Technical Appendix A1. The Adult Social Care Workforce Data Set (ASC-WDS) is the main source of social care workforce intelligence in England, covering over 50% of the English ASC market, and containing rich information at both establishment level (e.g., type of service provided, sector, establishment size, count of employees and job roles, starters, leavers and vacancies, etc.) and staff level (e.g., age, gender, nationality, qualifications, training, hourly pay, job role, contract type, etc.); see Skills for Care (2023).
For our baseline model, we used the full sample of care staff aged 16 to 59 (i.e., employees close to state retirement age excluded) in ASC-WDS for the years 2016 to 2021, being employed by either a public (i.e., statutory local authority), private (i.e., for-profit) or voluntary (i.e., not-for-profit) sector care provider. The sample consisted of 335,330 care staff employed in 9,483 care establishments; see Technical Appendix, Table A1.
As shown in Vadean et al. (2024), the ASC-WDS data may include some measurement issues with respect to individual hourly wages in domiciliary care. Specifically, some domiciliary care employers reporting higher hourly wages may pay these only for client contact time, while others pay lower wages but compensate for travel time. These differences in reporting may lead to poor identification of pay differences between domiciliary care providers and potentially lead to biased results on relationship between wages and employment. We, therefore, proposed an alternative analysis on a sample restricted to residential care staff, including 206,138 workers in 6,509 care homes with or without nursing; see Technical Appendix, Table A2. This analysis implicitly assumes that, everything else equal, the relationship between wages and employment is similar for residential and non-residential employees.
3.1.1 Differences between the ASC labour markets in Scotland and England
Analysis using the full baseline ASC-WDS sample described above assumes that the ASC labour market in Scotland is similar to England. In reality, though, there are substantial differences between the two. Looking first at the wider labour market and economic environment, Figure 4 reports job density (i.e., the number of jobs divided by the resident population aged 16-64) and economic inactivity rates (i.e., the percentage of working age people not in employment who have not been seeking work within the last 4 weeks and/or are unable to start work within the next 2 weeks) for Scotland, England, and England’s North and Midlands regions. A cross-country comparison indicates higher aggregate jobs density (0.86) and lower economic inactivity rates (21.2%) in England compared to Scotland (0.81 and 23.5% respectively). This would mean that not only do care staff in Scotland have fewer job opportunities outside ASC, but also that people of working age are more likely to stay outside the labour market if they do not find suitable jobs. Therefore, the responsiveness to wages of ASC care staff in Scotland is likely to be different than in England.
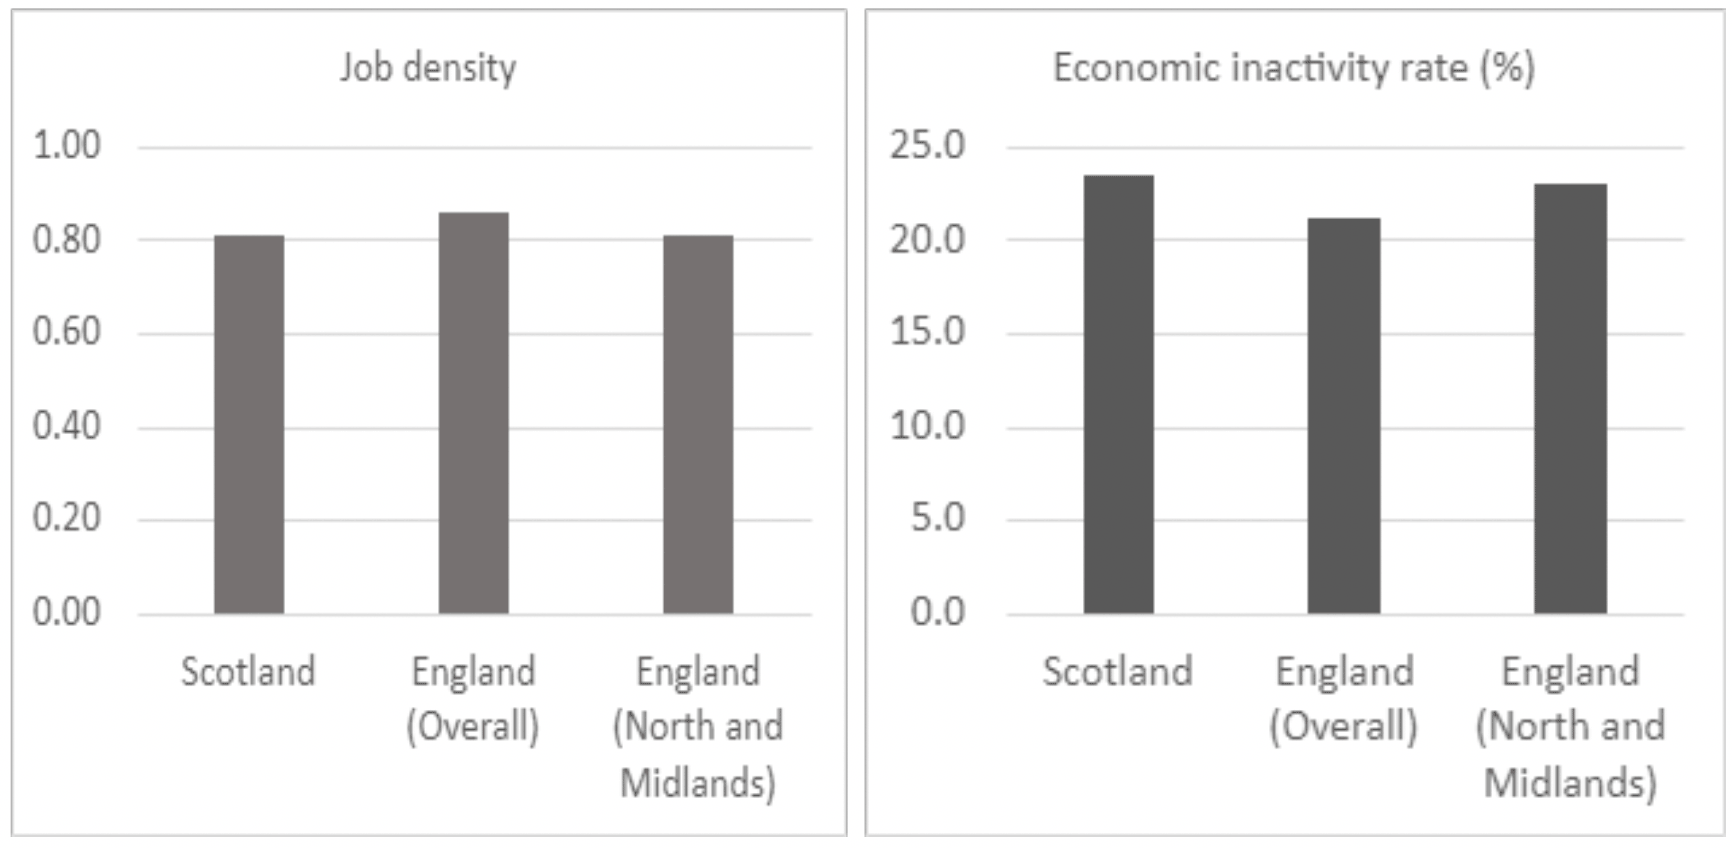
Data source: Office for National Statistics (ONS), Annual Population Survey 2021.
To improve the similarity in wage responsiveness between Scotland and the analysis sample (i.e. to make the source data more representative of Scotland), we therefore looked to refine the analysis using data for selected regions of England. Disaggregated statistics for English regions (see Technical Appendix, Table A3) suggest that part of the difference in economic conditions between Scotland and England stems from the North-South divide within England. Specifically, regions in the South have noticeably higher jobs density and economic activity rates. By experimenting with combinations of English regions that would have labour market indicators more closely resembling Scotland, we identified that the closest were England’s North and Midlands (i.e., North East, North West, Yorkshire and The Humber, East Midlands, and West Midlands), with an aggregate job density of 0.81 and economic inactivity rate of 23.0%.
Data source: Skills for Care (2023) and Scottish Social Services Council (2023).
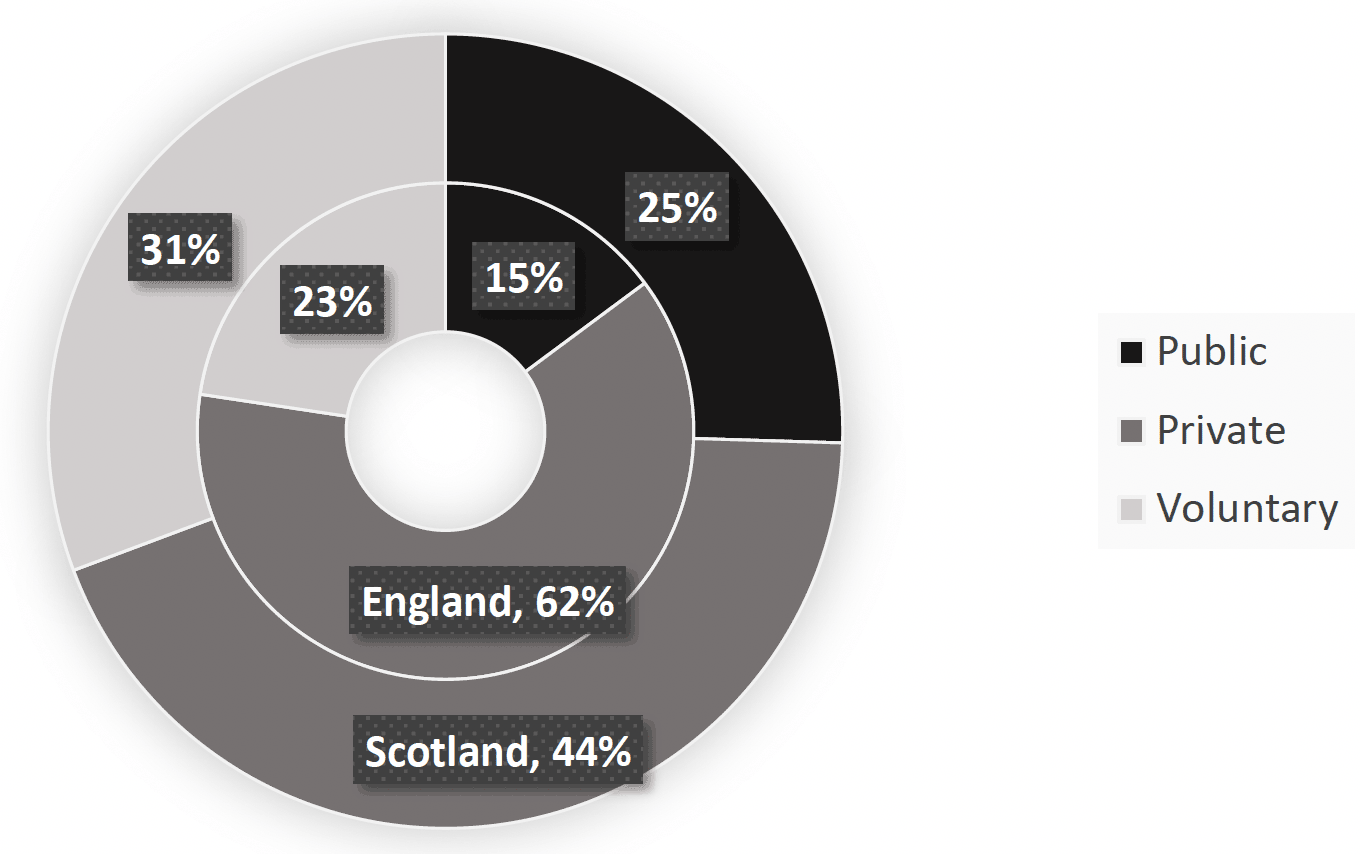
A further important difference between the ASC sectors in Scotland and England is the sectoral split, with relatively more care staff being employed in Scotland by public and voluntary (i.e., not-for-profit) care providers. In particular public providers are known to offer better pay and contractual conditions (e.g., sick leave and pensions) and consequently experience higher staff retention rates (Scottish Social Services Council, 2023; Skills for Care, 2023). Figure 5 plots the breakdown of employment by sector in 2022, showing that public sector care providers accounted for roughly 25% of care staff in Scotland (compared to only 15% in England), while voluntary care providers employed about 31% of care staff (compared to only 23% in England). In contrast, the majority of care staff in England (62%) were employed in the private sector. The differences in the ASC markets between the two countries comes mainly from a relatively smaller share of private non-residential market in Scotland: only about 28% of non-residential care staff was employed by private care providers in 2022, while 32% were employed by public and 40% by voluntary care providers; see Technical Appendix, Table A4.[4]
3.1.2 Distribution of social care wages in Scotland
To obtain predicted effects for ASC employment in Scotland, we used Scottish social care wage decile data from the 2023 ONS Annual Survey of Hours and Earnings (ASHE).[5] Comparing the wage distribution in Scotland to that in our analysed sample (i.e., inflated to 2023 levels), we note that Scottish social care wages are persistently higher along the entire distribution (see Technical Appendix, Table A2). This difference comes from an about 5% higher minimum wage in the Scottish ASC sector (£10.90) compared to the NLW level that applies for ASC workforce in England. Furthermore, the higher share of Scottish care workforce employed by public and voluntary sector providers (see Figure 5), known to pay higher wages, could also contribute to this gap.
Under the assumption that employees assess relative wage differences (i.e., compare pay at other ASC employers or outside the sector against their current pay) when deciding whether or not to leave or take up a position, it is important that we address the gap between the analysis sample and Scottish wage distributions. This is because the policy we are analysing is an increase of the wage floor to a specific nominal value (i.e., £12.00). In this situation, not adjusting for the systematic gap in wages between the Scottish wage distribution and the analysis sample would lead us to infer the behavioural responses (to a wage increase) of the lowest-paid Scottish ASC workers based on the behaviour of English ASC workers who are higher up in the English ASC wage distribution, and potentially more skilled and experienced.
To reduce the gap between the Scottish social care wage distribution and that of our analysis sample, we applied a scaling factor equal to the percentage difference between the Scottish ASC minimum wage (i.e., £10.90) and the NLW (i.e., £10.42), uniformly across our analysis sample. This preserves the underlying shape of the distribution (i.e., relative distances and prevalence between wages) but brings wages at the lower part of the two wage distributions closer together. This gives us some confidence with respect to estimation results for a minimum wage floor increase, which are likely to affect only care staff with wages below the median wage. The higher part of the wage distribution in our sample (i.e., higher than median) diverges more substantially from the wage distribution in Scotland. This is likely due to higher wages paid by public and voluntary employers and the higher share of care staff employed by public and voluntary care providers in Scotland.
3.2 Responsiveness of labour supply to a change in wages
The key metric that is conventionally used to assess the effect of a change in wages on employment is the wage elasticity of labour supply. It is defined as the percentage change in labour supply resulting from a 1% change in wages, and captures how employment at an establishment, or in a sector, responds to changes in wages.
We estimated the wage elasticity of labour supply in the Scottish ASC sector following the two-step procedure developed in Vadean et al. (2024). First, we modelled the relationship between hourly pay and the probability of job separation (i.e., how likely are currently employed ASC staff to leave their employer during the next 12 months). Using this model, we estimated the wage elasticity of job separations (i.e., the change in separation probability associated with a percentage change in wages). The resulting elasticity estimate accounts for non-wage drivers of job separation and removes them from the effect of wage changes; see Technical Appendix Table A5 and Table A6.
Employment changes in each establishment result from the net effects of job separations and new hires. As it is not possible to directly estimate the responsiveness of hiring to wage changes (i.e., the wage elasticity of hiring) from available data (i.e., the pool of potential hires is not known, particularly because there are no specific qualification requirements for care workers), in the second step of the procedure we determine the wage elasticity of labour supply by inferring the wage responsiveness of hiring from the wage responsiveness of separation; see Technical Appendix, Section A2. This widely-used approach in the labour economics literature is based on the view that in a steady-state equilibrium (i.e., when aggregate employment growth is negligible) hiring and separation reflect churn and are, in aggregate, balanced (Lazear and McCue, 2017; Manning, 2003). The assumption about negligible aggregate employment growth is broadly in line with real-world observations. For example, headcount in ASC in Scotland increased only by 3% (from 138,120 to 142,160) between 2016 and 2022, which averages to less than 0.5% per year (Scottish Social Services Council, 2023). This simplifying assumption allows us to estimate the wage elasticity of labour supply from elasticities of job separation.
To allow for the responsiveness of employment to wage changes to differ at different wage levels, we estimated wage elasticities at deciles of the aggregate ASC wage distribution.
3.3 The employment effect of an increase in ASC minimum wage
The estimates of the wage elasticity of labour supply are used to predict the effect of an increase in the ASC wage floor on employment. Implicitly, the predictions abstract from indirect effects of the policy on wages above the new wage floor and assume that wages and employment at these higher wage levels remain unchanged.
To predict the total employment effect of raising the wage floor, we first computed the predicted change in employment at points in the Scottish social care wage distribution (i.e., wage deciles). Because only wage decile information is available, we assumed that the hourly wages paid are at the increments given by the deciles of the wage distribution. Because the 10th percentile wage is slightly under the ASC minimum wage of £10.90, we assume all workers in the lowest wage decile are paid the 10th percentile wage. For the remainder of workers, some assumptions on the distribution of wages between the reported wage deciles are necessary. For simplicity and transparency, we consider two contrasting assumptions: A) that the workers with wages between two increments are paid at the lower increment, and B) that the workers with wages between two increments are paid at the higher increment. Because Assumption (A) results in the wage floor increase affecting a larger portion of workers, while Assumption (B) results in the wage floor increase affecting a smaller portion of workers, they give an upper (A) and lower bound (B) for our predicted labour supply change.
The predicted changes in employment for wage increases between deciles of the wage distribution were then summed together to obtain the total predicted effect. For example, if we assume that the new minimum wage floor is between the 30th and 40th percentile of the wage distribution, the predicted employment effect is the sum of:
i. the employment effect from increasing the wage floor from the 10th percentile (our assumed minimum) to the 20th percentile of the wage distribution – this equals the average wage elasticity of labour supply for the 10th and 20th percentiles multiplied by the percentage difference between 10th and 20th percentile wages multiplied by the share of care staff that were paid below the 20th percentile (this is 20% under Assumption A or 10% under Assumption B above);
ii. the employment effect from further increasing the wage floor wage from the 20th to the 30th percentile of the wage distribution – this equals the average wage elasticity of labour supply for the 20th and 30th percentiles multiplied by the percentage difference between 20th and 30th percentile wages multiplied by the share of care staff that were paid below the 30th percentile (this is 30% under Assumption A or 20% under Assumption B above); and
iii. the employment effect from further increasing the wage floor wage from the 30th percentile of the wage distribution to the new wage floor – this equals the average wage elasticity of labour supply for the 30th percentile and that at the new wage floor multiplied by the percentage difference between 30th percentile wage and the new wage floor multiplied by the share of care staff that were paid below the new wage floor (this is 40% under Assumption A or 30% under Assumption B above).
For more details on and a mathematical expression of the calculation of the employment effect predictions see Technical Appendix, Section A3.
Contact
Email: lucy.proud@gov.scot
There is a problem
Thanks for your feedback