Attainment Scotland Fund evaluation: headteacher survey - topline briefing report 2020
This report presents and overview of headline findings from the 2020 survey of headteachers of schools in receipt of support from the Attainment Scotland Fund (ASF). This is the fifth survey of headteachers, previous surveys having been conducted in 2016, 2017, 2018 and 2019.
2. Key survey findings
2.1 This section provides an overview of survey findings across key survey themes. These include views on ASF and ASF-supported approaches, use of data and evidence, impact of ASF-supported approaches, and experience of the Pupil Equity Fund.
ASF and supported approaches
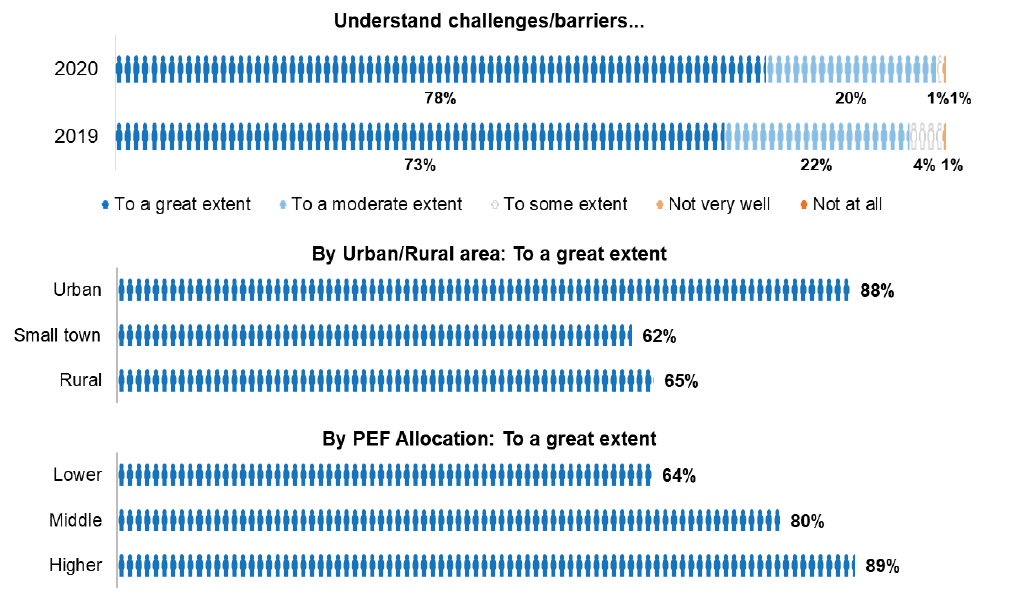
2.2 A great majority of headteachers felt they understood the challenges and barriers faced by pupils affected by poverty; 98%, including 78% who felt they understood this 'to a great extent'. This is similar to 2019 survey results, and was also consistent across ASF streams. However, those in small town and rural areas, and those with lower PEF allocations were less likely to feel that they understood these challenges.
Understanding of challenges/barriers faced by pupils affected by poverty in your school
2.3 A large majority of headteachers felt that the approach to achieving equity in education is embedded within their school community; 84% felt that their approach was embedded within their school community to a great or moderate extent. Only 3% felt their approach was not very well embedded.
2.4 These findings are very similar to 2019 survey results, and were broadly consistent across key respondent groups.
Whether approach to achieving equity is embedded within the school community

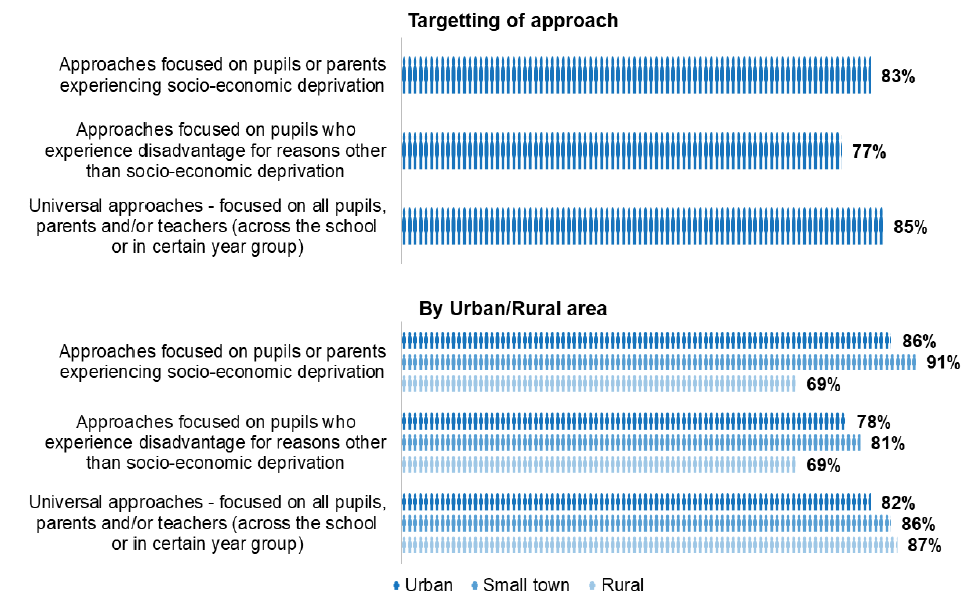
2.5 A large majority of schools have included a focus on the pupils or parents experiencing deprivation or disadvantage as part of their approach to achieving equity; 83% include a focus on those experiencing socio-economic deprivation and 77% include a focus on other types of disadvantage. However, most schools have taken a mixed approach, with 85% of all respondents indicating that they have used ASF to support 'universal' approaches. These findings are consistent across most key respondent groups, although schools in rural areas are less likely to include a specific focus on those affected by socio-economic deprivation and/or other types of disadvantage.
How approach to achieving equity is targeted within the school community
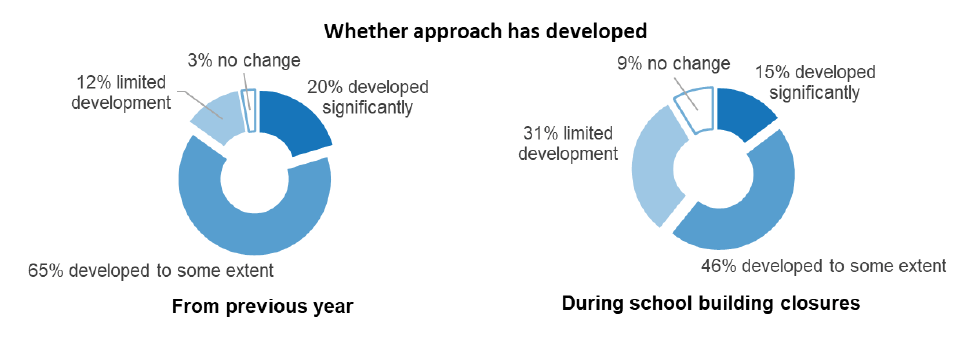
2.6 A large majority of schools had developed their approach to achieving equity from the previous school year; 85% indicated that their approach at the start of 2019/20 had developed from 2018/19, including 20% where the approach had 'developed significantly'. This represents an increase on the previous survey, where 67% indicated that their approach had changed from the previous year.
2.7 A substantial proportion of schools also further developed their approach to achieving equity during school building closures in March to June 2020; 61% indicated this, including 15% where the approach had 'developed significantly' during this period. This finding was broadly consistent across key respondent groups. However, survey findings suggest that schools were more likely to have developed their approach during school closures if their approach had developed from the previous year. For example, 81% of schools who had significantly developed their approach from 2018/19 continued to develop their approach during school building closures, compared with 24% of schools who had little or no development from 2018/19.
To what extent approach to closing the poverty-related attainment gap has developed
Use of data and evaluation
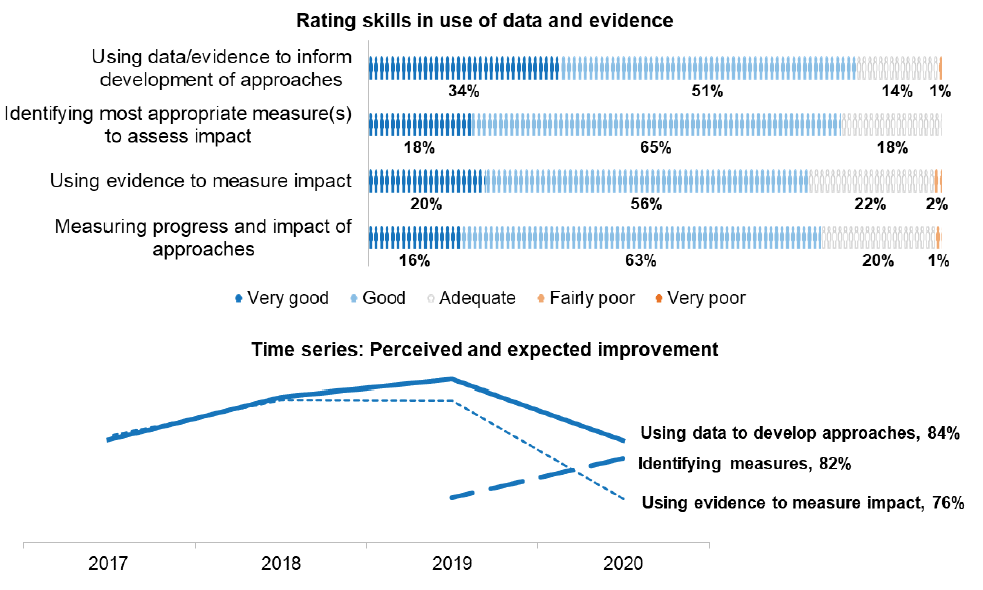
2.8 A large majority of headteachers felt that they are 'very good' or 'good' in using data and evidence to inform development of their approach; 84% indicated this. This represents a nine-point decrease from 2019, and is similar to the 2017 survey.
2.9 Headteachers were also positive about their skills in measuring the impact of their approaches; 82% were positive about their ability to identify appropriate measures, and 76% were positive about their use of evidence to measure impact. However, the latter result represents a 14-point decrease from the 2018 and 2019 surveys (where 90% felt they used evidence to effectively measure impact). It is also notable that PEF-only schools and those with lower PEF allocations were less positive than others on this indicator.
2.10 More than three quarters (78%) felt that they are 'very good' or 'good' at measuring the progress and impact of ASF-supported approaches. This finding was broadly consistent across key respondent groups.
Rating of school's approach to use of data and evaluation
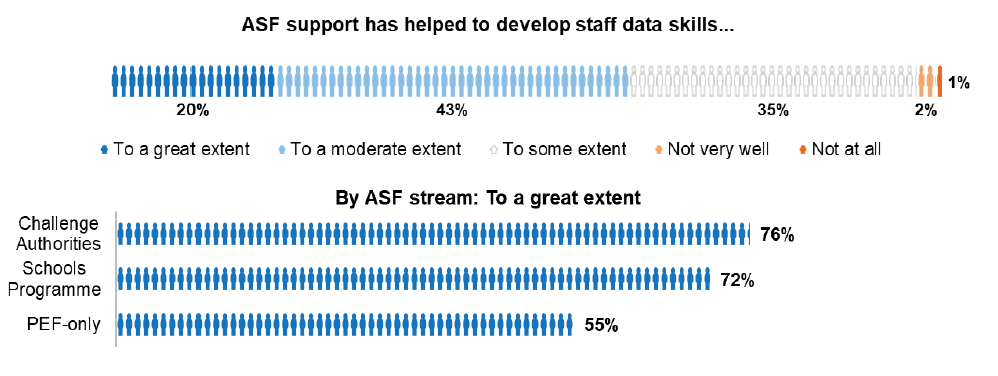
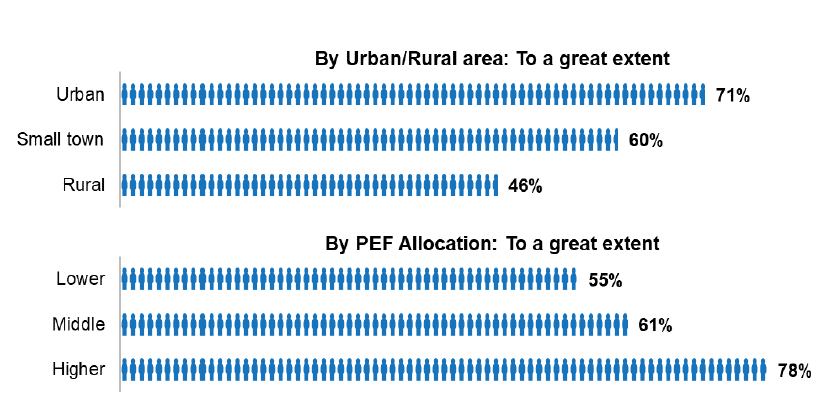
2.11 The majority of schools feel that ASF support has helped to develop staff skills and knowledge in using data and evaluation; 63% indicated that ASF had helped to develop these skills to a 'great' or 'moderate' extent. Survey findings indicate some significant variation in views across key respondent groups. In particular, PEF-only schools, those in rural areas and those with lower PEF allocations were less positive on this measure.
To what extent ASF support helped to develop staff skills and knowledge in using data and evaluation
Impact
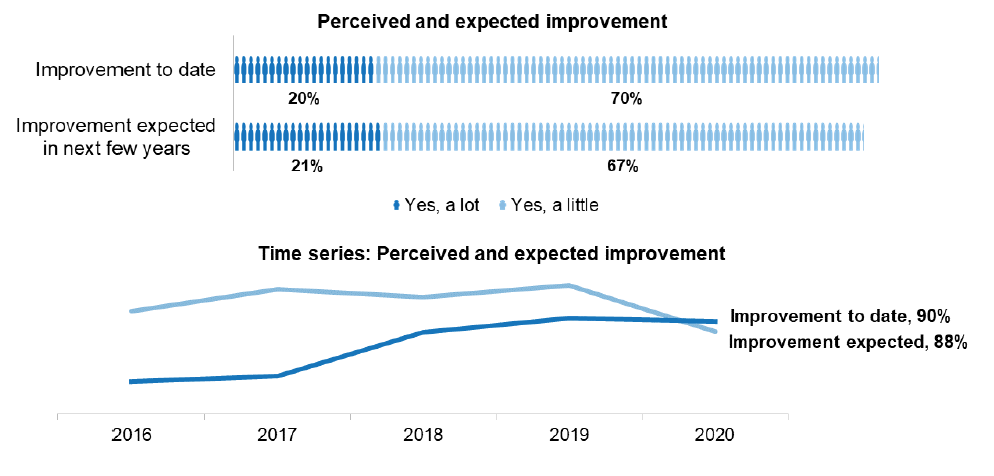
2.12 A large majority (90%) of schools reported seeing an improvement in closing the poverty-related gap in attainment and/or health and wellbeing as a result of ASF supported approaches. This included 20% that had seen 'a lot' of improvement to date. Survey data indicates that PEF-only schools were less likely to have seen 'a lot' of improvement to date.
2.13 A similar number of schools (88%) expected to see improvement in closing the gap over the next few years, although this represents a 10-point reduction since the 2019 survey. Survey responses also indicated some correlation between schools having already seen improvement, and expectations of further improvement; 67% of those who had seen 'a lot' of improvement to date expected to see 'a lot' more, compared with 11% of those who had only seen 'a little' improvement to date.
Perceived improvement in closing the poverty-related gap in attainment or health/wellbeing

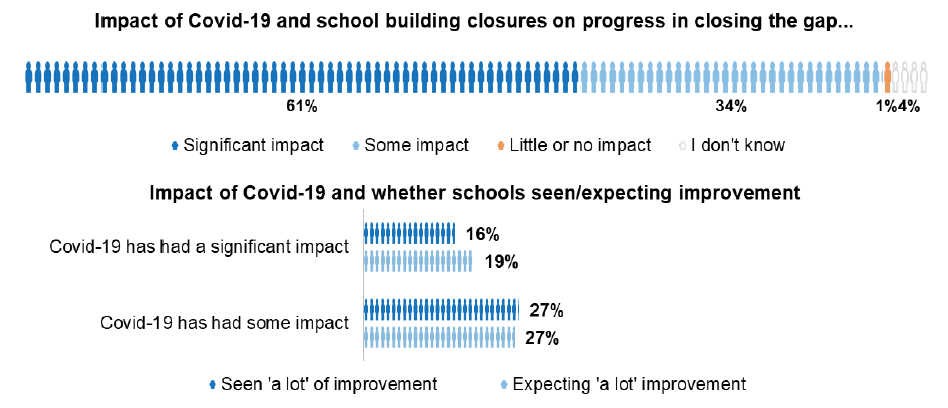
2.14 The great majority of schools (95%) felt that COVID-19 and school building closures had at least some impact on their progress in closing the poverty-related attainment gap. This included 61% who felt that COVID-19 and school building closures had a 'significant impact' on their progress. Secondary schools and those with middle to higher PEF allocations were most likely to feel that their progress had been significantly affected by COVID-19 and school building closures.
2.15 Survey findings also indicate some correlation between perceived impact of COVID-19, and perceived improvement in closing the poverty-related attainment gap. For example, those who felt that COVID-19 has had a significant impact on their school were less likely to have seen 'a lot' of improvement to date.
Perceived impact of Covid-19 and school building closures on progress in closing the poverty-related gap in attainment or health/wellbeing
Factors influencing impact
2.16 In addition to variation across respondent groups (such as funding stream, PEF allocation and urban/rural geography), survey analysis also considered correlation between perceived progress in closing the gap and other aspects of headteachers' experiences. This considered a wide range of factors including schools' approach to closing the gap, headteachers' understanding and awareness in shaping that approach, embedding equity, use of evidence, collaborative working, and views on availability of support for PEF.
2.17 This analysis indicates that a number of respondent groups are more likely to have seen progress in closing the gap (see the table below). In particular, survey results indicate that key factors in closing the gap include changes of culture or ethos (such as embedding the approach to equity or improved collaborative working), better understanding of barriers faced by pupils and families, skills and knowledge in use of data and evidence, and engagement with families and communities. This is similar to the findings of the 2019 survey, which highlighted changes in culture and ethos and improved understanding of barriers faced by pupils.
| Feel that approach to achieving equity has been embedded within school community |
| Feel they understand the challenges and barriers faced by pupils and parents affected by poverty |
| Feel ASF has helped to develop staff data and evidence skills |
| Have seen an increase in collaborative working |
| Feel their measuring of progress and impact of approaches is 'very good' or 'good' |
| Feel their use of data and evidence to measure impact is 'very good' or 'good' |
| Engagement with families and communities has been part of the school approach |
| Approach to equity has developed from the previous school year |
Sustainability of impact
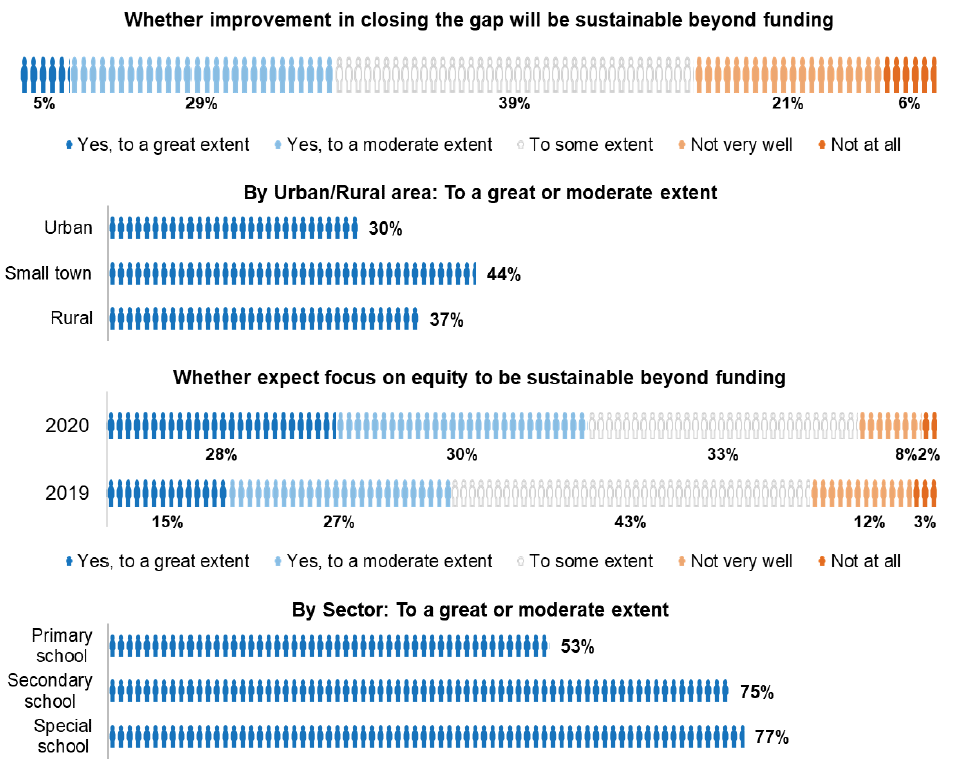
2.18 Around a third (34%) of headteachers expected that the ASF supported improvement they had seen to date will be sustainable beyond the years of funding. This represents a seven-point reduction from the 2019 survey, although here has been a change in the question structure for the present survey which makes direct comparison difficult. Survey findings also show some variation across key respondent groups, with those in urban areas less likely to feel that their progress to date will be sustainable.
2.19 Views were more positive on the extent to which the focus on equity will be sustainable beyond the years of funding; 58% felt that this will be the case, a 17-point increase on the 2019 survey. Survey findings show some variation across key respondent groups, with primary schools less likely to feel that the focus on equity will be sustainable beyond funding.
Views on sustainability of improvements
Collaborative working
2.20 The majority of headteachers had seen an increase in collaborative working in their school up to March 2020 as a result of ASF support. Nearly 2 in 3 (65%) indicated this, including more than a third (36%) who had seen a large increase in collaborative working as a result of the fund. This was broadly consistent with 2019 survey findings, although the proportion reporting increased collaboration has fallen from a peak in 2017.
2.21 A substantial proportion of headteachers indicated that they had seen a further increase in collaborative working during school building closures between March and June 2020; 46% indicated this.
2.22 Survey findings show some variation in school experiences around collaborative working. In particular, primary schools and those in rural areas were less likely to have seen an increase in collaborative working – up to and during the period of school building closures.
Whether seen an increase in collaborative working as a result of the Fund

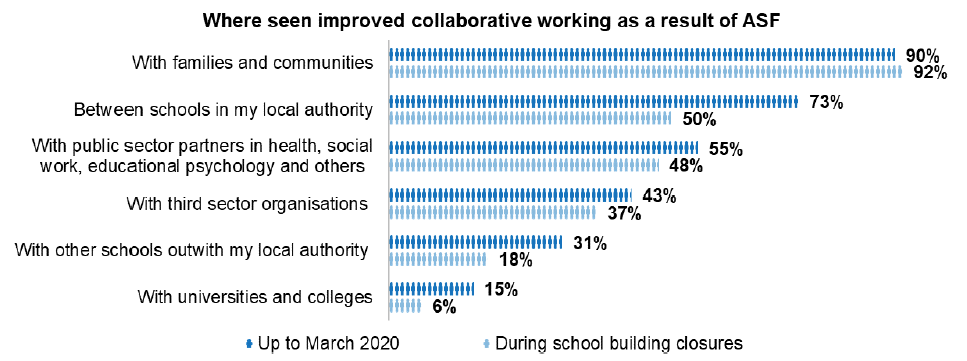
2.23 In terms of types of collaborative working, schools were most likely to have seen an increase in collaboration with families and communities, and other schools in their local authority. This applied both to the period up to and during school building closures, although survey results suggest that fewer schools were able to continue to improve collaboration with other schools during school building closures (50%, compared with 73% prior to closures). In contrast, 92% were able to continue to improve collaboration with families and communities during school building closures.
2.24 Survey findings show some variation in experience of collaboration across key respondent groups. This was particularly notable for collaboration with third sector organisations; Challenge Authority schools, secondary schools, and those in urban areas or small towns were most likely to have built collaborative working with third sector organisations.
Where seen an increase in collaborative working as a result of the Fund
Pupil Equity Funding
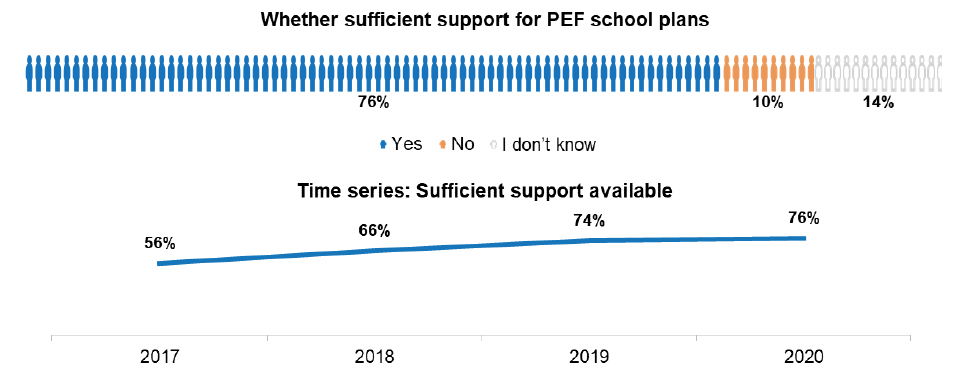
2.25 More than 3 in 4 (76%) headteachers felt there was sufficient support in place to develop and implement their school plan for PEF. This was similar to the 2019 survey and represents a 20-point increase on the 2017 survey. Views were broadly similar across key respondent groups.
Whether felt sufficient support to develop and implement school plan for PEF
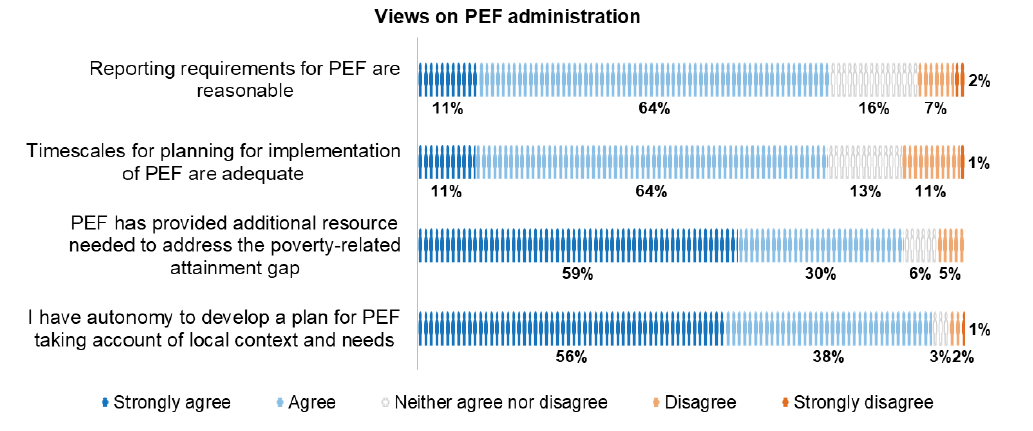
2.26 Headteachers were generally positive in relation to processes around the allocation of PEF. Most (75%) felt that reporting requirements associated with PEF were reasonable, and a similar proportion felt that timescales for planning for PEF have been sufficient (75%). These findings each represent a 12-point improvement from the 2019 survey.
2.27 Views were also very positive on whether PEF had provided additional resource needed to address the poverty-related attainment gap; 89% felt this has been the case. This is similar to the 2019 survey, and views were broadly consistent across key respondent groups.
2.28 The great majority of headteachers also felt they had autonomy to develop plans that are responsive to their local context and needs (94%). This view was consistent across key respondent groups and is similar to that reported in 2019.
Views on PEF processes and implementation
Contact
Email: Joanna.shedden@gov.scot
There is a problem
Thanks for your feedback