Attainment Scotland Fund Evaluation: Reporting on National Improvement Framework Attainment and Health and Wellbeing Measures, 2024
This report summarises evidence around improvement in attainment and health and wellbeing, and the gap between pupils from the most and least deprived areas. It draws on analysis of quantitative data based on the core measures for monitoring progress on closing the poverty-related attainment gap
Summary Infographics
Achievement of Curriculum for Excellence (CfE) Levels
The attainment gap between school pupils in the most deprived and least deprived areas has narrowed since 2016/17 in Primary Literacy. It has narrowed since 2016/17 in Primary Numeracy.
Percentage of P1, P4 and P7 pupils combined achieving expected level by SIMD, 2016/17 to 2022/23:
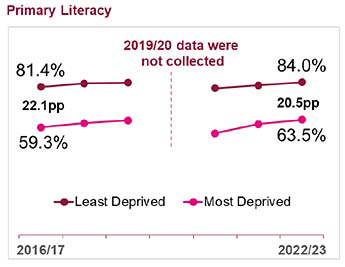
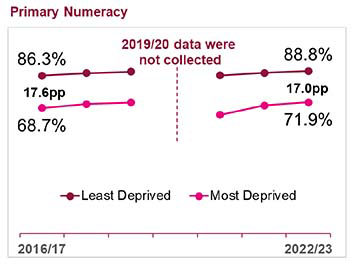
Overall, the percentage of primary pupils (P1, P4 and P7 combined) achieving expected Literacy levels has increased from 69.2% in 2016/17 to 72.7% in 2022/23. The percentage achieving expected Numeracy levels has increased from 76.4% in 2016/17 to 79.6% in 2022/23.
The attainment gap between school pupils in the most deprived and least deprived areas has slightly widened since 2016/17 in Secondary Literacy and narrowed in Secondary Numeracy.
Percentage of S3 pupils achieving Third Level or better by SIMD, 2016/17 to 2022/23:
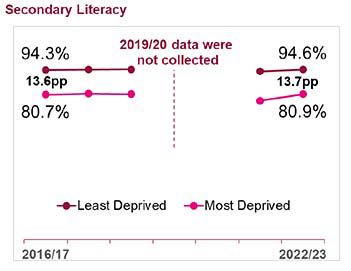
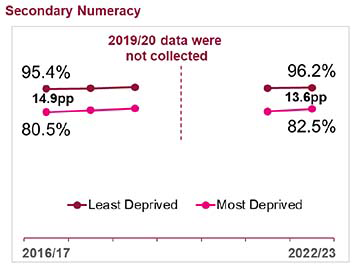
Overall, the percentage of S3 pupils achieving Third Level or better in Literacy has increased from 87.1% in 2016/17 to 87.8% in 2022/23. The percentage achieving Numeracy has increased from 88.2% in 2016/17 to 89.6% in 2022/23.
School leaver initial destinations
The gap between leavers from the most deprived and least deprived areas in a positive initial destination has narrowed since 2015/16.
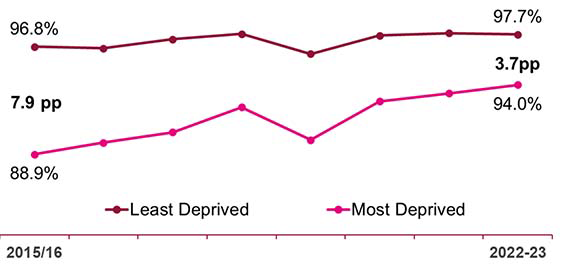
Overall, the percentage of school leavers in a positive initial destination has increased, from 93.5% in 2015/16 to 95.9% in 2022/23.
School leaver attainment- National Qualifications only
The attainment gap between leavers from the most deprived and least deprived areas has narrowed since 2015/16 at SCQF Levels 4 or better, 5 or better and 6 or better.
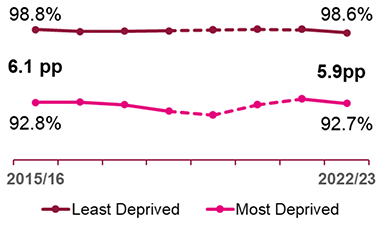
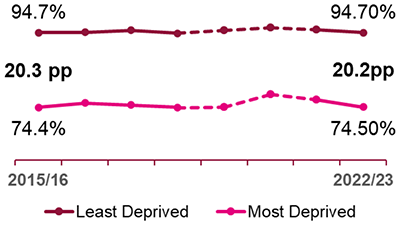
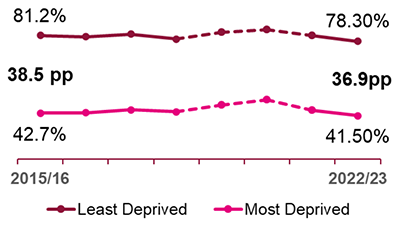
Overall, the percentage of school leavers with one or more qualifications has Decreased at SCQF Level 4 or better, from 96.3% in 2015/16 to 96.0% in 2022/23. Decreased at SCQF Level 5 or better, from 85.6% in 2015/16 to 84.8% in 2022/23. Decreased at SCQF Level 6 or better, from 61.7% in 2015/16 to 57.9% in 2022/23.
Notes:
- Dashed line represents break in attainment data series due to the change in certification methods in 2020 and 2021. See publication for more details.
Annual Participation Measure
The gap between the percentage of 16 - 19-year-olds from the most deprived and least deprived areas participating in education, training or employment has narrowed since 2016.
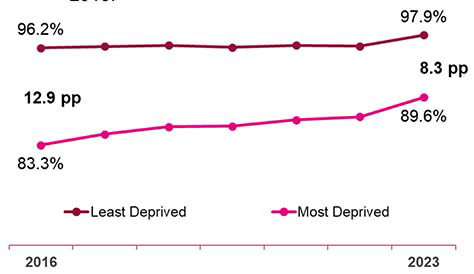
Overall, the percentage of 16 - 19-year-olds participating has increased, from 90.4% in 2016 to 94.3% in 2023.
Attendance (primary and secondary)
The gap in attendance between school pupils from the most deprived and least deprived areas has widened since 2014/15, for primary school pupils and secondary school pupils.
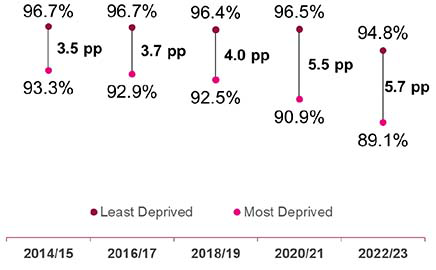
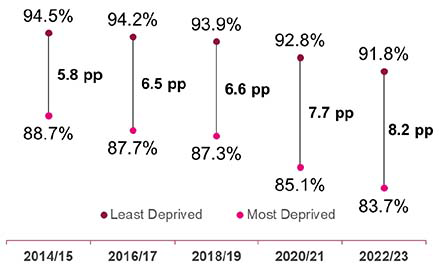
Overall, attendance for Primary school pupils has decreased from 95.1% in 2014/15 to 92.2% in 2022/23. Attendance for Secondary school pupils has also decreased, from 91.8% in 2014/15 to 87.7% in 2022/23.
Notes:
- The attendance rate for 2020/21 refers to attendance when schools were open for pupils to attend in person.
- Attendance data is collected every two years.
27 – 30 Month Review
The gap between children from the most deprived and least deprived areas who have no developmental concerns across all domains has narrowed since 2015/16.
Overall, the percentage of children with no developmental concerns in Scotland has increased from 72.4% in 2015/16 to 73.2% in 2021/22.
Notes:
- These statistics are affected by the COVID-19 pandemic. The impact of the pandemic should be borne in mind when considering changes over time. See the relevant section(s) of the publication for more details.
- pp = percentage point. Percentage point gaps are calculated from unrounded numbers.
Contact
Email: socialresearch@gov.scot
There is a problem
Thanks for your feedback