Attainment Scotland Fund Evaluation: Reporting on Wider Evidence Sources, 2024
This report complements the NIF Measures Report by bringing together analysis of a wider set of national surveys and data, which offer further insights into the nature of the poverty-related attainment gap and the experiences of affected children and young people, and their families
Attainment and Positive Destinations
64. This section of the report provides an overview of evidence related to attainment and achievement, as well as pulling together data around positive destinations post school. This includes:
- Attainment in the Senior Phase
- Attainment at 15 – the Programme for International Student Assessment (PISA)
- Educational Outcomes for Looked After Children
- Positive Destinations – Widening Access to Higher Education
- Positive Destinations – Longitudinal Educational Outcomes
Attainment – All SCQF measure
65. These statistics[19] describe attainment in any qualification or learning programme on the Scottish Credit and Qualifications Framework (SCQF). This includes the SQA National Qualifications, other SQA qualifications, and qualifications from other providers. The qualifications included will change over time, reflecting the changing types of qualifications pupils are undertaking.
66. The All SCQF measures are not currently amongst the 13 key National Improvement Framework measures which are used to assess progress towards closing the poverty-related attainment gap[20]. Instead, the narrower National Qualifications measure is used.
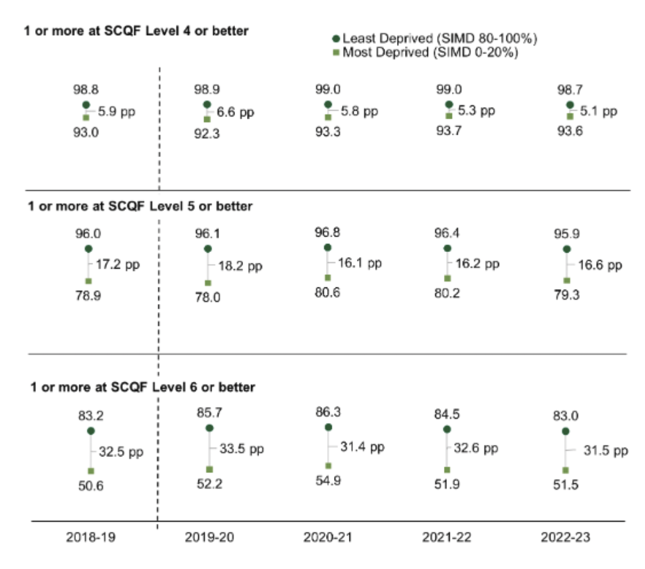
67. Figure 1 shows the proportions of school leavers from the most and least deprived areas who attained 1 pass or more at SCQF Levels 4 or better, 5 or better and 6 or better, as measured under the All SCQF measure.
68. There were changes in how many qualifications were assessed and graded in the years 2020 to 2023, as a result of the COVID-19 pandemic. Therefore care should be taken when making comparisons between 2022-23 and earlier years. Any increase or decrease should not be interpreted as indicating improving or worsening performance without further evidence.
69. The following paragraphs indicate how attainment at SCQF levels 4-6, and the poverty-related attainment gap, have changed since 2009/10:
At SCQF Level 4 or better
- the gap between the proportion of school leavers from the most deprived and least deprived areas attaining one pass or more based on the All SCQF measure was 5.1 percentage points in 2022-23. This has narrowed from 5.3 percentage points in 2021-22.
- The proportion attaining one pass or more at this level decreased for school leavers from both the most and the least deprived areas between 2021-22 and 2022-23. However, it decreased by more for those from the least deprived areas, which has led to the gap between the two groups narrowing.
- The gap is currently at its narrowest since 2009-10, having started at 11.0 percentage points in 2009-10 and having narrowed almost every year since.
At SCQF Level 5 or better
- the attainment gap under the All SCQF measure was 16.6 percentage points in 2022-23. This is wider than in 2021-22 (16.2 percentage points).
- The proportion attaining 1 pass or more decreased for school leavers from both the most and the least deprived areas between 2021-22 and 2022-23. However, it decreased by more for those from the most deprived areas, which has led to the gap widening.
- Longer term, the gap has narrowed most years, starting from 32.1 percentage points in 2009-10 and reaching its narrowest in 2020-21 (16.1 percentage points). The gap in 2022-23 is narrower than in all years other than 2020-21 and 2021-22.
At SCQF Level 6 or better
- The attainment gap under the All SCQF measure was 31.5 percentage points in 2022-23. This is narrower than in 2021-22 (32.6 percentage points). The proportion attaining one pass or more decreased for school leavers from both the most and the least deprived areas between 2021-22 and 2022-23. But it decreased by more for those from the least deprived areas, which has led to the gap between the two groups narrowing.
- Longer term, the gap has narrowed most years, starting from 45.4 percentage points in 2009-10 and reaching its narrowest in 2020-21 (31.4 percentage points). The gap in 2022-23 is narrower than in all years other than 2020-21.
70. The poverty-related attainment gap is narrower under the All SCQF Measure than under the National Qualifications measure, as shown in Figure 2:
SCQF Level |
National Qualifications measure |
All SCQF measure |
|---|---|---|
SCQF Level 4 or better |
5.9 pp |
5.1 pp |
SCQF Level 5 or better |
20.2 pp |
16.6 pp |
SCQF Level 6 or better |
36.9 pp |
31.5 pp |
Attainment - Programme for International Student Assessment (PISA)
71. The Programme for International Student Assessment (PISA) is an assessment of 15 year-olds' skills in Mathematics, Reading and Science. Eighty-one countries and around 690,000 students participated in PISA 2022. The survey was carried out in Scotland between 18 October and 22 December 2022.
72. Scotland's overall performance in 2022 was lower than in 2018 in Mathematics and Reading, and similar in Science. The OECD average for Mathematics and Reading also fell, with 31 OECD countries achieving a lower score in Mathematics than in 2018.
73. Scotland's scores in the 2022 PISA assessments were above the OECD average in Reading and similar to the OECD average in Mathematics and Science. This was also the case in the PISA 2018 assessments.
74. The proportion of pupils performing at the highest levels of achievement ("Level 5 and above") was higher in Scotland than the OECD average in Reading, and similar in Maths and Science. The proportion of pupils performing at the lowest levels of achievement ("below Level 2") was lower in Scotland than the OECD average in Reading, and similar in Maths and Science. This is the same as in the PISA 2018 assessments.
Results by socio-economic background
75. PISA measures the strength of the relationship between social background and performance by the share of variation in scores explained by the index of Economic, Social and Cultural Status (ESCS)[21].
76. The strength of the relationship between students' background and Mathematics test scores in 2022 was almost double what it was in 2018 (15.9 per cent compared to 7.9 per cent). It was also higher than in 2015 (11.1 per cent) but was similar to 2006, 2009 and 2012. It remained similar to the OECD average. The connection between Mathematics performance and social background in Scotland is therefore stronger than before. However, for Reading and Science, the variation explained by social background was similar to 2018.
77. It is worth noting that the strength of relationship between socio-economic background and performance in Reading and Science was lower in 2012, 2015, 2018 than it was in 2006 and 2009. Although the figures in PISA 2022 are higher, they are within the standard error and are statistically similar.
78. For Mathematics, the strength of relationship between socio-economic background and performance was lower in 2012, 2015 and 2018, compared to 2006 and 2009, but then increased in 2022.
79. Other key socio-economic findings in PISA scores include:
- Across all students in Scotland, the average PISA score was higher in Reading than in Science and Mathematics. The same is the case for students in the lowest ESCS quartile (the most disadvantaged) who, on average, scored 457 in Reading (compared to 545 for the top quarter), 444 in Science (compared to 536 for the top quarter), and 428 for Mathematics (compared to 526 for the top quarter).
- The OECD categorise student performance into levels. Achievement of Level 2 is considered by the OECD to be the baseline at which students begin to demonstrate the knowledge and skill to enable them to participate actively in life situations related to Maths. 47.6 per cent of students in the bottom ESCS quartile scored lower than Level 2 (and are classed as a 'low performer') compared to 12.9 per cent in the top ESCS quartile. For Reading, the equivalent figures were 30.2 per cent and 8.8 per cent respectively.
Educational Outcomes for Scotland's Looked after Children
80. The Care Experienced Children and Young People Fund is a targeted resource provided to local authorities through the ASF to support care experienced children and young people from birth to the age of 26. The funding is provided to local authorities and aims to improve educational outcomes for care experienced children and young people, supported by strategic goals of The Promise and Scottish Attainment Challenge.
81. There is a significant link between area based deprivation and care experience. In total, 59% of care experienced children (with birth records) were born into the most deprived areas compared to 25% of children in the general population[22].
82. An annual publication outlines educational outcomes for Looked After Children, including School Leaver Initial Destinations, Follow-up Destination Data, and Achievement of Curriculum for Excellence Levels data. This publication pulls together data from different datasets. It should be noted that the definition of Looked After Children does not match with that of Care Experienced Children and Young People (which covers all children and young people who have had Looked After status at some point in their lives), but provides a useful indicator.
83. More looked after children are staying in school for longer, and achieving higher qualifications than last year. However, there are still large gaps compared with all pupils.
- A total of 31.7 per cent of looked after school leavers left in S4 or earlier in 2021/22, which was a decrease from 37.3 per cent in 2020/21. However, this was higher than the total for all leavers (12.4 per cent).
- A total of 78.3 per cent of looked after school leavers achieved 1 or more qualification at SCQF level 4 or better, which was up from 70.9 per cent in 2020/21. However, this was lower than the total for all leavers (96.4 per cent).
- A total of 84.8 per cent of looked after leavers were in a positive initial destination, which was down from 86.0 per cent in 2020/21. This compared to 95.7 per cent of all leavers.
- A total of 70.4 per cent of looked after leavers were in a positive follow-up destination, which was down from 71.0 per cent in 2020/21. This compared to 93.5 per cent of all leavers.
- A lower proportion of looked after pupils achieve Curriculum for Excellence (CfE) levels relevant to their stage compared with all pupils. the largest gaps between looked after pupils and all pupils are: 29.9 percentage points in reading (P4); 32.0 percentage points in writing (P4); 27.2 percentage points in listening and talking (S3); 32.5 percentage points in numeracy (P4).
Positive destinations – Widening Access to Higher Education
84. The Commission for Widening Access resulted in a commitment to a target of students from the 20% most deprived areas to represent 20% of entrants to higher education by 2030. A series of interim targets were also set.
85. Reports from the Commissioner for Fair Access[23] show substantial progress has been made in widening access to higher education in Scotland, across a range of student characteristics. Key findings include:
SIMD
- The highest ever number of entrants from Scotland's most deprived areas was achieved in 2021/22 (5,595).
- The interim target that by 2021 16 per cent of full-time first-degree Scottish domiciled entrants to higher education institutions in Scotland should come from the 20 per cent most deprived communities as measured by the Scottish Index of Multiple Deprivation (SIMD) was effectively met two years early (15.9 per cent in 2018-19)
Care Experienced Children and Young People
86. Care Experience is recognised alongside SIMD as a key measure of progress towards fair access. Data from a range of sources indicate that care-experienced younger people have been substantially under-represented in higher education. For example, In 2017-18, 36 per cent of those who were looked after for part of the year and 49 per cent of those who had been looked after for the whole year went on to higher or further education, compared with 94 per cent of other young people. The data shows clear progress in widening access for care experienced children and young people:
- There was a record number of Care Experienced entrants to full time first degrees in 2021/22. This has increased from a total of 145 care experienced entrants (0.8% of all entrants) in 2013/14 to a total of 545 care experienced entrants (1.6% of all entrants) in 2021/22.
- There is a clear relationship between care experience and levels of deprivation. Around of quarter (26.1%) of care experienced entrants in 2021/22 were recorded as living in SIMD 1, indicating almost 150 care experienced entrants from the most deprived areas of Scotland.
Gender
87. Women make up a majority of both full-time and part-time students in universities - 59 per cent compared with 41 per cent, a gap of 18 per cent. That gap has widened over the past two decades. The Widening Access data provides insights into how progress in widening access has differed by gender:
- Although women are in an overall majority, there are proportionately more male students in the two least deprived SIMD quintiles. In contrast, women pre-dominate in the other three SIMD quintiles. The report suggests that the pattern may be explained by subject choice, higher female attainment in SIMD 1, and continuing gender based stereotypes.
- The report identifies that the welcome progress towards increasing the proportion of SIMD 1 applicants and entrants in universities is disproportionately due to an increase in participation among women. While the SIMD profile of male students has changed only a little since 2013-14, the profile of female students has shifted significantly from less to more deprived areas.
- In 2018-19, 16.9 per cent of female students came from SIMD 1 compared to 14.3 per cent of male students.
- There continue to be substantial gender imbalances between subjects. In 2018-19, 86 per cent of first degree entrants in subjects allied to medicine and 85 per cent in education were women. In computer science 82 per cent and in engineering and technology 81.5 per cent were men. These differences feed through into degree class profiles and also future earnings and access to some high-status professions.
Intersectionality
88. The Commission report concludes that although social class is the single most important factor in unequal access to higher education, other factors should also be given due weight. There are important cross-overs between social class and most of these other factors, notably care experience, ethnicity and (to a lesser degree) age.
Postgraduate Study
89. Representation of full-time entrants from deprived areas (SIMD 1) is lower at postgraduate level than first degree level. This reflects the lower progression rates from first degrees to postgraduate degrees among leavers from these areas.
- Differences in progression rates between students from the least and most deprived areas can be accounted for by differences in first degree outcomes, subject studied and institution attended between these groups.
- Differences in leaver destinations between SIMD 1 leavers and other leavers at postgraduate level are starker than those observed at first degree level and persist when subject studied, institution attended and qualification type are accounted for.
90. In 2017/18, students from the most deprived areas (SIMD 1) comprised a lower percentage of the postgraduate entrant population (12.5%) than they did in first degree study (15.6%), whereas those from the least deprived areas (SIMD 5) had a higher representation in postgraduate study (30.7%) relative to first degree study (28.2%).
Longitudinal Educational Outcomes
91. The Longitudinal Educational Outcomes (LEO) data is a recently developed database from the Department for Education (DfE), which contains information on labour market outcomes for learners from schools, colleges and universities.
92. Two Official Statistics publications released by the Scottish Government in 2022[24] present employment and earnings for graduates and modern apprentices five years after graduating/completion from an institution in Scotland. The reports use earnings from the 2019/20 tax year to examine the five year outcomes for the 2013/14 cohorts of graduates/completers. This publication only covers graduates who are in 'Sustained employment only' with no further study.
93. For first degree graduates, it shows that earnings decrease with each SIMD quintile, from the highest earnings in Quintile 5 (20% least deprived areas) to the lowest earnings in Quintile 1 (20% most deprived areas). Graduates from Quintile 5 who graduated in 2013/14 earned £30,400 in 2019/20 compared to those from Quintile 1 who earned £27,100.
94. These differences in earnings between SIMD quintiles are consistent for both females and males. Female graduates from Quintile 5 who graduated in 2013/14 earned £29,300 in 2019/20, compared to those from Quintile 1 who earned £26,400. Similarly, male graduates from Quintile 5 who graduated in 2013/14 earned £31,500 in 2019/20, compared to those from Quintile 1 who earned £28,200.
95. The report indicates that differences in earnings between quintiles may be partially reflected by subject choice and higher education institution. Graduates from the 20% most deprived areas are less likely to attend certain universities than those from other areas, and are less likely to do subjects like Medicine and Engineering which have higher median earnings.
96. For Modern Apprenticeship completers, the figures show that completers from Quintile 5 were earning £24,200 in 2020/21, five years after completing their MA in 2015/16. This compares to £20,300 for MAs from the most deprived areas. Earnings typically decrease with each SIMD quintile, from the highest earnings in the least deprived quintiles to the lowest earnings in the most deprived quintiles.
97. These differences in earnings between SIMD quintiles are broadly consistent for both females and males. When comparing the highest and lowest earnings between SIMD quintiles, female completers from Quintile 5 had the highest earnings, earning on average £2,300 more than a female completer from Quintile 1, the lowest earning quintile (£17,300 for females from Q1 and £19,600 for females from Q5).
98. For male completers, those from Quintile 4 had the highest earnings, earning on average £5,000 more than a male completer from Quintile 1 (£23,200 for males from Q1 and £28,200 for males from Q4).
99. The differences in earnings between quintiles may be partially reflected by apprenticeship framework choice. For example, MA completers from the least deprived quintiles are more likely to do apprenticeships in Engineering and Energy, where the highest median earnings are seen.
Contact
Email: socialresearch@gov.scot
There is a problem
Thanks for your feedback