Attainment Scotland Fund Evaluation: Reporting on Wider Evidence Sources, 2024
This report complements the NIF Measures Report by bringing together analysis of a wider set of national surveys and data, which offer further insights into the nature of the poverty-related attainment gap and the experiences of affected children and young people, and their families
Health and Wellbeing
100. This section of the report provides an overview of evidence related to health and wellbeing in school. This includes:
- Mental health and wellbeing
- Attitudes towards and experiences of school
- Behaviour and peer relationships
- Neighbourhood and life at home
Mental Health and Wellbeing
101. There is a range of data and evidence sources which outline the health and wellbeing gap between those from more and less deprived backgrounds. These include the Health and Wellbeing Census, the Growing up in Scotland survey, and PISA data. These sources provide a wealth of insights on the mental health and wellbeing of both children and young people and families.
102. At entry to primary school, data from the Growing up in Scotland survey[25] showed that children in the lowest income group were around twice as likely (or more, depending on which measure was used) than those in the highest income group to exhibit borderline or abnormal social, emotional or behavioural health. For example, 19% of children in the highest income group had scores in the borderline or abnormal ranges for conduct problems compared with 43% of children in the lowest income group. With regard to emotional problems, the figures were 6% and 16% respectively and for hyperactivity they were 12% and 30% respectively.
103. Data from the Growing up in Scotland survey at age 8 examined family and school influences on children's social and emotional wellbeing[26]. The report found that:
- At this stage, the proportion of children classified as having high levels of social, emotional and behavioural difficulties was 3% among those living in households in the highest income quintile but 18% among those in lowest income quintiles.
- 25% of children in the whole sample were classed as having low life satisfaction, relative to the remaining 75%. However, a lower proportion of children in households in the highest income quintile (19%) reported low life satisfaction, compared to the lowest income quintile (29%).
104. The Health and Wellbeing Census[27] was carried out in 2021/22 and included two measures of wellbeing for those aged 13 years and over.
105. The first, the WEMWBS (Warwick Edinburgh Mental Wellbeing Scale) is used as an instrument for measuring wellbeing at a population level amongst those aged 13 years and over. Questions relate to an own person's perception of self-confidence, being loved, cared, positive or active amongst other things. This measure was used in the Health and Wellbeing Census in 2021/22. Key findings for WEMWBS from the Census included:
- In 2021/22, the average WEMWBS score for young people in S2 to S6 was 45.4 (out of a maximum of 70).
- By deprivation, the average WEMWBS score increased slightly as socio-economic deprivation decreased, suggesting some link between area deprivation and a lower reported level of mental wellbeing.
- In particular, there was a two point difference between the most deprived areas (44.4 for SIMD 1) and least deprived areas (46.4 for SIMD 5). Data would need to be monitored over time to assess whether this difference is sustained.
106. The Strength and Difficulties Questionnaire (SDQ) is also used in the Health and Wellbeing Census to measure emotional and behavioural difficulties for pupils over the age of 14. This indicator utilises 20 statements relating to emotional, conduct, hyperactivity / inattention and peer relationship problems. A total SDQ score range from a minimum of 0 to a maximum of 40. A higher score indicates greater evidence of difficulties, with scores banded into four categories: close to average, slightly raised, high, and very high. Key findings from the SDQ measure in the Census included:
- On average, 47% of young people had a 'Slightly Raised', 'High' or 'Very High' SDQ Total Difficulties score in 2021/22.
- Those living in areas of high deprivation were likely to have greater evidence of difficulties in their mental health. Specifically, 54% of children and young people in in the most deprived areas (SIMD 1) had a 'Slightly Raised', 'High' or 'Very High' SDQ Total Difficulties score, compared to 41% of those from the least deprived areas (SIMD 5).
107. The Health and Wellbeing Survey explored the health and wellbeing of children and young people across P5 to S6. Figure 3 outlines the gap between pupils from SIMD 1 and SIMD 5 agreeing to each statement. A breakdown of responses by school year, and the differences between SIMD 1 and SIMD 5, is provided in Appendix 2.
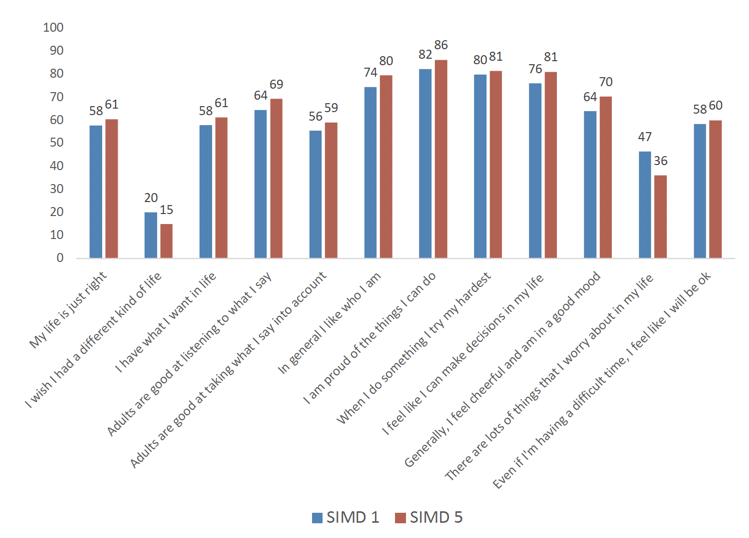
- Pupils from SIMD 1 were less likely than those in SIMD 5 across all stages to agree that 'my life is just right' and more likely to agree that 'I wish I had a different kind of life'.
- Pupils were asked in P5 – S1 whether 'there are lots of things that I worry about in my life' with a greater than 10 percentage point gap between pupils in SIMD 1 and SIMD 5 in P5-P7.
- When asked whether they agreed with the statement, 'even if I'm having a difficult time, I feel like I will be okay', there was a small gap between SIMD 1 and SIMD 5 between P5 and S1, and larger gap between S2 and S6.
- Pupils from SIMD 1 were more likely than those in SIMD 5 to agree that, 'I am proud of the things that I can do'. However, this was a minority of all pupils.
- The gap between pupils from SIMD 1 and SIMD 5 agreeing to each statement is lowest in P5 and highest between S1 and S3. However, as this is a snapshot survey at this stage, further data collection would be required to indicate if this a one-off finding or is consistent across early years of secondary school.
Attitudes to and experience of school
108. A range of evidence sources offer insights into educational attitudes and experiences, both from a child and parent viewpoint, and how they differ depending on socio economic background.
109. The Health and Wellbeing Census[28], undertaken in schools for the first time in 2021/22, explored the attitudes and experiences of school across P5 to S6. Figure 4 outlines the gap between pupils from SIMD 1 and SIMD 5 agreeing to each statement. A breakdown of responses by school year, and the differences between SIMD 1 and SIMD 5, is provided in Appendix 2.
110. There are similar questions and findings when compared with the Growing up in Scotland survey. For example, there is only a small gap between responses from pupils on enjoying learning new things and being happy at school at P5, which is similar to the findings from the GUS report, Life at 8. However, the Health and Wellbeing Census indicates that this gap appears to widen quickly at the end of Primary and start of Secondary schools.
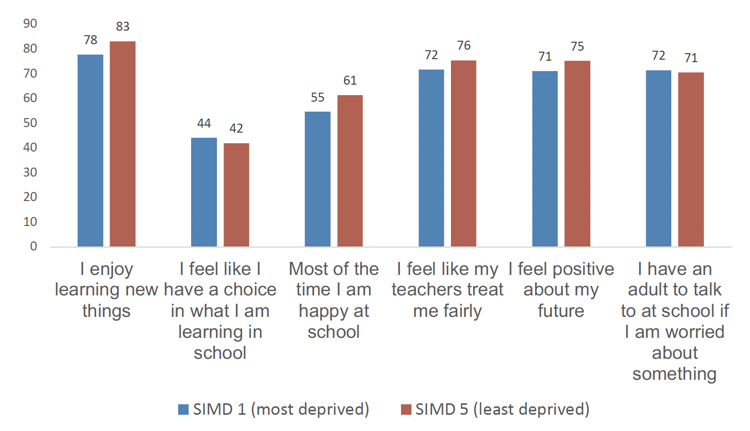
111. The data from the Health and Wellbeing Survey indicate that:
- The largest gap between pupils from SIMD 1 and SIMD 5 is for those agreeing that 'most of the time I am happy at school'. There was 10 percentage point gap between SIMD 1 and SIMD 5 pupils between S1 and S3 and at S6 on this statement.
- Pupils from SIMD 1 were more likely to indicate that they felt pressured by schoolwork between P7 and S3 than those in SIMD 5.
- Pupils from SIMD 1 were more likely to feel like they have a choice in what they are learning at school than those in SIMD until S5.
- There was only a small gap between SIMD 1 and SIMD 5 in those agreeing that they have an adult to talk to at school if they are worried.
- The gap between pupils from SIMD 1 and SIMD 5 agreeing to each statement is lowest in P5 and highest between S1 and S3. However, as this is a snapshot survey at this stage, further data collection would be required to indicate if this a one-off finding or is consistent across early years of secondary school.
Neighbourhood and Relationships
112. The relationships that children and young people have with their parents/carers and their peers, alongside their experiences of where they live, are important factors that influence educational outcomes and wellbeing. A number of surveys and data sets provide insights into these relationships and experiences, including providing comparisons between pupils in the most and least deprived areas. A breakdown of responses by school year, and the differences between SIMD 1 and SIMD 5, is provided in Appendix 2.
113. The Health and Wellbeing Census asked children and young people about their neighbourhood and personal relationships. Key findings include:
Neighbourhood
- Children and young people living in the most deprived areas were significantly less likely than those in the least deprived areas to say that they feel safe in the area where they live, and that they think the neighbourhood where they live is a good place to live. The gap between SIMD 1 and SIMD 5 is at its lowest in P5 and highest in S6.
- However, those living in the most deprived areas were more likely to say that they 'always' enjoy being with the people they live with.
Parents and trusted adults
- Comparing responses on the two questions around how easy it is to talk to their mother/female carer and father/male carer, there was a much larger gap between more deprived and less deprived areas for talking to their father/male carer.
- For both mother/female carer and father/male carer, the gap between SIMD 1 and SIMD 5 was higher in upper secondary than in younger stages.
- There was a gap between most deprived and least deprived children and young people in terms of having an adult in your life who you can trust and talk to, which is consistent across stages.
Friendships
- Children and young people living in the most deprived areas were less likely to say that they have three or more close friends, with the gap between SIMD 1 and SIMD 5 larger between S4 and S6.
- There was a much smaller gap between most and least deprived pupils on whether their 'friends treat me well'.
Bullying
114. Related to peer relationships is the experience that children and young people have of bullying, both within and outside of school.
115. The Health and Wellbeing Census asked pupils about their experiences of bullying, including where the bullying took place.
- In 2021/22, one in three children and young people (31%) reported having been bullied in the last year. Experience of bullying decreases in less deprived areas. In the most deprived areas (SIMD 1), over a third of children and young people (34%) reported bullying in the last year, with this falling to a quarter (26%) in the least deprived areas (SIMD 5).
- Of those who reported that they experienced bullying, the majority reported that this took place in school. Pupils living in SIMD 1 who reported being bullied were more likely than those living in SIMD 5 to report being bullied 'somewhere else' (38.8 per cent compared to 31.4 per cent) or 'online' (39.6 per cent compared to 31.5 per cent), but less likely to report being bullied in school (79.9 per cent compared to 83.6 per cent).
- In total, including those not reporting being bullied, 13.5% of P5 – S6 pupils in SIMD 1 reported that they had been bullied online/on social media/on a gaming platform in the last 12 months. This compares to 8.2% pupils in SIMD 5.
- 18.1% of pupils living in SIMD 1 reported that other children pick on them by sending emails, through messaging, or posting something online, at least once per week. This compares to 12.2% of pupils living in SIMD 5.
116. The PISA 2022 student questionnaire asked 15 year olds similar questions around their experience of bullying. Students were asked about types of bullying in their school, and whether and how frequently they experience them.
117. 10.6 per cent of students reported experiencing any type of bullying at least once a week, which was higher than the OECD average of 9.4 per cent. Conversely, 40.6 per cent of students in Scotland 'never or almost never' experienced any type of bullying, compared to an OECD average of 49.0 per cent. Using these data, PISA constructs a measure of the percentage of students who are frequently bullied[29]. In Scotland, this was 10.8 per cent compared to an OECD average of 8.3 per cent.
118. Students in Scotland were more likely than the OECD average to report experiencing, on at least a weekly basis, other students making fun of them and being threatened by other students. Conversely, students in Scotland were less likely than the OECD average to report that other students took away or destroyed things that belonged to them, that other students spread rumours about them, or that they stayed home because they felt unsafe.
Parental engagement
119. A range of evidence sources provide insight into parental engagement and parent-child relationships. Young people aged 14 were asked as part of the Growing up in Scotland survey about their relationship with their parent/carer. The majority said their parent 'always' listened to what they had to say, and that they can count on them to help them when they had a problem. Young people were less likely, however, to say that it was 'always' or 'often' true that they talked to their parent when they were having a problem.
120. The majority of young people also reported that their parent would ask if they knew something was bothering them and that their parent 'paid attention to them'. A smaller proportion, but still two thirds (65.3%), said that it was 'always' or 'often' true that they shared their thoughts and feelings with their parent.
121. There were differences observed across SIMD quintiles; 12.2% of parents in quintile 1 said it was 'very true' that they are always telling their child how to behave, compared with 6.4% in quintile 5. Parents in quintiles 1 and 2 (20.5% and 17.7% respectively) were more likely to say it was 'very true' that they are overprotective, compared with those in less deprived quintiles (10.8% of quintile 3, 10.5% of quintile 4 and 6.1% of quintile 5).
122. In general, parents of young people in more deprived SIMD quintiles were more likely than parents of young people in less deprived SIMD quintiles to say:
- Their child received support through special schools.
- They had been contacted about their child's behaviour at school and about their child's attendance at school.
- It was 'very true' that they are always telling their child what to do and how to behave and that they are overprotective of their child.
- Their child had caring responsibilities.
Contact
Email: socialresearch@gov.scot
There is a problem
Thanks for your feedback