Best Start, Bright Futures - tackling child poverty: progress report 2023 to 2024
The second annual progress report for 'Best Start, Bright Futures: Tackling Child Poverty Delivery Plan 2022-2026'. Outlining action for the period 2023 to 2024.
Section 2 - Assessing progress against the targets
While the rest of this report looks at progress from April 2023 to March 2024, this chapter draws on the available survey data, which covers up to March 2023. It builds on the previous progress report which looked at the period April 2021 to March 2022. Specifically, this chapter includes:
- overall progress towards the child poverty targets
- updated child poverty data on priority groups
- assessment of child poverty drivers (income from employment, cost of living and income from social security and benefits in-kind) including key indicators and contribution from policies
- assessment of the cumulative impact of our package of policies
- review of latest local action
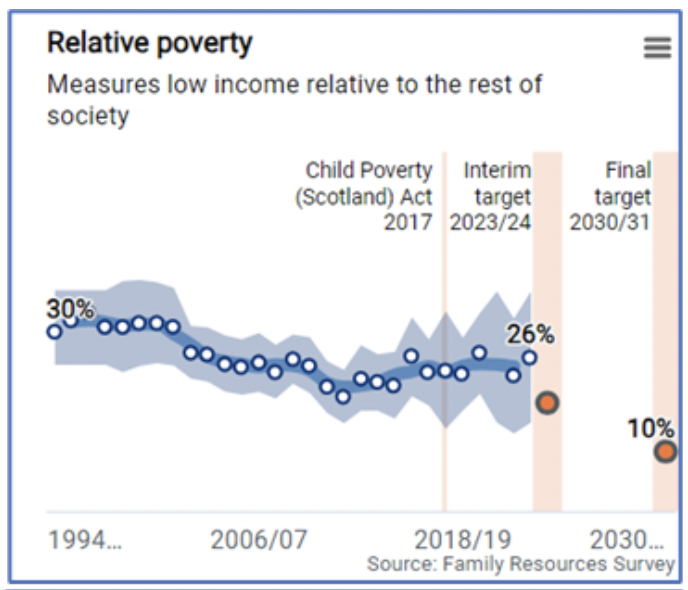
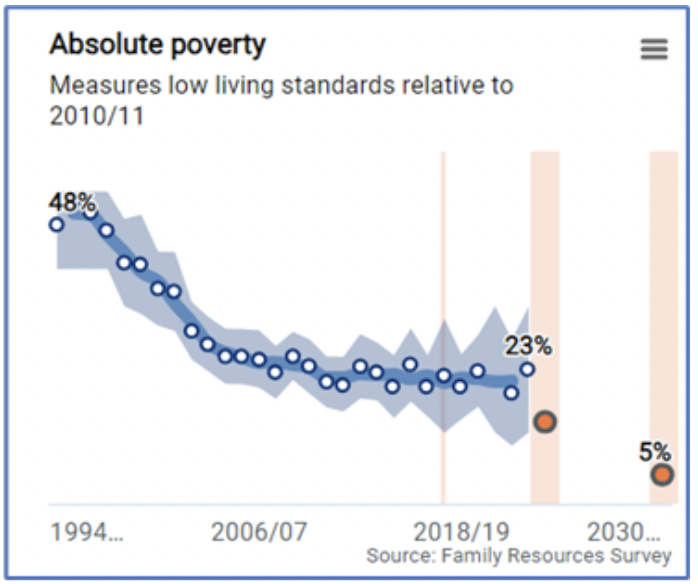
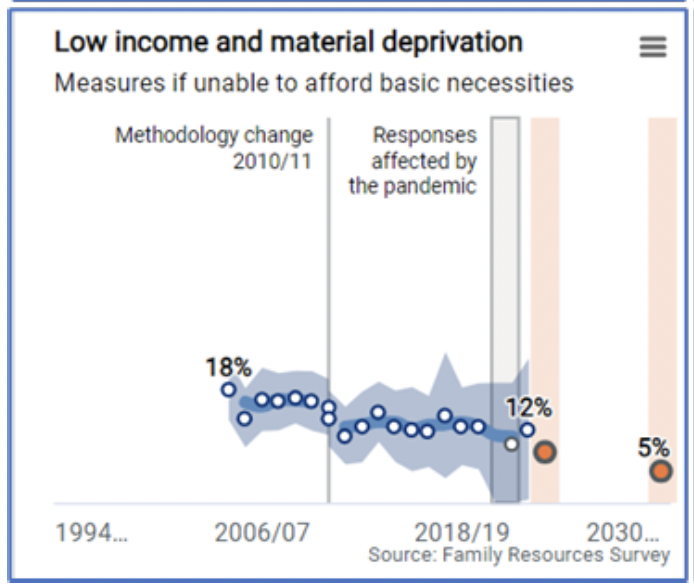
The latest progress against child poverty targets
Overall, long-term child poverty rates have shown little change in recent years. Still, too many children continue to live in poverty in Scotland, with rates remaining at a higher level than statutory targets.
The child poverty targets are measured by single-year data. Single-year estimates give us the latest best estimate. However, we also look at three-year averages in order to understand trends more accurately.
When looking at single-year estimates for 2022-23, data shows an increase in relative poverty, absolute poverty, and low income and material deprivation (see Figure 1). However, the recent increase is small and should be viewed cautiously. This is because we need repeated data to confirm a trend is established. Taking this approach, and looking at the three-year averages, our assessment is that child poverty rates are broadly stable.
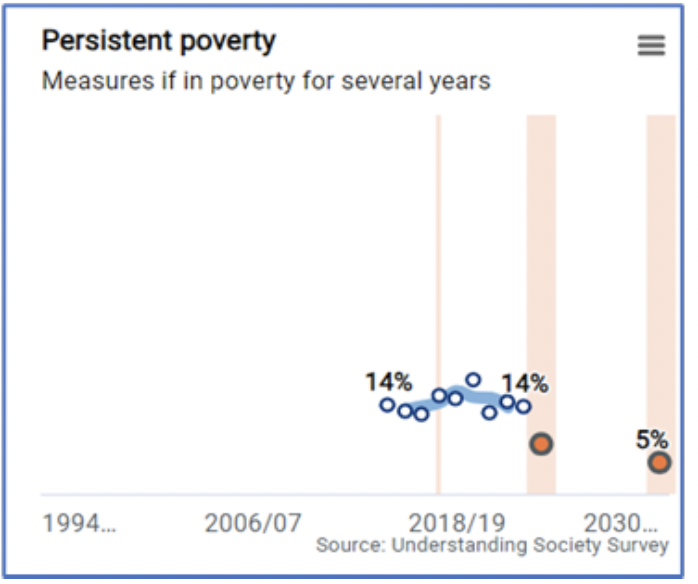
Persistent poverty statistics have been revised. Last year it appeared that persistent poverty was showing a slow upward trend. The most recent revision now shows a stable trend, with around 13-15% of children being in poverty for three out of the four last years.
This lack of progress towards lower poverty rates needs to be understood in the wider context of recent years. Scotland has been facing significant economic and societal changes, with research highlighting the impact of the COVID-19 pandemic, economic impacts of the war in Ukraine, and the cost of living crisis. All of these have an impact on wider society but will be most significant for low income families who have less resources available to face crises. Despite these difficult circumstances, analysis suggests that our policy package is helping families.
Impact modelling estimates that without our support package, relative poverty rates would have been 4 percentage points higher in 2021-22 with a projected impact of around 10 percentage points by 2024-25. This means that our policies are anticipated to keep around 100,000 children out of relative poverty in 2024-25.
This limited progress in poverty rate reduction needs to be read in the context of what policies were in place during the period that the statistics cover. March 2022 until March 2023 was a transitional period for the Scottish Child Payment, a key policy for reducing child poverty. Eligibility criteria and the award amount changed in November 2022. Statistics therefore do not yet show the full impact of the Scottish Child Payment. In the meantime, modelling estimated that the Scottish Child Payment could reduce the relative child poverty rate by 6 percentage points in 2024-25 relative to if the policy was not in place. This would represent keeping around 60,000 children out of relative poverty.
Trends for all child poverty targets are shown in Figure 1. The dots and labels show single-year estimates. Shaded areas show indicative 95% confidence intervals around single-year estimates. The lines show three-year averages.
Figure 1: Child Poverty targets
Child poverty rates amongst groups most at risk
There are some types of household which have a higher than average risk of being in poverty. We refer to these as ‘priority groups’. These are households with a disabled person, three or more children, a baby aged under 1, minority ethnic households, mothers aged under 25, and lone parent families.
The latest available child poverty rates continue to show that those in priority family groups are more at risk of being in poverty. The latest figures are shown in Table 1.
| Relative poverty | Absolute poverty | Low income and material deprivation | |
|---|---|---|---|
| All children | 24% | 21% | 10% |
| Lone parent household | 38% | 33% | 23% |
| Minority ethnic household | 43% | 38% | 13% |
| 3+ children in household | 38% | 35% | 18% |
| Disabled person in household | 27% | 23% | 18% |
| Baby aged under 1 in household (data from 2018-21) | 34% | 27% | 13% |
Source: Family Resources Survey
Persistent poverty data comes from the Understanding Society survey. It is not possible to update figures by priority family group due to small sample sizes. But considering the consistent greater risk of poverty for priority groups under other indicators, it is expected that persistent poverty will also be higher.
We continue to deepen our understanding of households most at risk of poverty. Beyond the experiences of priority groups that official statistics are able to identify, there is a wide range of evidence highlighting other disadvantaged groups who also face specific barriers. Many of these disadvantaged families face particularly complex circumstances because of multiple adversities, including trauma and marginalisation.
In order to strengthen our understanding of the complex experiences other groups face, we conducted an evidence review of the barriers other marginalised groups face to get out of poverty and evidence of what can work to support them. The review has been published in our latest focus report.
During the course of the Tackling Child Poverty Delivery Plans, we have published further details on poverty rates among priority groups over time and a summary evidence review of barriers and what works for these groups. A detailed report for each priority family group has also been published. These focus reports look at child poverty rates and progress in each of the three drivers of poverty, alongside wider evidence. Previously published reports include: minority ethnic families, lone parent families, families with a disabled adult or child, families with mothers aged 25 or under, and families with a baby. In addition, Public Health Scotland has published a focus report for families with three or more children.
The drivers of child poverty
In order to better understand changes in the target measures of child poverty, we look at the three drivers of poverty. That is: income from employment, cost of living, and income from social security and benefits in-kind. The measurement framework (which can be found in Annex A) provides a range of indicators for each of the drivers that can be tracked over time. In addition, the below summary of progress includes impact findings from evaluations of relevant policies.
To note that COVID-19 restrictions had an impact on the data collection of many national surveys. As such, some indicators on the measurement framework could not be updated during pandemic years (2020-22). Where the data is available and can be trusted to be reliable and robust, data and trends have been added.
Income from employment
In the 2022-23 annual progress report, the impact of multiple recent crises on low income households was already evident. Since then, at the turn of 2024, Scotland’s labour market has remained resilient despite slow GDP growth and inflationary pressures. The most recent figures show a decline in unemployment and inactivity alongside a rise in employment. However, there has been limited growth in earnings which may continue to perpetuate in-work poverty for some. Therefore, while there is room to expect improvements in the economy and in turn people’s lives, this will take some time to be reflected in the child poverty rates.
Specifically for child poverty, the measurement framework shows progress towards key indicators tracking income from employment.
There seems to be a slight upward trend in the proportion of parents who are undertaking paid work. Positively, it seems that they are undertaking paid work that matches their skills. We see this because the proportion of parents with degrees who are in low- or medium-skilled occupations has been decreasing for the past three years. Further, there continues to be an increase in the level of qualifications achieved by parents, which should translate into better paid jobs.
However, while we see an increase in the proportion of parents undertaking paid work, we also see that they appear to do so for fewer hours. This can lead to a drop in the total income that parents take home. At the same time, the average pay per hour has remained stable despite high levels of inflation. For parents, this can result in household budgets being squeezed. While there have been increases in the number of people being paid the real Living Wage or above, it is uncertain as to whether parents specifically have benefitted from this. Family Resources Survey (FRS) data did not record any increases in the proportion of workers with children earning on or above real Living Wage between 2012-15 and 2018-21.
Importantly, how are policies supporting progress towards increasing families’ income from employment? We have seen in this report the impact that policies are having for families. Indeed, the number of parents supported through No One Left Behind continues to increase year on year. A quarter of parents receiving support through No One Left Behind entered employment. It is still too early to assess whether employment has been sustained for parents, but early evaluation findings do show that the employability policies in place can have positive outcomes for parents. Policies in this space need to be at the necessary scale to have an impact on the 2030 targets.
Cost of living
The cost of living is the term used to refer to the prices of goods and services in the economy. Inflation refers to the rate of increase in these prices. While inflation has slowed throughout 2024, across a number of metrics (e.g. Consumer Price Index, CPI) the impact of this on households may not yet be seen in the data currently reported. This is because the statistics presented here look at the period 2022-23, a time frame where we saw inflation peaking at 11.1% (annual rate of CPI) in October 2022. The latest CPI rate for March 2024 was 3.2%[2] and the Office for Budget Responsibility forecasts[3] expect CPI inflation to reach the Bank of England’s 2% target by the second quarter of 2024.
We understand that low income families have relatively few resources to draw on when challenged, and that the additional support provided in Scotland can be a lifeline for many families.[4] In the 2022-23 annual progress report, we explained that price increases during the cost of living crisis impacted low income households more severely.[5] This position has not changed dramatically since and was in fact acutely evident in the data for this reporting year. The combined UK and Scottish Government packages of support for families have not entirely replaced rising costs and indicators show toughening conditions in some areas. Specifically, fuel prices peaked in Scotland during 2022, and high levels of inflation meant that prices of food and other essentials also increased significantly. This meant that:
- Many families had difficulty affording to heat their homes to the required standard. The percentage of households experiencing fuel poverty in 2022 remained high at 31% of all households and 27% for households with children. This represents around a 10 percentage-point increase from pre-pandemic levels (2019).
- Many families still experience food insecurity. Despite peaks in food inflation, food security rates were stable over the most recent period. The expansion of free school meals and the support during holidays should help mitigate against further increases.
- The proportion of household income spent on transport is higher for low income families with children. Equally, perceived affordability of transport is lower for low income families with children; around a third (34%) of low income families with children found it difficult to afford transport. The introduction of free bus travel for under 22s started in January 2022 and is anticipated to save families around £3,000 over the lifetime of a child.
- Financial health needs to be monitored closely. In the previous report we saw it worsening slightly with levels of debt increasing and access to affordable credit being lower.
There has been varied progress in terms of housing. The most recent data (2020-23) records a slight decrease in the proportion of household income spent on housing for low income families with children. In 2020-23, 17% of a low income household with children’s net income was spent on housing. This is the lowest level recorded for the past 10 years. There has also been progress in the proportion of children helped into affordable housing, with peak numbers of children supported (3,200 households with children have been helped into affordable housing in the year to March 2022). However, positive progress is not seen across the board. The number of children in temporary accommodation is at its peak. A steady increase started following the onset of the pandemic and has not slowed since. This is important, particularly for women in poverty. This is because within the most common reasons cited for being homeless is relationship breakdown, in some cases due to a violent household or abuse. When relationship breakdown happens, most often women still tend to be the ones assuming the care of the children and experience along with them the process of being homeless and moving into temporary accommodation.
Childcare availability continues to increase over time despite the measurement framework data not yet covering the period since the expansion of funded early learning and childcare (ELC) provision. Indeed, 97% of three and four year olds and 52% of eligible two year olds were estimated to be registered for funded ELC in 2023. Early evidence on the ELC expansion shows positive impacts for parents, both by reducing their cost of living and as an enabler to increase their income through employment. Evaluation of funding to test new models of school age childcare also found qualitative evidence that projects had contributed to parents being able to start, maintain or progress their career, and to improvements in parental health and wellbeing. Key factors necessary for ensuring that school-age childcare could support parental employment were having flexible timings and affordable services that made working a financially viable option for families. Flexible childcare options will be particularly important for women who still are more likely to take on the majority of the caring responsibilities at home and reduce their paid working hours to accommodate family demands.
While early evidence suggests positive outcomes relating to families’ financial circumstances, this was partially dependent on whether parents using subsidised places would otherwise have used paid-for childcare. It is anticipated that as the childcare policy evolves and is fully implemented, there will be positive impacts for low income families, although any direct contribution to the poverty rates is likely to take time to be evident.
Income from social security and benefits in-kind
Means-tested social security benefits are designed to help with living costs and often supplement the income that households receive from other sources, primarily employment. However, due to different circumstances some households may not receive any income from paid work and may rely entirely on benefit income to pay for living costs. As such, income from social security and benefits in-kind can play a significant role in supporting parents out of poverty.
Across various evaluations, we see the clear positive impact social security and benefits in-kind have on families. The Scottish Government publish annual estimates of benefit take-up rates. That is, the proportion of people eligible for benefits that go on to get them. These show that for the five family payments in particular (Scottish Child Payment, the three Best Start Grant payments and Best Start Foods), estimated take-up rates are high and indicate the majority of families (all living in low income households) eligible for these payments get them, directly ensuring that families have more income and contributing directly to reducing poverty. The latest take-up rate estimate for Scottish Child Payment for children aged under 6 was 95% in 2022-23, an increase from 87% the previous reporting year (2021-22).
We track the proportion of households with children who are eligible for Universal Credit. There has been a slight increase in eligibility in this year’s figures. This may reflect changes in other indicators such as the slight reductions in hourly pay and median hours worked for low income households with children, as well as the small reduction in the percentage of parents in secure work contracts. These changes may mean that a greater proportion of families are eligible for Universal Credit. However, the increase may also reflect the expansion of Universal Credit as those on legacy benefits continue to move across to the Universal Credit system.
We also track the real value of both out-of-work and in-work benefits. We see that there has been a decline over time in the real value of benefits, with the exception of the year the Universal Credit uplift was introduced (March 2020). The main reason for the declining trend in recent years is due to inflation decreasing the real value of the housing element of Universal Credit by rising faster than uplifts applied to the housing element.
Assessing cumulative impact of the policy package
We assess the cumulative impact of the policy package in two distinct ways. One, through economic modelling which allows us to estimate the impact that the package of policies can have on child poverty rates. Two, through qualitative assessment of how various policies are working together to foster system change. A summary of our learning in both areas is below.
The latest modelling estimates that in 2024-25, a package of nine Scottish Government policies will cumulatively reduce the relative child poverty rate by 10 percentage points, and the absolute child poverty rate by 7 percentage points, compared to if those policies were not in place. This would represent keeping 100,000 and 70,000 children out of poverty respectively. Note that these estimates are subject to multiple sources of uncertainty and may be sensitive to changes in the economic environment. Nonetheless, the modelling will continue to be a useful tool, particularly in the development of the final delivery plan to be published by the end of March 2026.
Importantly, we also need to understand how well policies are working together to drive the child poverty agenda. Alongside this report we are publishing learning from our evaluation of place based, system change initiatives. This is the baseline report in assessing progress towards system change in the context of child poverty. The findings highlight that there are early signs of positive developments and implementation. Initiatives at the implementation stage reported positive signs of changing structures and cultures, which were seen to be creating the building blocks for longer-lasting system change.
Given that system change initiatives take time to implement and as a result time to see impact, it is not possible to assess the impact of these initiatives on child poverty outcomes so far. As policies become more embedded, it will be important to consider the impacts on families accessing services, as well as any barriers they may experience. That is especially so in terms of how these vary by group including by priority families. The learning is gathered through evaluations of place based initiatives. Due to the challenges in evaluating initiatives seeking to change the system, it is likely to be difficult to directly attribute reductions in child poverty to system change initiatives. Even so, evaluations will set out the pathways by which interventions should impact on poverty outcomes and indicate the likely contribution to child poverty reduction.
Local action
Local Child Poverty Action Reports are jointly developed by Local Authorities and Territorial Health Boards to outline activities and commitments to reducing child poverty in local areas. The key points emerging from the available Year 5 reports covering the period April 2022 to March 2023 are:
- Strategic approach towards prevention. Many of the reports published showed an increased focus on preventative approaches to avoid families falling into poverty and to ensure improved outcomes for children in the longer term. Many cited links between employability and childcare, and work towards ensuring services are easily accessible, holistic and non-stigmatising so that they can be accessed by families at the earliest opportunity.
- Increased use of local and national evidence. Many local areas are reporting increasingly sophisticated use of local and national intelligence, both to understand their local context and the impact of their interventions. This is being achieved through a combination of developing their own data/evidence and also using national sources.
- Lived experience increasingly used, particularly including children and young people, for consulting on ideas and options in line with implementation of the United Nations Convention on the Rights of the Child (Incorporation) (Scotland) Act 2024. There is a need for ongoing consideration of how the voices of parents can be meaningfully reflected in decision making.
Contact
Email: TCPU@gov.scot
There is a problem
Thanks for your feedback