Publication - Research and analysis
Building standards - workforce data collection: analysis report 2023
Provides a national-level view of the challenges facing the building standards profession in relation to resourcing, development of competencies and levels of turnover.
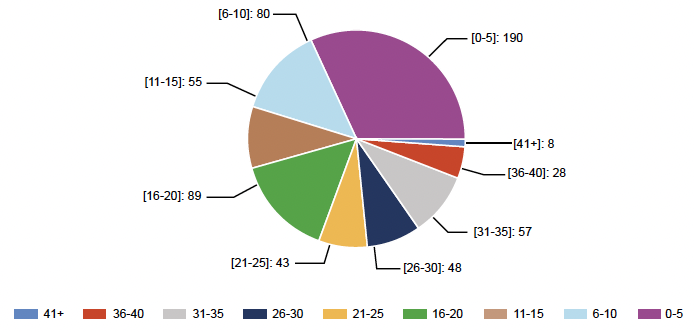
9.0 Length of Service
9.1. There is an increasing trend with 45% of the workforce having a length of service less than 10 years compared with 41% in 2022. See Table 5.
9.2. A third of the workforce 184 (31%) has a length of service over 21 years which as a percentage of the workforce remains the same as in 2022.
| Year Range | 2021 | 2022 | 2023 | Difference from 2022 (+/-) |
|---|---|---|---|---|
| 41+ | 9 | 7 | 8 | +1 |
| 36-40 | 32 | 28 | 28 | 0 |
| 31-35 | 62 | 62 | 57 | -5 |
| 26-30 | 46 | 41 | 48 | +7 |
| 21-25 | 48 | 45 | 43 | -2 |
| 16-20 | 92 | 90 | 89 | -1 |
| 11-15 | 64 | 58 | 55 | -3 |
| 6-10 | 68 | 71 | 80 | +9 |
| 0-5 | 148 | 157 | 190 | +33 |
| Total | 569 | 559 | 598 | +39 |
Contact
Email: buildingstandards@gov.scot
There is a problem
Thanks for your feedback