Children, young people and families outcomes framework - core wellbeing indicators: analysis
A national report presenting data from the set of 21 core wellbeing indicators which are part of Scotland’s Children, Young People and Families Outcomes Framework.
4. My wider world
The ‘My wider World’ side of the My World Triangle relates to how communities where children and young people grow up, and structural factors such as household income, employment opportunities, local resources, and housing, can have a significant impact on their wellbeing and the wellbeing of their families.
- Findings show substantial levels of economic hardship.
- In 2021-2022, 23% of children were living in relative poverty after housing costs. Child poverty appears stable after a recent gradual rise.
- On 31 March 2022, there were 8,635 children and young people living in temporary accommodation. This is a 17% increase on the figure from 2021 and follows a general upward trend.
- In 2021, 61% of children and young people under 16 lived in households that contained at least one person aged 16 to 64, where all individuals aged 16 and over were in employment.
- In 2021-2022, almost all (98%) of children and young people in P5 to S6 said that they had internet access at home, on a phone or another device.
- Looking at perceptions of their local area in 2021-2022, 66% of children and young people in P5 to S6 said that their area was a good place to live.
- 87% said that they felt safe when out in their local area always or most of the time
- Children and young people living in the most deprived areas and in large urban areas were substantially less likely to have positive perceptions than those from less deprived and rural areas.
- Primary school age children were more likely to think of their area as a good place to live, but less likely to feel safe.
- Those from African, Caribbean or Black backgrounds were more likely to have negative perceptions of their area.
4.1 Child Poverty
The child poverty indicator is the relative child poverty rate after housing costs. This is a widely recognised and used top line measure of child poverty.
This indicator relates to the Included, Nurtured, Safe, Healthy and Achieving outcomes.
In 2021/22, 23% of children were living in relative poverty after housing costs.
This is similar to previous years. Figure 4.1. shows the trend in child poverty rates over time. Single year figures are presented alongside a rolling three year average in order to reduce fluctuations from sampling variation and portray underlying trends more accurately. After a long fall between the late nineties and 2010-13, which slowed briefly just before the 2008/09 recession, child poverty rates were gradually rising again, but have stabilised in recent years.

Note: Dots and labels show single-year estimates; shaded areas show indicative 95% confidence intervals around the single-year estimates; lines show three-year averages.
A number of demographic groups, known as ‘priority family types’ have been identified as having particularly high child poverty rates. These figures are based on the 2019-2022 rolling average. These are:
- Households with a disabled person (28%)
- Households with three or more children (34%)
- Minority ethnic households (39%)
- Single parent households (38%)
Households where the youngest child is under one year old and where the mother is under 25 have also been previously identified as priority family types but could not be reported in 2019-2022 due to small sample sizes.
4.2 Housing security
The housing indicator is the number of children in temporary accommodation at 31 March. A child is defined as (a) anyone aged 15 years or less, and (b) anyone aged 16, 17 or 18 either receiving or about to begin full-time education or training, or unable to support themselves for some other reason (e.g. they have a learning disability) and are dependent on an adult household member. This was selected as the most upstream measure of housing security and the most suitable of housing measures available.
This indicator relates to the Included and Nurtured outcomes.
On 31 March 2023, there were 9,595 children living in temporary accommodation. This is a 9% increase on the figure from 2022 and follows a general upward trend from as shown in Figure 4.2. As a result of the pandemic, there was an increased demand on temporary accommodation given some households who were previously making informal arrangements (e.g. staying with friends) could no longer continue to do so and given settled accommodations were not available to move people out of temporary accommodation. The trend has continued given due to the backlog, and cost and supply issues of materials and tradespeople which resulted in a lack of settled accommodation.

No demographic information on the characteristics of children and families living in temporary accommodation is available.
4.3 Adult employment
The Office of National Statistics use three different categories for households including at least one adult aged 16-64 years. These are:
- number of working households where all adults are in employment.
- number of mixed households, where some adults are in employment and some not in employment.
- number of workless households where no adults are in employment.
The adult employment indicator is the percentage of all children under 16 who live in working households. This was included alongside the child poverty rate to give a fuller picture of economic wellbeing of families.
This indicator relates to the Included outcome.
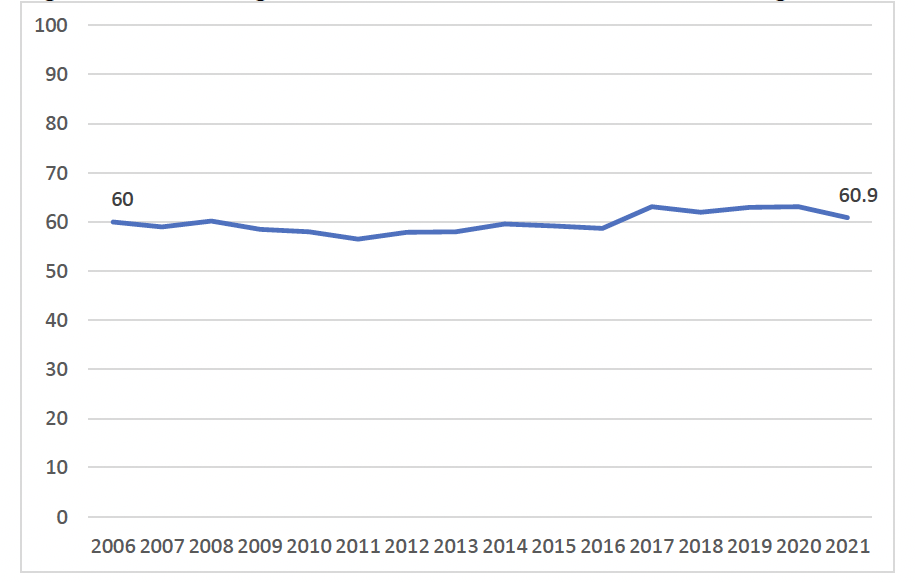
In 2021, it was estimated that 60.9% of children under 16 lived in working households.
As Figure 4.4 shows, the percentage of children living in working households decreased between 2006 and 2011 before increasing to 2017 and then remained constant until 2020.
No demographic information on the characteristics of children living in working households is available.
4.4 Digital inclusion
The digital inclusion indicator is the percentage of children and young people in P5 to S6 who have access to the internet at home or on a phone or another device. This indicator was prioritised as of high importance by children and young people themselves in engagement work reviewed. Please note that this indicator comes from the Health and Wellbeing Census and figures presented here are the aggregated results for those 16 local authority areas who collected data and are not weighted to population totals.
This indicator relates to the Included and Achieving outcomes.
In 2021-2022, 98% of children and young people in P5 to S6 said that they had internet access at home, on a phone or another device.
In terms of socio-demographic differences, the percentage of children who said that they had internet access at home, on a phone or another device was lowest in P5 (95%), and 99% in all secondary school stages.
Percentages were roughly the same by sex, area deprivation, rurality, ethnicity, additional support needs, caring responsibilities and long term health condition.
The very high levels of internet access, and lack of variation between demographic groups limits the usefulness of this indicator. An indicator looking at quality of internet access, e.g. on own vs shared devices, or duration of internet access may be more meaningful.
4.5 Neighbourhood satisfaction
The neighbourhood satisfaction indicator is the percentage of children and young people in P5 to S6 who agree that their local area is a good place to live. This was selected as the most suitable measure of general neighbourhood quality relevant to all children and young people. It may be influenced by various environment and community factors. Please note that this indicator comes from the Health and Wellbeing Census and figures presented here are the aggregated results of the 16 local authority areas who collected data, and so are not weighted to population totals.
This indicator relates to the Included, Respected and Safe outcomes.
In 2021-2022, 66% of children and young people in P5 to S6 said that their area was a good place to live. 29% said their area was ok, and four percent said it was not good.
The main socio-demographic differences within this variable were:
- The percentage of respondents describing their area as a good place to live decreased substantially by stage. It was highest in P5 (70%) and lowest in S5 (59%).
- Boys were slightly more likely to describe their area as a good place to live (67%) than girls (64%).
- There were very large and consistent differences in neighbourhood satisfaction by area deprivation. 47% of respondents living in the 20% most deprived areas described them as a good place to live, compared with 82% in the 20% least deprived areas.
- Respondents living in rural areas were more likely to describe their area as a good place to live (75% in accessible rural areas and 74% in remote rural areas) than those living in urban areas (62% in large urban areas and 64% in other urban areas).
- Looking at ethnicity, respondents least likely to describe their area as a good place to live were from Caribbean or Black – other (39%) and African other (45%) groups. The groups most likely to describe their area as a good place to live were from White – Irish (75%) and Asian – Indian (71%) groups.
- Young people with a long term health condition were substantially less likely to describe their area as a good place to live (58%) than others (70%) and similarly, those with additional support needs were less likely to do so (62%) than others (66%).
- Respondents with caring responsibilities were less likely to describe their area as a good place to live (59%) than others (67%).
4.6 Neighbourhood safety
The neighbourhood safety indicator is the percentage of children and young people in P5 to S6 who say they feel safe when out in their local area always or most of the time. This was included as a key measure of the characteristics of the areas families live in. Please note that this indicator comes from the Health and Wellbeing Census and figures presented here are the aggregated results of the 16 local authority areas who collected data, and so are not weighted to population totals
This indicator relates to the Safe and Included outcomes.
In 2021-2022, 87% of children and young people in P5 to S6 said that they felt safe when out in their local area always or most of the time. Nine percent said they felt sometimes safe, and two percent said they felt rarely or never safe.
The main socio-demographic differences within this variable were:
- The percentage saying they felt safe always or most of the time was lowest in P5 (84%) and highest in S1 and S2 (89%).
- The percentage who said they felt safe in their area increased as area deprivation decreased, from 78% in the 20% most deprived areas to 93% in the 20% least deprived areas.
- In terms of rurality, the percentage of children and young people who felt safe was lowest in large urban areas (85%) and highest in accessible and remote rural areas (91%).
- Looking at ethnicity, the percentage who said they felt safe in their area was lowest within the African – other (79%) and African – Scottish or British (81%) groups. It was highest in the White – Irish (91%); White – other British (89%) and Asian – Indian (89%) groups.
- Young people with a long term health condition were less likely to say they feel safe in their local area (90%) than others (81%) and similarly, those with additional support needs were slightly less likely to feel safe (83%) than others (87%).
- Respondents with caring responsibilities were less likely to say they feel safe in their local area (84%) than others (91%).
The percentage of boys and girls who said they felt safe in their neighbourhood always or most of the time was roughly similar.
Contact
Email: socialresearch@gov.scot
There is a problem
Thanks for your feedback