Council tax collection statistics: 2016-2017
Council tax collection rates for each local authority for billing year 2016 to 2017 and all previous years.
3. Further context around Council Tax
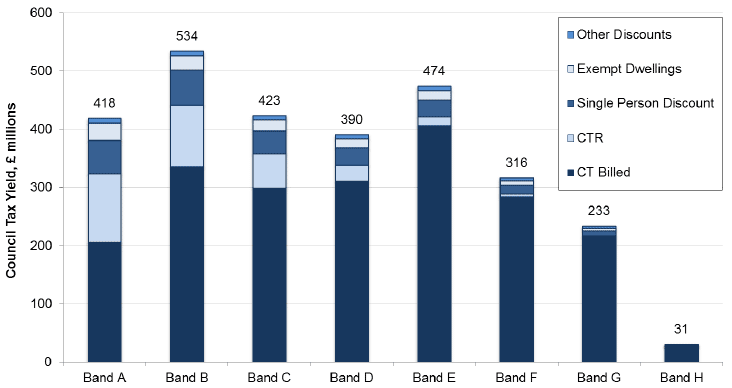
Chart 4: Council Tax Potential Yield (£ millions), 2015-16

Source: Scottish Local Government Financial Statistics 2015-16, http://www.gov.scot/Publications/2017/02/1688
Each Council Tax bill is calculated by applying the appropriate band rate for the local authority, then applying any discounts, exemptions and reductions. Chart 4 illustrates the breakdown of the gross Council Tax potential yield into Council Tax billed and the amounts not billed due to Council Tax Reduction ( CTR), discounts and exemptions. This publication is concerned with the Council Tax billed each year, which is currently approximately £2.1 billion.
Table 6: Local Authority Revenue Funding, 2015-16
| Income Source | Funding (£000s) | Proportion |
|---|---|---|
| General Revenue Funding | 7,146,854 | 59.5% |
| Non-Domestic Rates | 2,791,322 | 23.3% |
| Council Tax | 2,054,823 | 17.1% |
| Other Sources | 9,727 | 0.1% |
| Total Funding | 12,002,726 | 100.0% |
Source: Scottish Local Government Financial Statistics 2015-16, http://www.gov.scot/Publications/2017/02/1688
In 2015-16, the latest audited figures, Council Tax income (for all billing years) amounted to £2.055 billion. This accounted for 17.1%, just over one-sixth, of total local authority revenue funding (£12.003 billion).
Contact
There is a problem
Thanks for your feedback