Council tax reduction in Scotland: April to June 2019
Quarterly statistics on Council Tax Reduction (CTR) scheme, which reduces council tax liability of lower income households in Scotland.
Council Tax Reduction in Scotland, April to June 2019
This publication provides statistics on the Council Tax Reduction (CTR) scheme, which reduces the Council Tax (CT) liability of lower income households in Scotland. A CTR ‘recipient’ can be a single person or a couple, with or without children, since CT is charged on a per-dwelling basis, rather than to individuals.
The statistics are based on data extracts from local authorities, and cover the time period April to June 2019.
Key Points
- There were 472,640 CTR recipients in Scotland in June 2019.
- The total weekly income forgone by local authorities on CTR in June 2019 was £6.6 million.
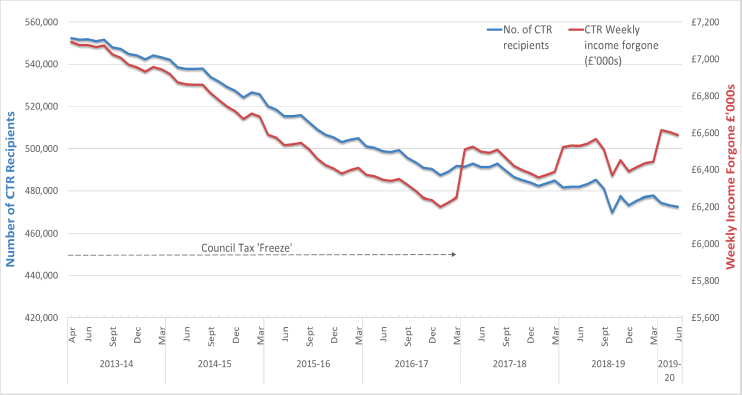
- There were 79,740 fewer CTR recipients in Scotland in June 2019 than at the beginning of the scheme in April 2013. This is a decline of 14.4 per cent. The fall in recipients is gradual, but CT and CTR reforms and increases in CT annually since April 2017 has resulted in increases in the total weekly CTR awarded (shown in Chart 1 below).
Chart 1: CTR Recipients and Weekly Income Forgone in Scotland, April 2013 to June 2019

1. CTR Recipients
Chart 1 (page 1) shows the CTR caseload in Scotland decreasing marginally between April and June 2019 in line with most years. Over this period, the CTR caseload in Scotland decreased by 0.4 per cent to 472,640 in June 2019. This is after the roll out of Universal Credit (UC) to several large local authorities including Glasgow City, City of Edinburgh and Aberdeen City from September 2018 which is likely to have caused the fluctuations seen in the number of CTR cases towards the end of 2018. As the Department for Work and Pensions begins to move people from their current benefits to UC, this may result in future fluctuations in the number of CTR recipients.
The number of CTR recipients for each local authority in April to June 2019 is shown in Table 1 below. Most local authorities recorded a decrease in CTR recipients (22 out of 32 local authorities), with the largest decrease seen in the Scottish Borders (-1.4 per cent, based on unrounded figures) over this period.
Table 1: CTR Recipients by Local Authority, April to June 20191, 2
| Apr-19 | May-19 | Jun-19 | |
|---|---|---|---|
| SCOTLAND | 474,420 | 473,450 | 472,640 |
| Aberdeen City | 13,760 | 13,690 | 13,630 |
| Aberdeenshire | 11,680 | 11,640 | 11,680 |
| Angus | 8,600 | 8,650 | 8,670 |
| Argyll and Bute | 6,760 | 6,730 | 6,710 |
| City of Edinburgh | 33,260 | 33,360 | 33,080 |
| Clackmannanshire | 5,110 | 5,090 | 5,040 |
| Dumfries and Galloway | 13,250 | 13,290 | 13,190 |
| Dundee City | 17,790 | 17,650 | 17,930 |
| East Ayrshire | 13,100 | 13,110 | 12,960 |
| East Dunbartonshire | 5,500 | 5,450 | 5,480 |
| East Lothian | 6,830 | 6,790 | 6,790 |
| East Renfrewshire | 4,300 | 4,280 | 4,260 |
| Falkirk | 12,840 | 12,850 | 12,830 |
| Fife | 30,950 | 30,730 | 30,560 |
| Glasgow City | 87,560 | 87,600 | 87,660 |
| Highland | 17,030 | 16,980 | 16,860 |
| Inverclyde | 9,720 | 9,750 | 9,680 |
| Midlothian | 6,270 | 6,250 | 6,220 |
| Moray | 5,530 | 5,530 | 5,550 |
| Na h-Eileanan Siar | 2,160 | 2,140 | 2,130 |
| North Ayrshire | 16,220 | 16,330 | 16,470 |
| North Lanarkshire | 36,200 | 35,930 | 35,720 |
| Orkney Islands | 1,220 | 1,210 | 1,210 |
| Perth and Kinross | 8,440 | 8,430 | 8,370 |
| Renfrewshire | 17,950 | 17,950 | 18,040 |
| Scottish Borders | 8,390 | 8,350 | 8,280 |
| Shetland Islands | 1,070 | 1,060 | 1,080 |
| South Ayrshire | 10,720 | 10,730 | 10,730 |
| South Lanarkshire | 30,230 | 30,070 | 30,000 |
| Stirling | 5,460 | 5,450 | 5,450 |
| West Dunbartonshire | 11,610 | 11,650 | 11,670 |
| West Lothian | 14,910 | 14,730 | 14,710 |
Notes:
1 Recipients are as at monthly count date. See Methodology Notes, Section 2 for more details. Available at
2 Figures are rounded to the nearest 10. Components may not sum to total due to rounding.
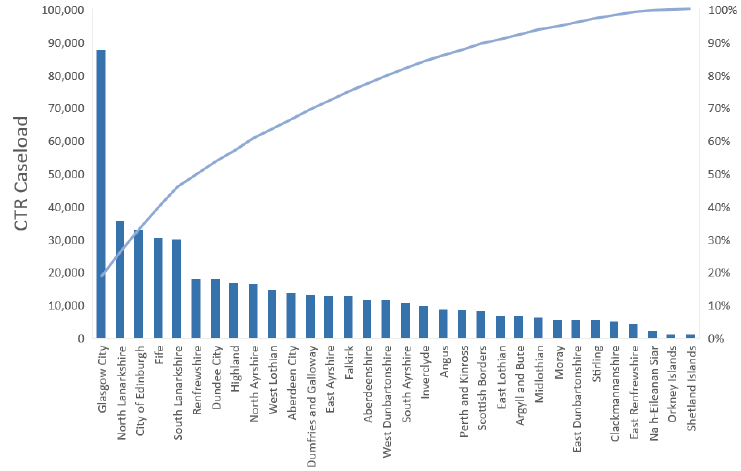
Chart 2 below shows the number of CTR recipients by local authority for June 2019 in descending order, with the cumulative total recipients represented by the line. It can be seen that Glasgow City accounted for almost one fifth of all recipients in Scotland compared to the Shetland Islands (accounting for 0.2 per cent). The five local authorities with the highest numbers of CTR recipients accounted for almost half (46 per cent) of the total number of CTR recipients in Scotland in June 2019. These five local authorities are:
- Glasgow City accounting for 19 per cent (87,660 recipients);
- North Lanarkshire accounting for 8 per cent (35,720 recipients);
- City of Edinburgh accounting for 7 per cent (33,080 recipients);
- Fife accounting for 6 per cent (30,560 recipients); and
- South Lanarkshire accounting for 6 per cent (30,000 recipients).
Chart 2: CTR Recipients by Local Authority, June 2019

2. Weekly Income Forgone
The total weekly income forgone for Scotland was £6.588 million in June 2019, a marginal decrease of 0.4 per cent compared to April 2019. A breakdown of the total weekly income forgone by each local authority in April, May and June 2019 is shown in Table 2 below.
The weekly income forgone shows a fluctuation in April 2019 (£6.615 million) compared to £6.443 million reported in March 2019 – a rise of approximately 3 per cent overall. This is a result of the increase in CT applied by all local authorities at the start of the current financial year (capped at 4.79 per cent for each local authority in 2019-20). Although all local authorities raised their CT in 2019-20, not all local authorities raised it by the maximum amount.
The rise in weekly income forgone in April 2019 is similar to the upward trends seen in April 2017 and April 2018. As the figures are monthly, there is usually a rise in April of each year in comparison to the previous month (March) when council tax increases (decided by local authorities) take effect, with a corresponding impact on the levels of weekly income forgone. Prior to April 2017, there was a 9 year CT ‘freeze’ between 2008-09 and 2016-17.
It can be seen that Glasgow City accounted for one fifth (20 per cent) of the total weekly income forgone for Scotland followed by City of Edinburgh (7 per cent) and North Lanarkshire (7 per cent) in June 2019.
Table 2: Weekly Income Forgone (£’000s) by Local Authority, April to June 20191,2,3
| Apr-19 | May-19 | Jun-19 | |
|---|---|---|---|
| SCOTLAND | 6,614.7 | 6,604.3 | 6,587.7 |
| Aberdeen City | 197.9 | 197.0 | 195.7 |
| Aberdeenshire | 161.4 | 160.4 | 160.5 |
| Angus | 105.3 | 105.7 | 106.1 |
| Argyll and Bute | 106.3 | 105.8 | 104.7 |
| City of Edinburgh | 491.5 | 493.1 | 488.8 |
| Clackmannanshire | 68.1 | 67.9 | 67.4 |
| Dumfries and Galloway | 173.9 | 174.6 | 173.3 |
| Dundee City | 236.4 | 235.0 | 238.0 |
| East Ayrshire | 178.0 | 177.8 | 175.3 |
| East Dunbartonshire | 90.8 | 90.0 | 90.3 |
| East Lothian | 100.1 | 99.2 | 98.8 |
| East Renfrewshire | 70.1 | 70.0 | 69.6 |
| Falkirk | 156.9 | 157.1 | 156.9 |
| Fife | 404.8 | 401.8 | 399.5 |
| Glasgow City | 1,336.2 | 1,338.4 | 1,337.9 |
| Highland | 240.8 | 239.9 | 238.2 |
| Inverclyde | 130.5 | 130.7 | 129.8 |
| Midlothian | 97.0 | 96.5 | 96.0 |
| Moray | 74.2 | 74.2 | 74.2 |
| Na h-Eileanan an Iar | 26.7 | 26.4 | 26.3 |
| North Ayrshire | 223.6 | 224.4 | 226.2 |
| North Lanarkshire | 448.6 | 446.0 | 444.1 |
| Orkney Islands | 15.6 | 15.5 | 15.3 |
| Perth and Kinross | 122.8 | 122.9 | 122.1 |
| Renfrewshire | 252.1 | 251.9 | 252.7 |
| Scottish Borders | 106.0 | 105.7 | 104.6 |
| Shetland Islands | 13.4 | 13.3 | 13.4 |
| South Ayrshire | 160.6 | 160.9 | 161.0 |
| South Lanarkshire | 384.1 | 382.4 | 381.2 |
| Stirling | 80.3 | 80.4 | 80.1 |
| West Dunbartonshire | 166.0 | 166.7 | 167.1 |
| West Lothian | 194.8 | 192.7 | 192.5 |
Notes:
1 Recipients are as at monthly count date. See Methodology Notes, Section 2 for more details. Available at
2 Weekly income forgone estimates are based on ‘number of recipients multiplied by average weekly reduction’ for each local authority and benefit type for the given month.
3 Figures are rounded to the nearest £100. Components may not sum to total due to rounding.
An Official Statistics publication for Scotland
Official and National Statistics are produced to high professional standards set out in the Code of Practice for Official Statistics. Both undergo regular quality assurance reviews to ensure that they meet customer needs and are produced free from any political interference.
Correspondence and Enquiries
For enquiries about this publication, please contact:
Eddie Chan
Council Tax Analysis
Local Government and Analytical Services Division
Telephone: (0131) 244 7192
E-mail: eddie.chan@gov.scot
For general enquiries about Scottish Government statistics, please contact:
Office of the Chief Statistician
Telephone: (0131) 244 0442
E-mail: statistics.enquiries@gov.scot
How to access background or source data
The data collected for this statistical bulletin:
☐ are available in more detail through Scottish Neighbourhood Statistics
☐ are available via an alternative route
☒ may be made available on request, subject to consideration of legal and ethical factors. Please contact eddie.chan@gov.scot for further information.
☐ cannot be made available by Scottish Government for further analysis as Scottish Government is not the data controller
Complaints and Suggestions
If you are not satisfied with our service or have any comments or suggestions, please write to: The Chief Statistician
GR, St. Andrew’s House
Edinburgh
EH1 3DG
Telephone: (0131) 244 0302
Email: statistics.enquiries@gov.scot
If you would like to be consulted about statistical collections or receive notification of publications, please register your interest at www.gov.scot/scotstat. Details of forthcoming publications can be found at www.gov.scot/statistics.
Contact
Email: eddie.chan@gov.scot
There is a problem
Thanks for your feedback