Council Tax reduction in Scotland: July to September 2018
Quarterly statistics on the CTR scheme. The report shows the number of recipients and weekly income foregone by local authorities.
Council Tax Reduction in Scotland, July to September 2018
This publication provides statistics on the Council Tax Reduction (CTR) scheme, which reduces the Council Tax liability of low income households in Scotland. A CTR 'recipient' can be a single person or a couple, with or without children, since Council Tax is charged on a per-dwelling basis, rather than to individuals.
The statistics are based on data extracts from local authorities, and cover the time period July to September 2018.
Key Points
- There were 481,100 CTR recipients in September 2018.
- The total weekly income foregone by local authorities on CTR in September 2018 was £6.5 million.
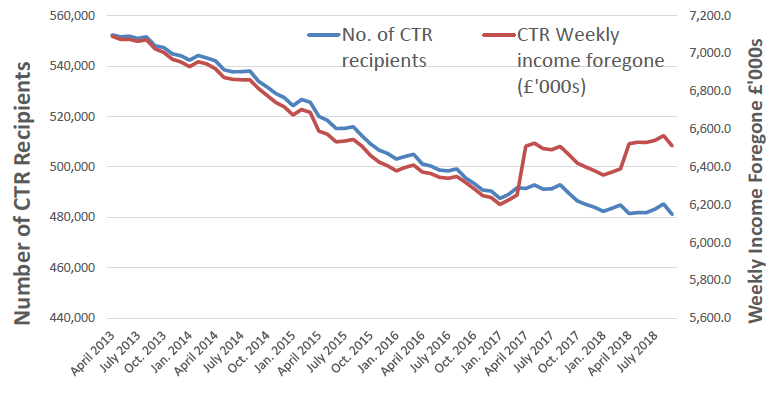
- There were 71,280 fewer CTR recipients in September 2018 than at the beginning of the scheme in April 2013. This is a decline of 12.9 per cent. The fall in recipients is gradual, but Council Tax reforms and increases in April 2017 and further increases in 2018 resulted in increases in the total weekly CTR awarded.
Chart 1: CTR recipients and Income Foregone, April 2013 to September 2018

The number of CTR recipients for each local authority in July to September 2018 is shown in Table 1.
Table 1: CTR Recipients by Local Authority, July to September 2018 1, 2
| Jul-18 | Aug-18 | Sep-18 | |
|---|---|---|---|
| Scotland | 483,250 | 485,310 | 481,100 |
| Aberdeen City | 14,150 | 14,160 | 14,110 |
| Aberdeenshire | 11,370 | 11,340 | 11,390 |
| Angus | 8,790 | 8,750 | 8,810 |
| Argyll and Bute | 6,760 | 6,770 | 6,750 |
| Clackmannanshire | 4,970 | 5,050 | 5,010 |
| Dumfries and Galloway | 13,350 | 13,380 | 13,250 |
| Dundee City | 17,900 | 17,980 | 17,880 |
| East Ayrshire | 13,170 | 13,210 | 13,170 |
| East Dunbartonshire | 5,270 | 5,230 | 5,200 |
| East Lothian | 6,940 | 6,950 | 6,910 |
| East Renfrewshire | 4,470 | 4,480 | 4,410 |
| Edinburgh, City of | 34,180 | 33,940 | 33,700 |
| Eilean Siar | 2,190 | 2,190 | 2,200 |
| Falkirk | 13,200 | 13,240 | 13,220 |
| Fife | 32,110 | 32,150 | 31,960 |
| Glasgow City | 89,160 | 89,480 | 88,790 |
| Highland | 17,420 | 18,580 | 17,240 |
| Inverclyde | 9,860 | 9,850 | 9,780 |
| Midlothian | 6,490 | 6,520 | 6,510 |
| Moray | 5,770 | 5,750 | 5,730 |
| North Ayrshire | 17,090 | 17,170 | 17,080 |
| North Lanarkshire | 36,440 | 36,790 | 36,480 |
| Orkney Islands | 1,190 | 1,200 | 1,190 |
| Perth and Kinross | 8,740 | 8,790 | 8,720 |
| Renfrewshire | 18,240 | 18,300 | 18,150 |
| Scottish Borders | 8,450 | 8,400 | 8,280 |
| Shetland Islands | 1,050 | 1,050 | 1,050 |
| South Ayrshire | 11,110 | 11,110 | 11,020 |
| South Lanarkshire | 30,630 | 30,640 | 30,400 |
| Stirling | 5,570 | 5,600 | 5,590 |
| West Dunbartonshire | 12,310 | 12,340 | 12,230 |
| West Lothian | 14,910 | 14,930 | 14,900 |
Notes:
1. Recipients are as at monthly count date. See Methodology Notes, Section 2 for more details. Available at
http://www.gov.scot/Topics/Statistics/Browse/Local-Government-Finance/Methodology/Ctaxreductionmethod
2. Figures are rounded to the nearest 10. Components may not sum to total due to rounding.
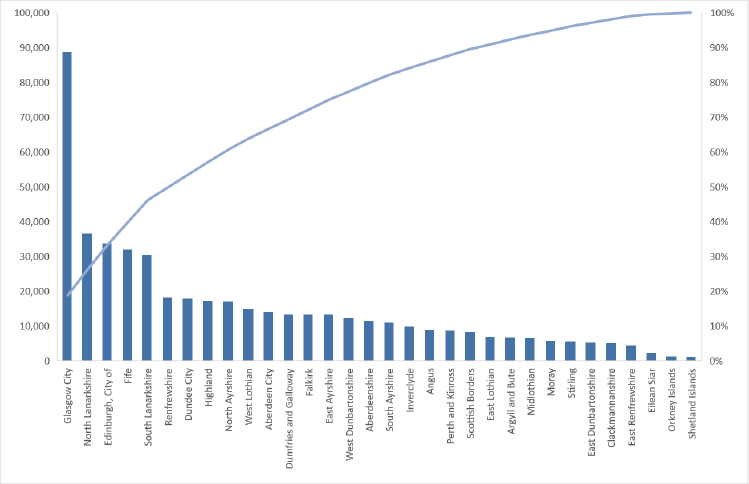
Chart 2 shows the number of CTR recipients by local authority for September 2018 in descending order, with the cumulative total of recipients represented by the line. It can be seen that the five local authorities with the highest numbers of CTR recipients accounted for almost half (46 per cent) of the total for Scotland in September 2018. The five local authorities are
- Glasgow City with over 18 per cent (88,790) of the total;
- North Lanarkshire, accounting for 8 per cent (36,480 recipients);
- Edinburgh City and Fife, with 7 per cent (33,700 and 31,960 recipients respectively); and
- South Lanarkshire, 6 per cent each (30,400 recipients).
Chart 2: CTR recipients by Local Authority, September 2018.

The total weekly income foregone for each local authority in July, August and September 2018 is shown in Table 2. The total for Scotland was £6.5 million in September 2018.
Table 2: Weekly Income Foregone by Local Authority, July to September 2018.1,2,3
| Jul-18 | Aug-18 | Sep-18 | |
|---|---|---|---|
| Scotland | 6,540.4 | 6,565.7 | 6,510.7 |
| Aberdeen City | 195.6 | 195.4 | 195.2 |
| Aberdeenshire | 154.1 | 153.9 | 154.7 |
| Angus | 105.1 | 105.0 | 105.4 |
| Argyll and Bute | 102.4 | 102.5 | 102.1 |
| Clackmannanshire | 65.0 | 66.0 | 65.6 |
| Dumfries and Galloway | 169.0 | 169.0 | 167.8 |
| Dundee City | 236.1 | 236.7 | 235.3 |
| East Ayrshire | 172.9 | 173.5 | 172.8 |
| East Dunbartonshire | 84.3 | 83.6 | 83.6 |
| East Lothian | 96.4 | 96.5 | 96.2 |
| East Renfrewshire | 71.4 | 71.4 | 70.3 |
| Edinburgh, City of | 492.5 | 489.8 | 486.7 |
| Eilean Siar | 26.1 | 26.0 | 26.0 |
| Falkirk | 157.6 | 158.1 | 157.8 |
| Fife | 408.5 | 409.3 | 406.3 |
| Glasgow City | 1,324.0 | 1,327.9 | 1,319.2 |
| Highland | 240.6 | 255.8 | 236.3 |
| Inverclyde | 126.4 | 126.4 | 125.5 |
| Midlothian | 96.9 | 97.2 | 96.8 |
| Moray | 74.2 | 73.9 | 73.5 |
| North Ayrshire | 224.7 | 225.5 | 224.5 |
| North Lanarkshire | 442.3 | 446.1 | 442.5 |
| Orkney Islands | 14.5 | 14.6 | 14.6 |
| Perth and Kinross | 122.8 | 123.6 | 122.7 |
| Renfrewshire | 245.0 | 245.9 | 244.2 |
| Scottish Borders | 103.9 | 103.3 | 101.9 |
| Shetland Islands | 12.8 | 12.9 | 13.0 |
| South Ayrshire | 159.7 | 159.7 | 159.0 |
| South Lanarkshire | 380.8 | 380.7 | 376.9 |
| Stirling | 78.4 | 78.7 | 79.0 |
| West Dunbartonshire | 170.1 | 170.4 | 169.1 |
| West Lothian | 186.4 | 186.5 | 186.3 |
Notes:
1. Recipients are as at monthly count date. See Methodology Notes, Section 2 for more details. Available at
http://www.gov.scot/Topics/Statistics/Browse/Local-Government-Finance/Methodology/Ctaxreductionmethod
2. Weekly income foregone estimates are based on 'number of recipients multiplied by average weekly reduction' for each local authority and benefit type for the given month.
3. Figures are rounded to the nearest £100. Components may not sum to total due to rounding.
Contact
Email: Robin Bennie
There is a problem
Thanks for your feedback