Cultural engagement in Scotland: what is it and why does it matter?
This report provides evidence on cultural engagement in Scotland from 2019 - 2024. It draws on a range of data, from both the Scottish Household Survey and qualitative research, to explore attitudes and behaviours for different people and places across Scotland.
Cultural engagement in Scotland 2022 - what do national trends tell us?[9]
Cultural engagement
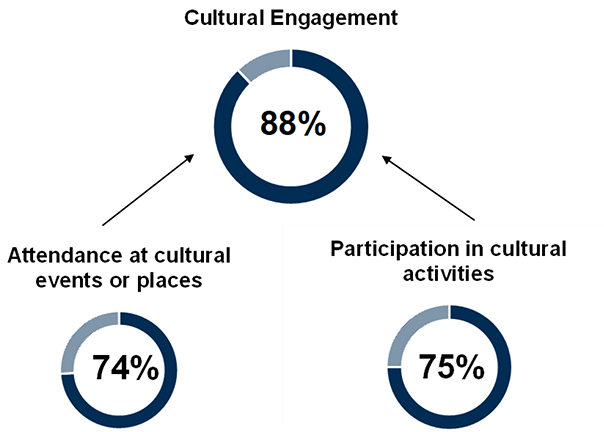
Cultural engagement in Scotland is high. [10] In 2022, just under nine in ten (88%) adults were culturally engaged, either having attended or visited a cultural event or place or having participated in a cultural activity in the last 12 months (Figure 1).

Percentage of adults culturally engaged in the last 12 months[11] 2022, Scotland
Attendance at cultural events or places of culture
In 2022, 74% of adults attended a cultural event or place of culture in the last 12 months
When cinema was excluded, attendance was lower at 65%
Cinema was the most common event or place to attend: 49% of adults went to the cinema at least once in the last 12 months
Over a quarter had not attended any cultural event or place in the last 12 months
Those who visited the library did so most frequently:
- 16% visited at least once a week
- 35% visited less often than once a week, but at least once a month
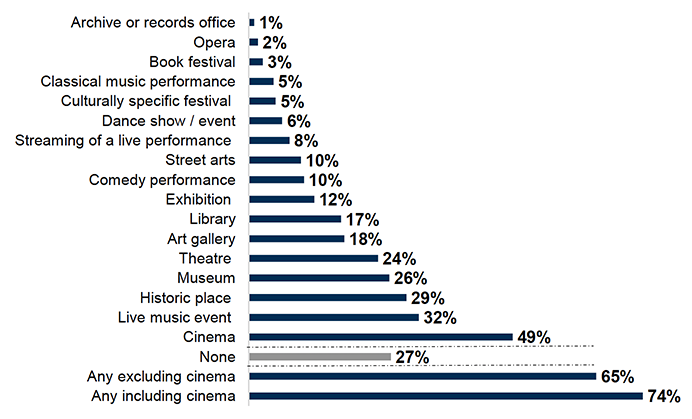
Figure 2 shows that almost half of respondents (49%) had been to the cinema in the last 12 months making this the most common type of cultural attendance. The next most common types of cultural attendance were attendance at live music events (32%) and visits to historic places (29%), followed by museums (26%) and theatres (24%).
Whilst attendance is widespread, it is not uniform and there are several events or places that very small percentages of the population attend. For example, 2022 data shows the lowest levels of attendance from the list provided were at archive or record offices, opera and book festivals (one and three percent respectively). Over a quarter of adults (27%) had not attended or visited a cultural event or place of culture in the last 12 months.

Percentage of adults who attended individual cultural events or visited places of culture in the last 12 months, 2022, Scotland
In 2022, those who visited the library did so most frequently compared to the frequency of those attending other cultural events or visiting other places of culture. Sixteen percent had visited a library at least once a week, and over one third of adults had visited less often than once a week, but at least once a month (35%) (Table 1).
Fourteen percent of respondents who had attended the cinema or streamed a live performance within the past 12 months went or did so at least once a month. The vast majority of those who had attended cultural events or had visited places of culture did so less often than once a month but at least once within the last 12 months (Table 1).
Table 1 : Adults visited the library the most frequently in the last 12 months with sixteen percent having done so at least once a week and thirty-five percent visited less often than once a week, but at least once a month
Frequency of attendance at individual cultural events and visiting places of culture in the last 12 months, 2022, Scotland
| Event or place | At least once a week | At least once a month | At least once a year |
|---|---|---|---|
| Cinema | 2% | 14% | 84% |
| Library (including mobile and online) | 16% | 35% | 49% |
| Live music event | 1% | 9% | 90% |
| Theatre | 0% | 4% | 96% |
| Dance show / event | 0% | 7% | 91% |
| Historic place | 2% | 11% | 87% |
| Museum | 1% | 7% | 92% |
| Art gallery | 0% | 7% | 93% |
| Exhibition | 0% | 5% | 94% |
| Street arts | 1% | 3% | 95% |
| Culturally specific festival | 1% | 2% | 97% |
| Book festival | 1% | 4% | 94% |
| Archive or records office | 4% | 12% | 79% |
| Streaming of a live performance | 5% | 14% | 78% |
| Classical music performance | 1% | 6% | 92% |
| Opera | 1% | 1% | 98% |
| Comedy performance | 0% | 4% | 96% |
Participation in cultural activities
In 2022, 3 in 4 adults (75%) participated in a cultural activity in the last 12 months.
When reading was excluded, participation was lower at 51%
Reading was the most common activity to participate in: 64% of adults had read at least once in the last 12 months.
1 in 4 (25%) had not attended any cultural event or place in the last 12 months.
Those who read books, poetry or graphic novels or comics for pleasure did so most frequently:
- 78% did so at least once a week
- Further 13% read less often than once a week, but at least once a month
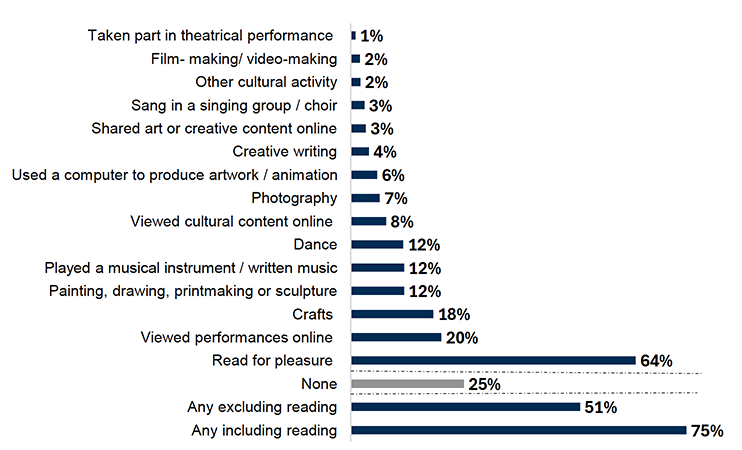
Figure 3 shows levels of participation by adults in specific cultural activities in the last 12 months for 2022 data. Reading books, poetry or graphic novels or comics for pleasure was by far the most common cultural activity to participate in, with 64% of respondents saying that they had done this in the last 12 months. The next most popular activity was viewing performances online (20%), followed by crafts (18%).
Similar to attendance, participation was widespread but not uniform and there were several activities that very small percentages of the population participated in. Participation levels in all other cultural activities were 12% or less. One in four people (25%) had not participated in any cultural activity in the last 12 months.

Percentage of adults who participated in individual cultural activities in the last 12 months, 2022, Scotland
2022 data shows that those who read a book for pleasure participated in the cultural activity the most frequently (Table 2). Of those who read books, poetry or graphic novels or comics for pleasure, 78% did so at least once a week, and a further 13% read less often than once a week, but at least once a month. Sixty percent of those who sang in a choir or singing group, did so at least once a week. Fifty-seven percent of those who played a musical instrument or wrote music did so at least once a week.
Respondents participated in cultural activities more frequently than they attended or visited cultural events or places of culture. Sixteen percent attended a library at least once a week (Table 1) but, apart from this, attendance at cultural events at least once a week was low. Participation in cultural activities at least once a week, however, ranged from 15% to 78% (Table 2).
Table 2: Reading books, poetry or graphic novels or comics for pleasure is the cultural activity most frequently participated in the last 12 months
Frequency of participation in individual cultural activities in the last 12 months, 2022, Scotland
| Activity | At least once a week | At least once a month | At least once a year |
|---|---|---|---|
| Read books, poetry or graphic novels / comics for pleasure | 78% | 13% | 9% |
| Dance, either for fitness or not for fitness | 48% | 26% | 25% |
| Played a musical instrument or written music | 57% | 24% | 19% |
| Taken part in a theatrical performance | 15% | 24% | 61% |
| Sang in a singing group or choir | 60% | 22% | 18% |
| Painting, drawing, printmaking or sculpture | 42% | 33% | 25% |
| Photography as an artistic activity (not family or holiday 'snaps') | 35% | 37% | 28% |
| Film- making/ video-making as an artistic activity | 19% | 28% | 52% |
| Used a computer to produce artwork or animation | 34% | 34% | 32% |
| Crafts | 51% | 28% | 21% |
| Creative writing - stories, books, comics, plays or poetry | 40% | 28% | 30% |
| Viewed performances (e.g. music or dance) online | 43% | 28% | 28% |
| Viewed cultural content online | 30% | 28% | 41% |
| Shared art or creative content online created yourself | 35% | 36% | 28% |
| Other cultural activity | 51% | 22% | 26% |
Contact
Email: socialresearch@gov.scot
There is a problem
Thanks for your feedback