Cultural engagement in Scotland: what is it and why does it matter?
This report provides evidence on cultural engagement in Scotland from 2019 - 2024. It draws on a range of data, from both the Scottish Household Survey and qualitative research, to explore attitudes and behaviours for different people and places across Scotland.
How has cultural engagement changed over time (2019 to 2022)?[22]
Cultural engagement
Whilst cultural engagement in 2022 is high at 88% this figure has decreased by two percentage points since 2019 (90%) (Figure 13).
Due to methodology changes due to Covid-19 the results of the 2020 and 2021 SHS telephone survey were published as experimental statistics. They are not directly comparable to SHS face to-face survey results for 2022 and previous years (2019 and earlier).
Percentage of adults engaged with culture in the last 12 months, 2019 – 2022, Scotland
No Local Authority showed a significant increase in cultural engagement between 2019 and 2022. Cultural engagement maintained in 27 out of the 32 Local Authorities. Five Local Authorities showed a significant decrease in engagement. The Local Authorities that showed the biggest significant decreases over this period were in Angus (-10 percentage points), Na h-Eileanan Siar and Glasgow City (both -8 percentage points) (Table 10 in Annex E).
Attendance at cultural events or places of culture
In 2022, almost three quarters of adults (74%) in Scotland attended or visited a cultural event or place in the last 12 months. This figure has decreased from 81% in 2019 (Figure 14). When cinema is excluded, attendance has fallen from 74% in 2019 to 65% in 2022.
Percentage of adults who attended any cultural event or visited a place of culture in the last 12 months[23], 2019 – 2022, Scotland
Individual cultural events or places
Since 2019, there has been no increase in attendance at any of the individual cultural event or places. Attendance has decreased in 13 of the events or places since 2019. Note some of the response options are not comparable with 2019 (Table 3).
The biggest decreases can be seen for culturally specific festivals and libraries (both -10 percentage points), theatres and cinema (both -9 percentage points). Attendance for streaming of a live performance remained stable over this period.
Table 3: Attendance has decreased in 13 of the 18 cultural events or places since 2019
Percentage of adults who attended individual cultural events or visited a place of culture in the last 12 months , 2019 – 2022, Scotland
| Event or place | 2019 | 2022 | % point change |
|---|---|---|---|
| Cinema | 58% | 49% | -9* |
| Library (including mobile and online) | 27% | 17% | -10* |
| Live music event | 37% | 32% | -5* |
| Theatre | 34% | 24% | -9* |
| Dance show / event | 11% | 6% | -5* |
| Historic place | 35% | 29% | -6* |
| Museum | 34% | 26% | -8* |
| Art gallery | 22% | 18% | -4* |
| Exhibition - including art, photography and crafts | 18% | 12% | -6* |
| Street arts | 17% | 10% | -7* |
| Culturally specific festival | 15% | 5% | -10* |
| Book festival | 6% | 3% | -3* |
| Archive or records office | 2% | 1% | -1* |
| Streaming of a live performance | 7% | 8% | 1 |
| Classical music performance | - | 5% | - |
| Opera | - | 2% | - |
| Classical music performance or opera | 8% | - | - |
| Comedy performance | - | 10% | - |
| None | 19% | 27% | 8* |
* = Significant change
Local Authority
No Local Authorities showed significant increases in attendance between 2019 and 2022 when cinema was included. Attendance maintained in 19 out of the 32 Local authorities. Thirteen Local Authorities saw a decrease in attendance over this period.
The biggest significant decreases in attendance, when cinema was included, were in Na h-Eileanan Siar (-17 percentage points), Orkney Island (-16 percentage points), Fife and Glasgow City (both -13 percentage points) (Table 11 in Annex E).
A similar pattern was seen when cinema was excluded (Table 12 in Annex E).
Population subgroups
We have focused on sex, age, highest level of qualifications, deprivation and net annual household income. All breakdowns are however contained in Table 15, Table 16, Table 17, Table 18 in Annex F and the accompanying excel workbook.
Unlike participation in cultural activities, attendance rates decreased for most population subgroups. More detail can be seen in the section below.
Sex[24]
Since 2019, attendance at cultural events or places, including cinema, has decreased for both men and women although attendance has decreased more for women (Table 15 and Figure 15).
Eighty-three percent of women attended a cultural event or place of culture in 2019 compared to 73% in 2022 (-10 percentage points). Seventy-nine percent of men attended a cultural event or place of culture in 2019 compared to 74% in 2022 (-5 percentage points).
Percentage of adults who attended any cultural event or visited a place of culture in the last 12 months by sex, 2019 – 2022, Scotland
A similar pattern was seen when excluding cinema (Table 17).
Age
Attendance decreased for all age groups since 2019, when cinema was included, however attendance decreased the most of adults in the oldest age group (75 and over). Attendance decreased the least for adults in the middle age range (35 to 44) (Table 15 and Figure 16).
Fifty-five percent of adults aged 75 and over attended a cultural event or place of culture in 2019 compared to 44% in 2022 (-11 percentage points). Eighty-seven percent of adults aged between 35 and 44 attended a cultural event or place of culture in 2019 compared to 83% in 2022 (-4 percentage points).
Percentage of adults who attended any cultural event or visited a place of culture in the last 12 months by age, 2019 – 2022, Scotland
A similar pattern was seen when excluding cinema (Table 17).
Highest level of qualification
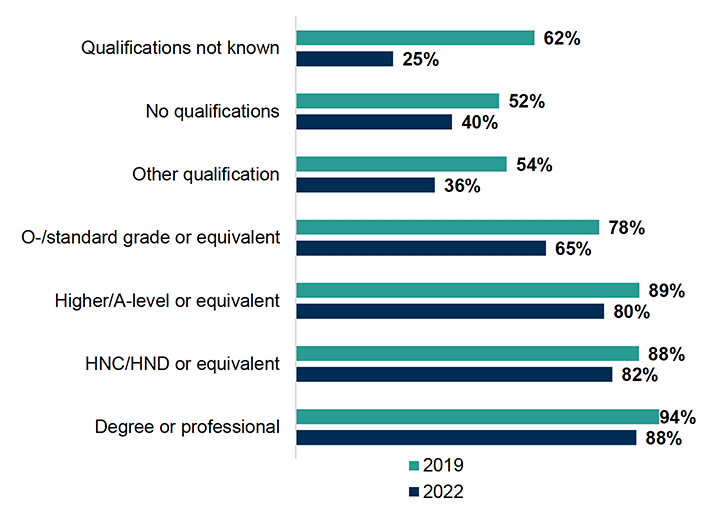
Attendance fell across all the qualification categories since 2019 when cinema was included. The drop in attendance was higher for those with no qualifications than for those with a degree or professional qualification (Table 15 and Figure 17).
Fifty-two percent of adults with no qualifications attended a cultural event or place of culture in 2019 compared to 40% in 2022 (-12 percentage points). Nighty-four percent of adults with a degree or professional qualification attended a cultural event or place of culture in 2019 compared to 88% in 2022 (-6 percentage points).
Percentage of adults who attended any cultural event or visited a place of culture in the last 12 months by highest level of qualification, 2019 – 2022, Scotland
A similar pattern was seen when excluding cinema (Table 17).
Deprivation (measured by Scottish Index of Multiple Deprivation)
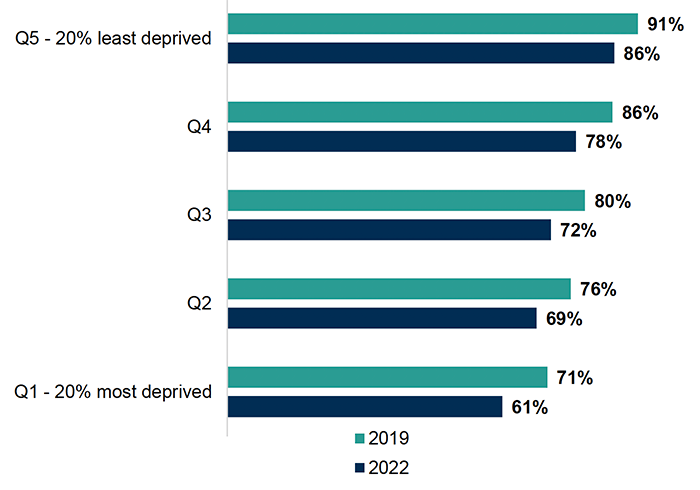
Attendance decreased across all SIMD quintiles since 2019, when cinema was included, but attendance dropped the most for adults living in the 20% most deprived areas and least for adults living in the 20% least deprived areas (Table 15 and Figure 18).
Seventy-one percent of adults in the 20% most deprived areas attended a cultural event or place of culture in 2019 compared to 61% in 2022 (-10 percentage points). Nighty-one percent of adults in the 20% least deprived areas attended a cultural event or place of culture in 2019 compared to 86% in 2022 (-5 percentage points).
Percentage of adults who attended any cultural event or visited a place of culture in the last 12 months by deprivation, 2019 – 2022, Scotland
A similar pattern was seen when excluding cinema (Table 17).
Net annual household income
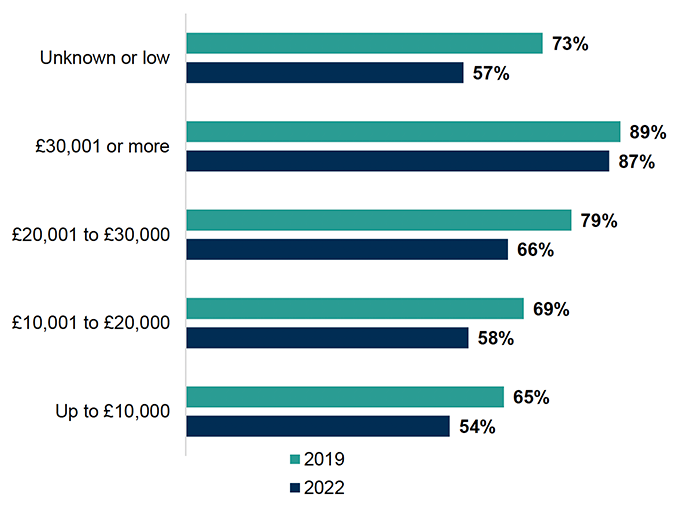
Attendance has fallen across all household income categories since 2019, when cinema was included, but attendance has fallen the least for adults with a net annual household income of £30,001 or more (Table 15 and Figure 19).
Eighty-nine percent of adults with a net annual household income of £30,001 or more attended a cultural event or place in 2019 compared to 87% in 2022 (-2 percentage points). This compares to a 11 percentage drop for adults with a net annual household income of up to £10,000 (from 65% in 2019 to 54% in 2022).
Percentage of adults who attended any cultural event or visited a place of culture in the last 12 months by net annual household income, 2019 – 2022, Scotland
A similar pattern was seen when excluding cinema (Table 17).
Disability
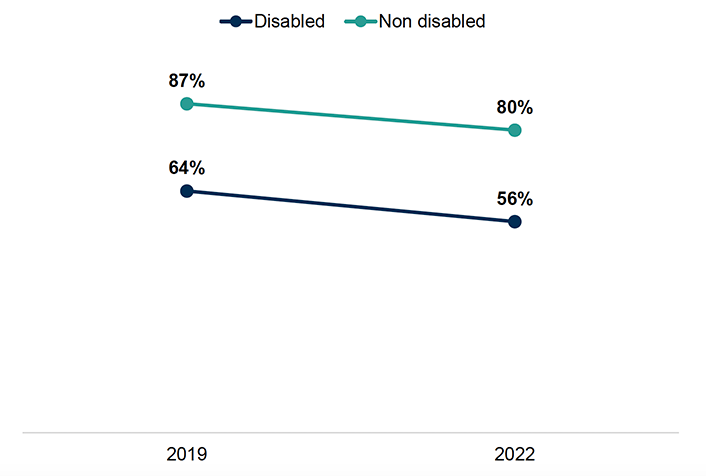
The drop in attendance since 2019 was slightly higher for disabled adults compared to non-disabled adults (Table 16 and Figure 20).
Sixty-four percent of disabled adults attended a cultural event or place in 2019 compared to 56% in 2022 (-8 percentage points). This compares to a seven percentage drop for non-disabled adults (from 87% in 2019 to 80% in 2022).
Percentage of adults who attended any cultural event or visited a place of culture in the last 12 months by disability, 2019 – 2022, Scotland
When cinema was excluded, the drop in participation was slightly higher for non-disabled adults (-10 percentage points) than disabled adults (-8 percentage points) (Table 18).
Participation in cultural activities
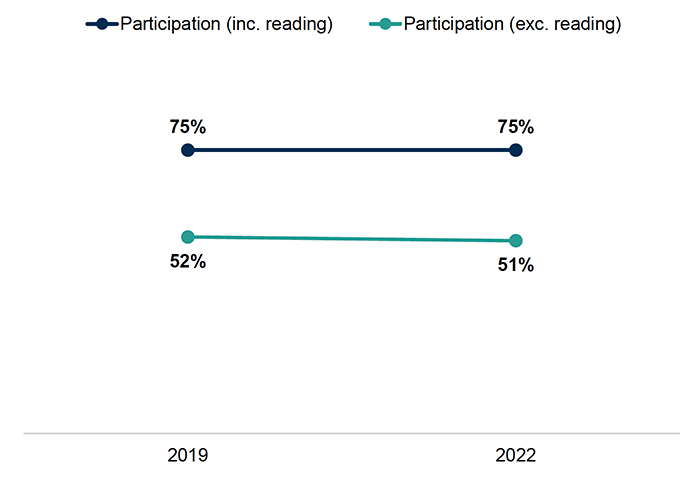
In 2022, three quarters of adults in Scotland (75%) participated in a cultural activity in the last 12 months (Figure 21). Unlike attendance at cultural events or places, this figure has maintained since 2019. When reading is excluded, participation was 51% which has also maintained since 2019.
Percentage of adults who participated in any cultural activity in the last 12 months, 2019 - 2022, Scotland
Individual cultural activities
Since 2019, participation has increased for crafts (+2 percentage points) and playing a musical instrument (+1 percentage point). Participation has decreased in five of the activities with the biggest decreases seen for viewing cultural content online (-3 percentage points) and viewing performance online (-2 percentage points). Participation remained stable in the remaining 8 activities over this period (Table 4).
Table 4: Since 2019 participation has increased for Crafts and Playing a musical instrument
Percentage of adults who participated in individual cultural activities in the last 12 months, 2019 - 2022, Scotland
| Activity | 2019 | 2022 | % point change |
|---|---|---|---|
| Read books, poetry or graphic novels / comics for pleasure | 62% | 64% | 2 |
| Dance, either for fitness or not for fitness | 12% | 12% | 0 |
| Played a musical instrument or written music | 11% | 12% | 1* |
| Taken part in a theatrical performance | 1% | 1% | 0 |
| Sang in a singing group or choir | 4% | 3% | -1 |
| Painting, drawing, printmaking or sculpture | 11% | 12% | 1 |
| Photography as an artistic activity (not family or holiday 'snaps') | 8% | 7% | -1* |
| Film- making/ video-making as an artistic activity | 2% | 2% | 0 |
| Used a computer to produce artwork or animation | 7% | 6% | -1* |
| Crafts | 16% | 18% | 2* |
| Creative writing - stories, books, comics, plays or poetry | 5% | 4% | -1 |
| Viewed performances (e.g. music or dance) online | 23% | 20% | -2* |
| Viewed cultural content online | 11% | 8% | -3* |
| Shared art or creative content online created yourself | 5% | 3% | -1* |
| Other cultural activity | 2% | 2% | 0 |
| None | 25% | 25% | 0 |
* = Significant change
Local Authority
Three Local Authorities showed a significant increase in participation between 2019 and 2022, North Ayrshire (+14 percentage points, Perth and Kinross (+10 percentage points) and Argyll and Bute (+8 percentage points) when reading was included. Participation maintained in 25 out of the 32 Local Authorities. Four Local Authorities saw a decrease in participation over this period. The biggest significant decreases were in Angus (-23 percentage points and Stirling (-10 percentage points) (Table 13 in Annex E).
When reading was excluded, four Local Authorities showed a significant increase in participation between 2019 and 2022: Inverclyde (+20 percentage points), Moray (+14 percentage points), North Ayrshire (+13 percentage points, Aberdeen City (+12 percentage points). Participation maintained in 23 out of the 32 Local Authorities. Five Local Authorities saw a decrease in participation over this period. The biggest significant decreases were in Angus (-25 percentage points) and Stirling (-17 percentage points) (Table 14 in Annex E).
Population subgroups
Given the large number of breakdowns we do not have space to report on the changes in every breakdown. We have therefore focused on sex, age, highest level of qualifications, deprivation and net annual household income. All breakdowns are however contained in Table 19, Table 20, Table 21, Table 22 in Annex F and the accompanying excel workbook.
Unlike attendance at cultural events and places, participation rates maintained for most population subgroups. More detail can be seen in the section below.
Sex
Since 2019, participation in cultural activities, including reading, has maintained for both men and women at 70% and 80% respectively (Table 19).
A similar pattern was seen when excluding reading (Table 21).
Age
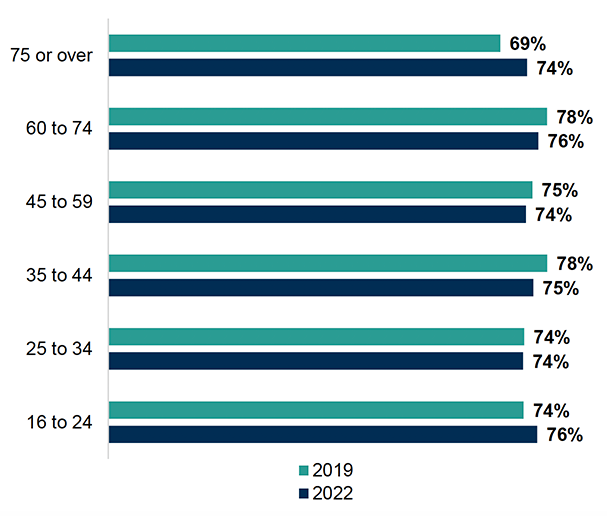
Participation in cultural activities has maintained for all age bands since 2019, when reading is included, apart from adults aged 75 and over where participation has increased (Figure 22 and Table 19).
Sixty-nine percent of adults aged 75 and older participated in cultural activities in 2019 compared to 74% in 2022 (+5 percentage points).
Figure 22: Participation in cultural activities in the last 12 months has increased for adults aged 75 and over since 2019 but maintained for other age groups
Percentage of adults who participated in any cultural activity in the last 12 months by age, 2019 - 2022, Scotland
A similar pattern was seen when excluding reading (Table 21)
Highest level of qualification
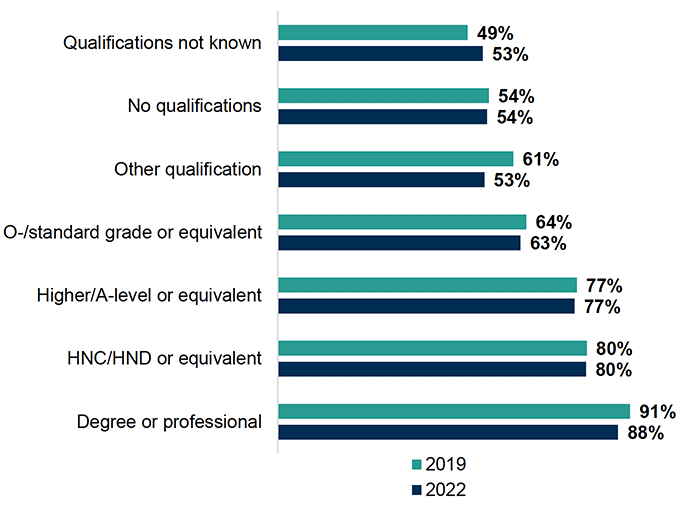
Participation maintained across all the qualification categories since 2019, when reading was included, except for adults with a degree or professional qualification or other qualification where participation decreased (Figure 23 and Table 19).
Ninety-one percent of adults with a degree or professional qualification participated in a cultural activity in 2019 compared to 88% in 2022 (-3 percentage points). Sixty-one percent of adults with other qualifications participated in a cultural activity in 2019 compared to 53% in 2022 (-7 percentage points).
Figure 23: Participation in cultural activities in the last 12 months has decreased for adults with a degree or professional qualification or other qualification since 2019 but maintained for other groups
Percentage of adults who participated in any cultural activity in the last 12 months by highest level of qualification, 2019 - 2022, Scotland
A similar pattern was seen when excluding reading (Table 21).
Deprivation (measured by Scottish Index of Multiple Deprivation)
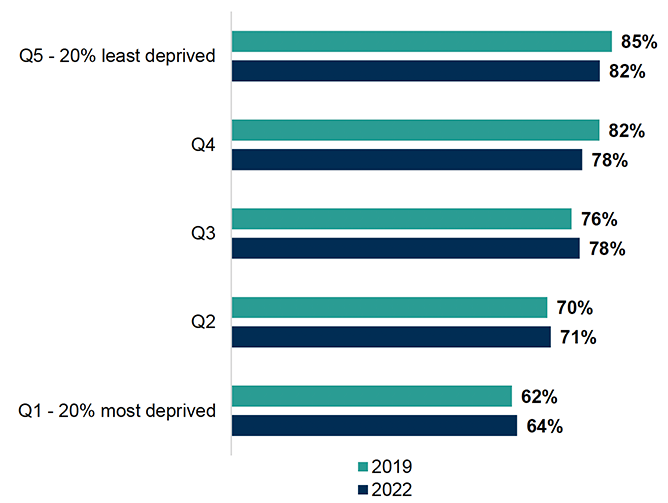
Participation maintained across all SIMD quintiles since 2019, when reading was included, except for adults in quintile 4 (Figure 24 and Table 19).
Eighty-two percent of adults in quintile 4 participated in a cultural activity in 2019 compared to 78% in 2022 (-4 percentage points).
Figure 24: Participation in cultural activities in the last 12 months has maintained for adults since 2019 for apart from those in quintile 4
Percentage of adults who participated in any cultural activity in the last 12 months by deprivation, 2019 - 2022, Scotland
A similar pattern was seen when excluding reading (Table 21).
Net annual household income
Participation has maintained across all household income categories since 2019, when reading was included (Table 19).
A similar pattern was seen, when reading was excluded, apart from adults with an unknown or low net annual household income where participation dropped from 47% in 2019 to 38% in 2022 (-9 percentage points) (Table 21).
Disability
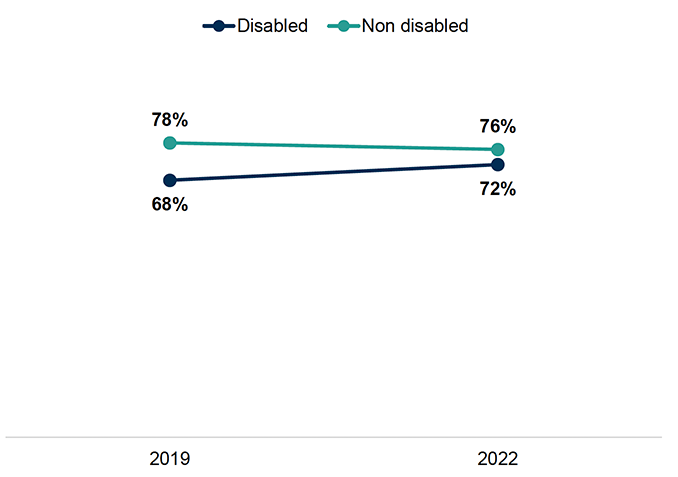
Participation in cultural activities increased for disabled adults since 2019, when reading was included. Participation for non-disabled adults, however, maintained over this period (Table 20 and Figure 25).
Sixty-eight percent of disabled adults participated in a cultural activity in 2019 compared to 72% in 2022 (+4 percentage points). Seventy-eight percent of non-disabled adults participated in a cultural activity in 2019 compared to 76% in 2022.
Figure 25: Participation in cultural activities in the last 12 months has decreased for disabled adults since 2019
Percentage of adults who participated in any cultural activity in the last 12 months by disability, 2019 - 2022, Scotland
A slightly different pattern was seen when excluding reading (Table 22).. Participation in cultural activities for disabled adults increased from 43% in 2019 to 48% in 2022 (+5 percentage points). However, participation decreased for non-disabled adults when reading was excluded. Down from 55% in 2019 to 52% in 2022 (-3 percentage points).
Contact
Email: socialresearch@gov.scot
There is a problem
Thanks for your feedback