Scottish Milk and Healthy Snack Scheme and the Scottish School Milk Scheme: data collection
Analysis of data collected on the operation of the Scottish Milk and Healthy Snack Scheme and local authority school milk schemes to support the new Scottish School Milk Subsidy Scheme.
Chapter 2: SMHSS - Overview of local authority and childcare setting responses
Local Authorities
All local authorities in Scotland have settings enrolled on the SMHSS. A total of 31 local authorities responded to the request for information, out of a possible 32.
Settings
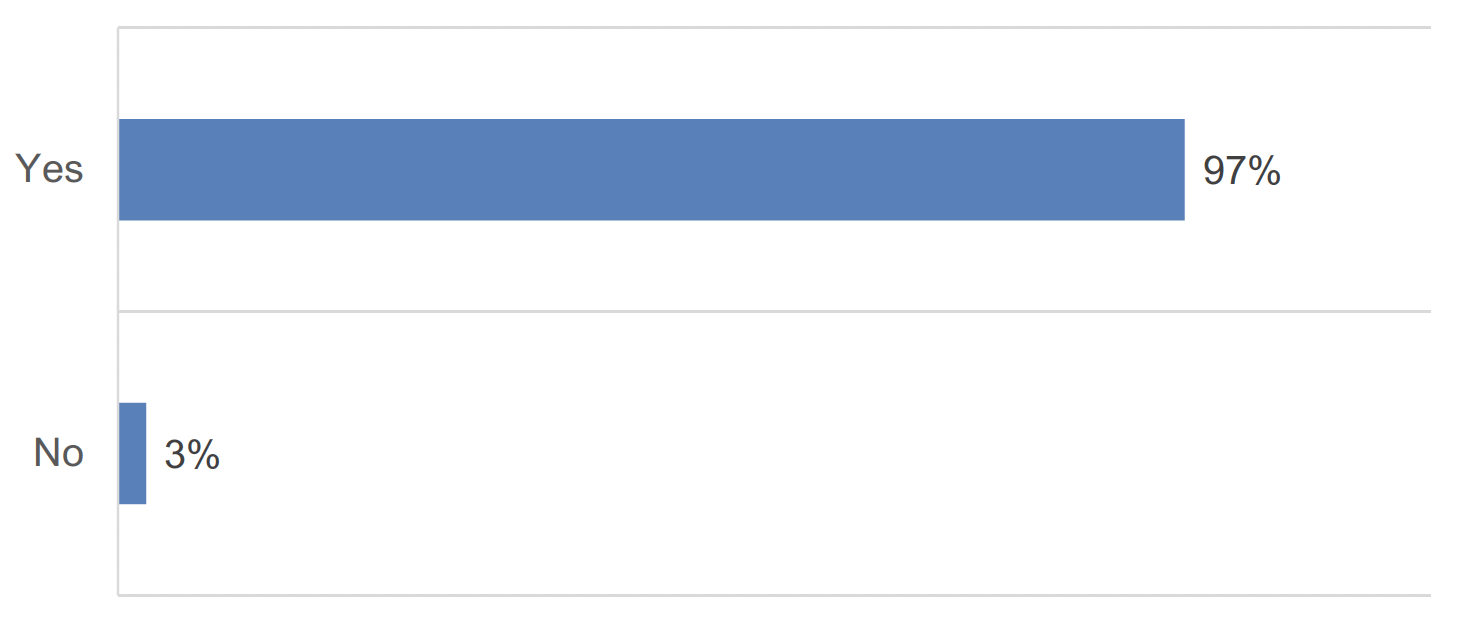
A total of 582 settings responded to the data collection exercise. Of those, 573 (97%) reported that their setting(s) participated in the SMHSS, Figure 2.1.

Base: All (582)
The majority (73%) of responses from settings were from day care of children settings (including nurseries, playgroups, creches) and the remaining 27% were from childminders. From Care Inspectorate data, we know that 79% of those registered to the SMHSS are daycare settings and 21% are childminder settings; this is important to note when considering this data as there is a proportionally higher response from childminders than in the population as a whole. Responses from settings were fairly evenly split across Private, Voluntary or Independent settings (56%) and local authority settings (44%).
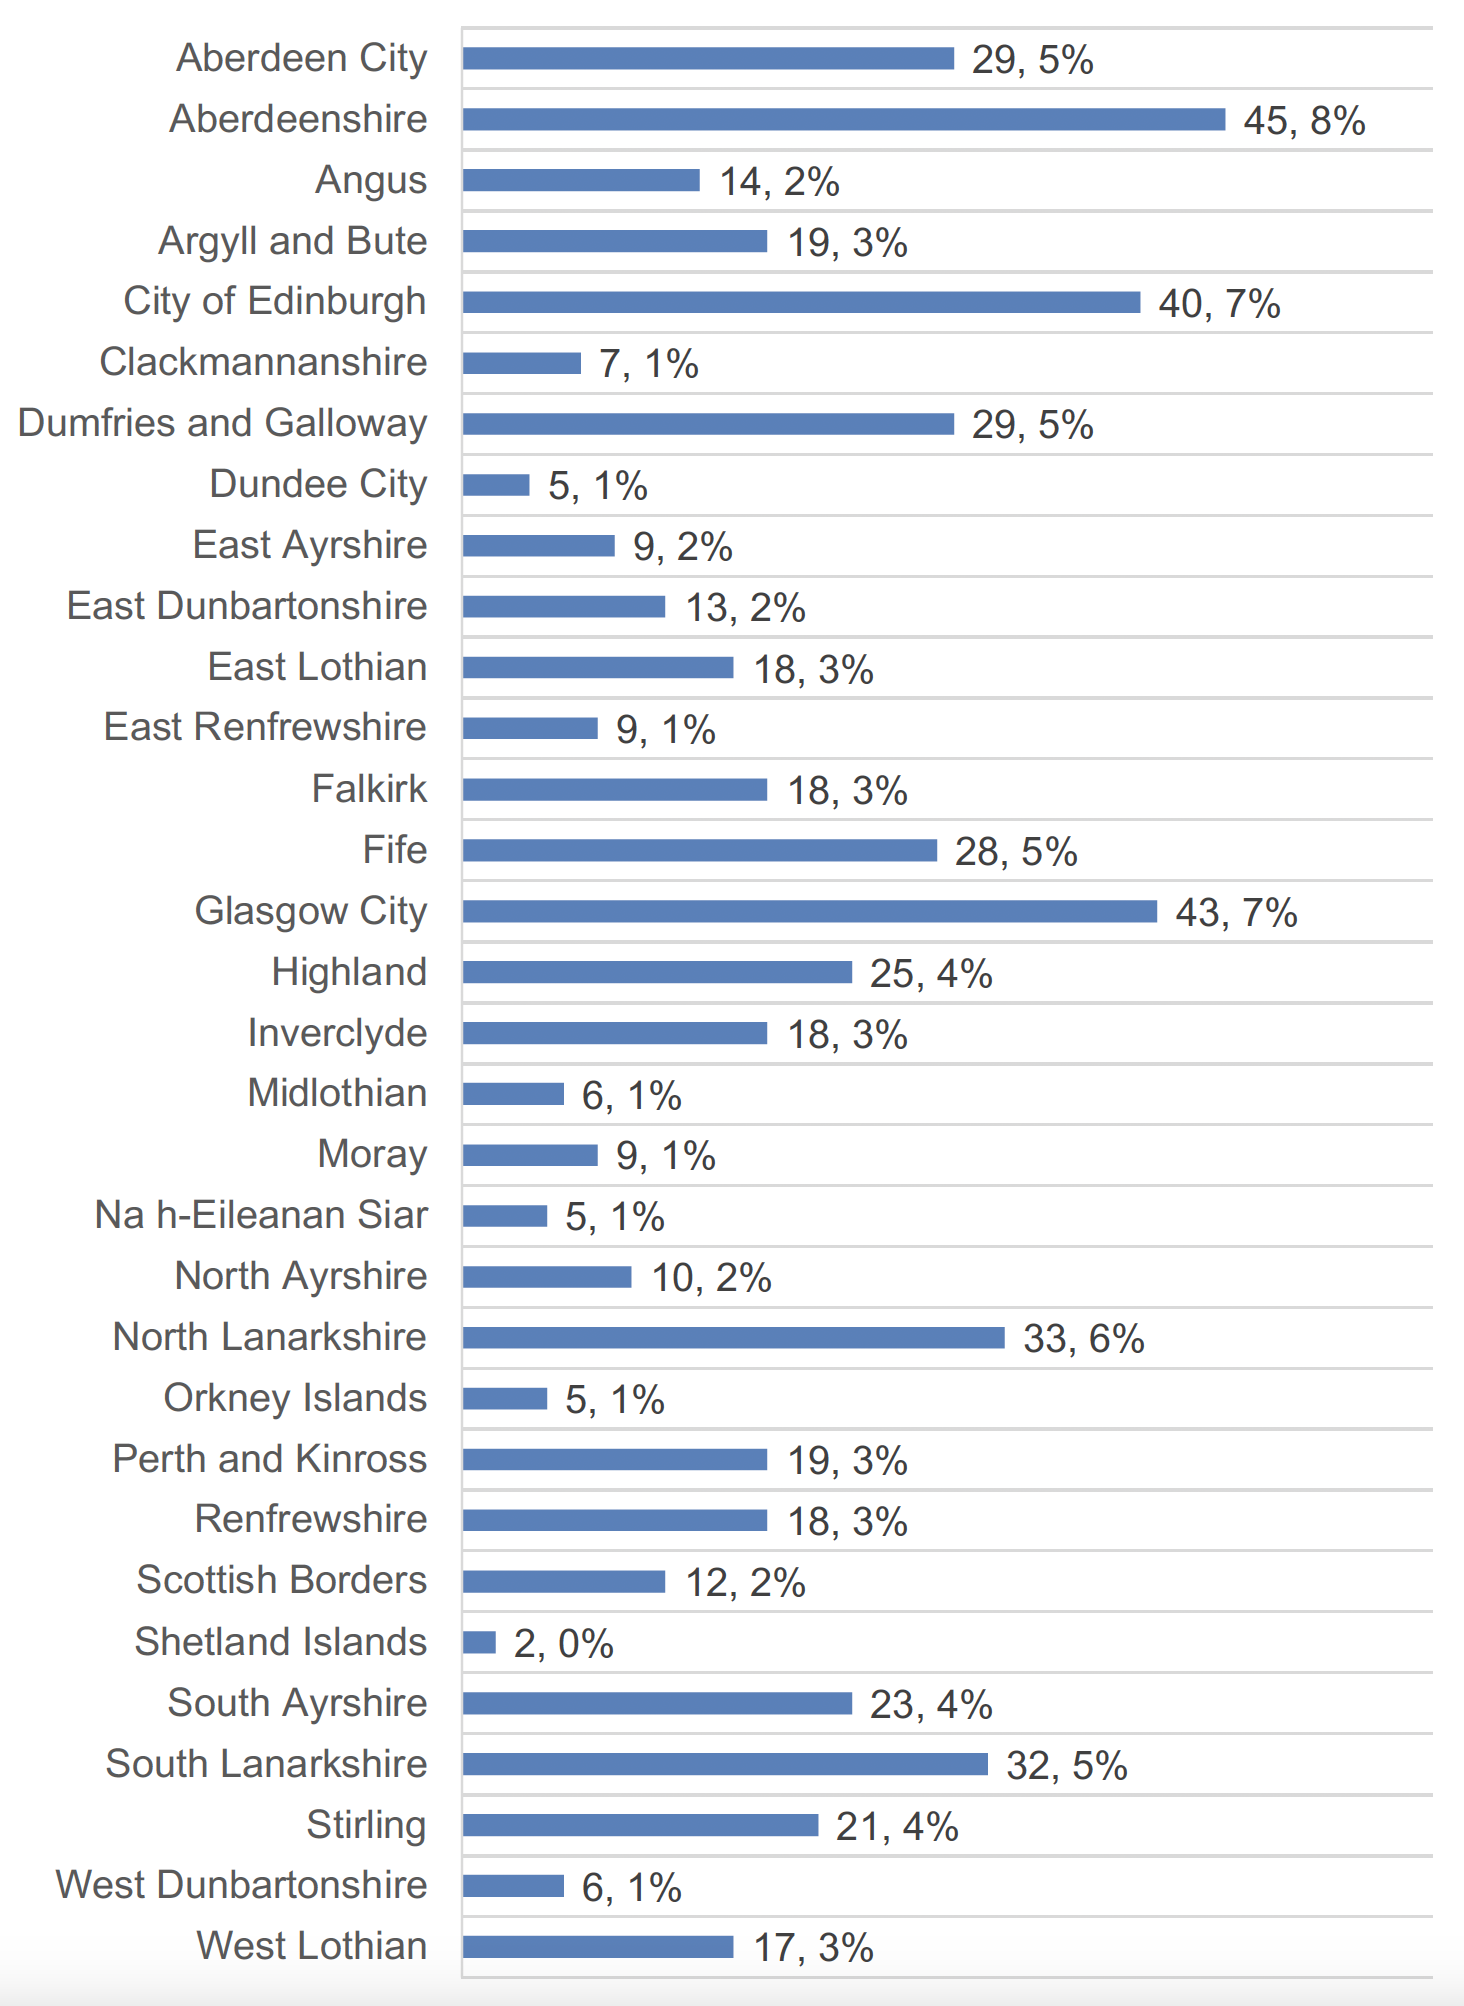
There were responses from settings participating in the SMHSS from all 32 local authority areas in Scotland. Figure 2.2 provides a breakdown of the responses from setting(s) by local authority areas across Scotland. Table 2.1 presents the proportion of settings in LA areas that responded to the SMHSS data collection compared to the 2023 ELC Census.

Base: Those participating in SMHSS (573)
| Local Authority Area | 2023 ELC Census (% of total children registered in Scotland in each Local Authority) | SMHSS 2024 Data Collection (% of setting responses) |
|---|---|---|
| Aberdeen City | 4% | 5% |
| Aberdeenshire | 5% | 8% |
| Angus | 2% | 2% |
| Argyll & Bute | 1% | 3% |
| City of Edinburgh | 8% | 7% |
| Clackmannanshire | 1% | 1% |
| Dumfries & Galloway | 3% | 5% |
| Dundee City | 3% | 1% |
| East Ayrshire | 2% | 2% |
| East Dunbartonshire | 2% | 2% |
| East Lothian | 2% | 3% |
| East Renfrewshire | 2% | 1% |
| Falkirk | 3% | 3% |
| Fife | 7% | 5% |
| Glasgow City | 11% | 7% |
| Highland | 4% | 4% |
| Inverclyde | 1% | 3% |
| Midlothian | 2% | 1% |
| Moray | 2% | 1% |
| Na h-Eileanan Siar | 0% | 1% |
| North Ayrshire | 2% | 2% |
| North Lanarkshire | 6% | 6% |
| Orkney Islands | 0% | 1% |
| Perth & Kinross | 3% | 3% |
| Renfrewshire | 4% | 3% |
| Scottish Borders | 2% | 2% |
| Shetland Islands | 0% | 0% |
| South Ayrshire | 2% | 4% |
| South Lanarkshire | 6% | 5% |
| Stirling | 2% | 4% |
| West Dunbartonshire | 2% | 1% |
| West Lothian | 4% | 3% |
Contact
Email: SMHSS@gov.scot
There is a problem
Thanks for your feedback