Scottish Milk and Healthy Snack Scheme and the Scottish School Milk Scheme: data collection
Analysis of data collected on the operation of the Scottish Milk and Healthy Snack Scheme and local authority school milk schemes to support the new Scottish School Milk Subsidy Scheme.
Chapter 3: Scottish Milk and a Healthy Snack Scheme - Provision
This section presents analysis of the provision of the SMHSS scheme from returns by local authorities and settings.
Provision – Local Authority
Of the 31 local authorities who responded to the request for information, 27 provided data on the number of childcare and day care of children settings enrolled in the SMHSS. Three LAs provided returns but did not provide this information. One LA did not submit a return at all for the SMHSS.
A total of 469 childminder settings and 1,788 day care settings reported across these 27 local authorities.
Local Authorities who responded provided information on what they sourced for settings in their area through the SMHSS. It is important to note that some local authorities only stated they passed the funding directly to the settings.
Of those who did report what they sourced for settings through the scheme, 81% reported that they sourced milk while 61% sourced a healthy snack. A further 48% reported sourcing non-dairy alternatives.
When removing those local authorities who only stated that they passed funding on to settings all of the local authorities stated that they sourced milk, 76% reported sourcing a healthy snack and 60% reported sourcing non-dairy alternatives.
Local authorities were asked what influenced their decisions on how to source the elements they could provide via the scheme. Of those who responded to the question, 52% said that cost was the main driver of their decisions, 23% reported that the range of options most influenced their decision on how to source the elements provided under the scheme and 13% reported convenience.
Over half (52%) reported other reasons. Among these reasons was quality when procuring products for the SMHSS. It was also noted that some use national procurement contracts, while others have contracts through Scotland Excel.
While some LAs organise and process milk orders for nurseries, childcare providers often procure their own and therefore the LA could not comment. Local suppliers were preferred in some cases, and compliance with procurement processes was emphasised.
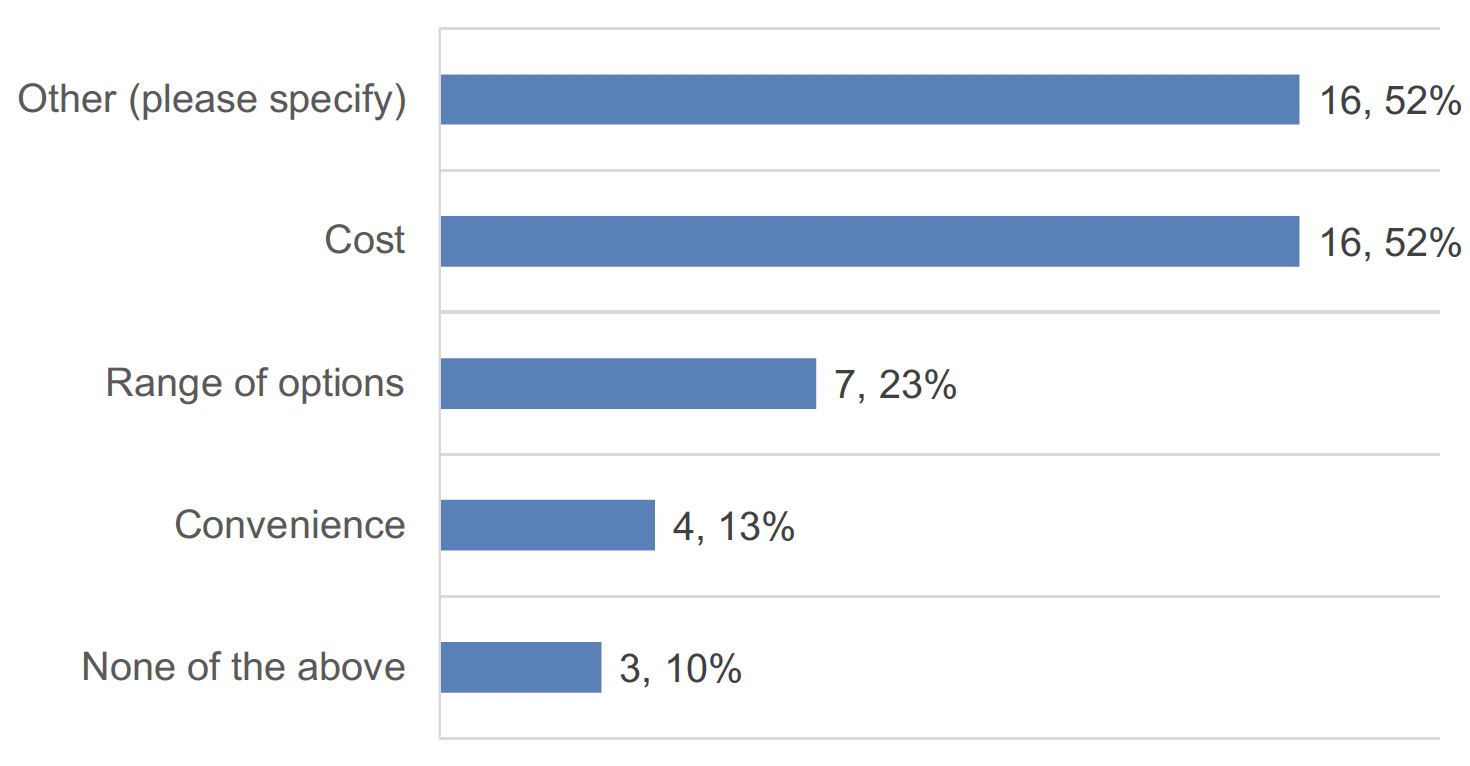
Base: All (31 out of 32)
Of those local authorities who reported supplying milk, 23% reported sourcing this from a milk agent while 23% reported that they sourced milk directly from a dairy. Many local authorities reported that they sourced their milk in another way and responses to these included contracts facilitated by Scotland Excel and direct purchasing. It was also noted that milk and snacks are commonly procured through procurement frameworks, with some variation in purchasing methods depending on the setting's budget and contractual arrangements.
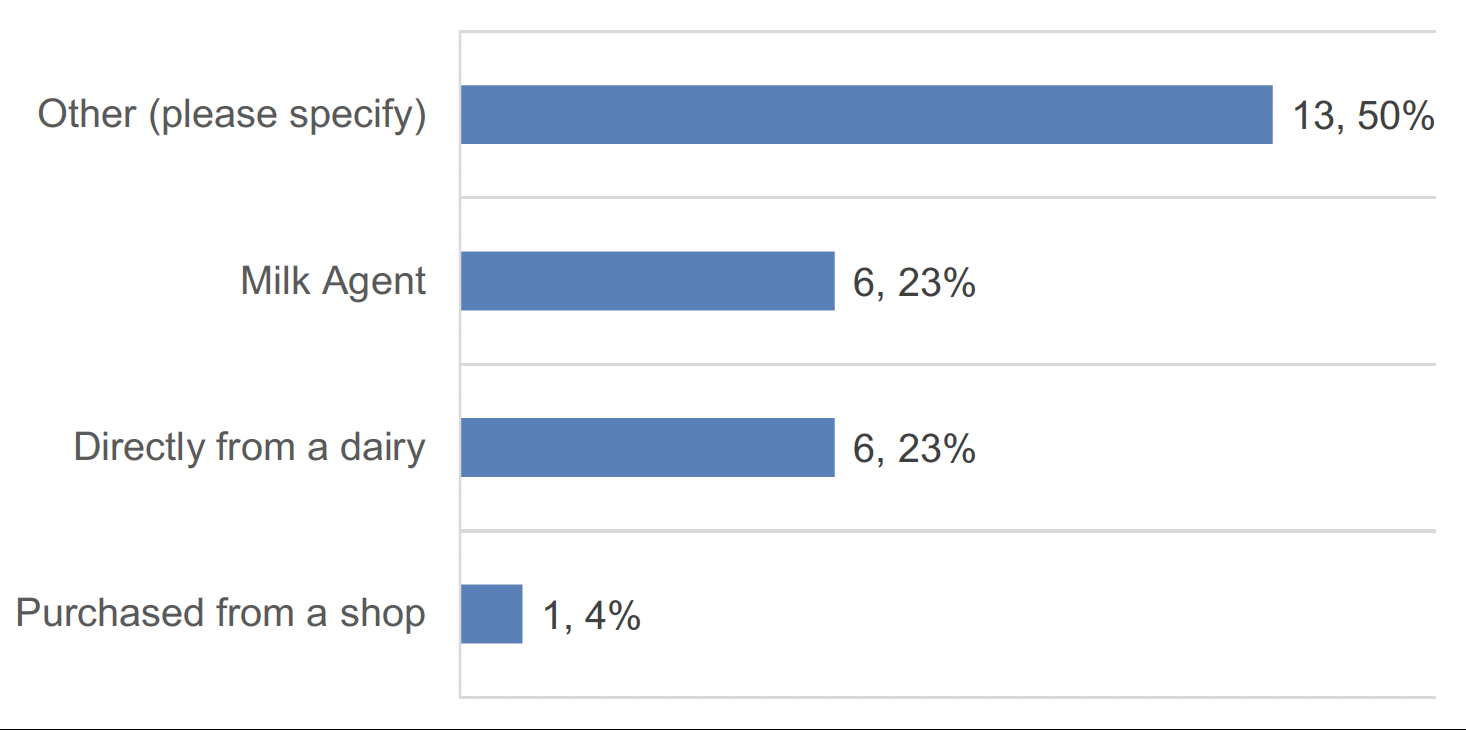
Base: All excluding those who say they do not supply milk (26)
Provision – Settings
Of the 573 settings who responded indicating that they were enrolled in the SMHSS, 488 gave substantive information about their provision.
Across these settings the total number of children reported as being enrolled in the SMHSS was 20,795 as of 1 August 2023. This constitutes 15% of the total registered in April 2023. Table 3.1 below presents both the mean, the average of all data points, and median, the middle value in an ordered list, values for the number of children enrolled in the scheme.
| Children enrolled in SMHSS | Median | Mean | Total |
|---|---|---|---|
| Total number of children enrolled in the SMHSS in your setting (s) as of 1 August 2023 (if not applicable the first day of the August term) | 31.5 | 42.6 | 20,795 |
Settings were asked to provide the number of eligible children enrolled in settings who opt for the following:
- number of eligible children enrolled in your setting(s) who opt for goat or sheep's milk as an alternative to cow's milk as of 1 August 2023 (if not applicable the first day of the August term).
- number of eligible children enrolled in your setting(s) who opt for non-dairy alternatives as of 1 August 2023 (if not applicable the first day of the August term).
- number of children under the age of 12 months receiving 1st infant formula as of 1 August 2023 (if not applicable the first day of the August term).
- number of children under the age of 2 and over the age of 1 receiving whole cow/sheep/goat’s milk as of 1 August 2023 (if not applicable the first day of the August term).
- number of children over the age of 2 receiving semi-skimmed cow/sheep/goat’s milk as of 1 August 2023 (if not applicable the first day of the August term).
Many settings did not break this down but did go on to answer the closed questions on their provision. In terms of the provision under the scheme, 97% of settings who gave a response reported that they source milk under the SMHSS, a further 89% provided a healthy snack and 50% provided non-dairy alternatives. A much lower proportion (4%) reported that they sourced first infant formula.
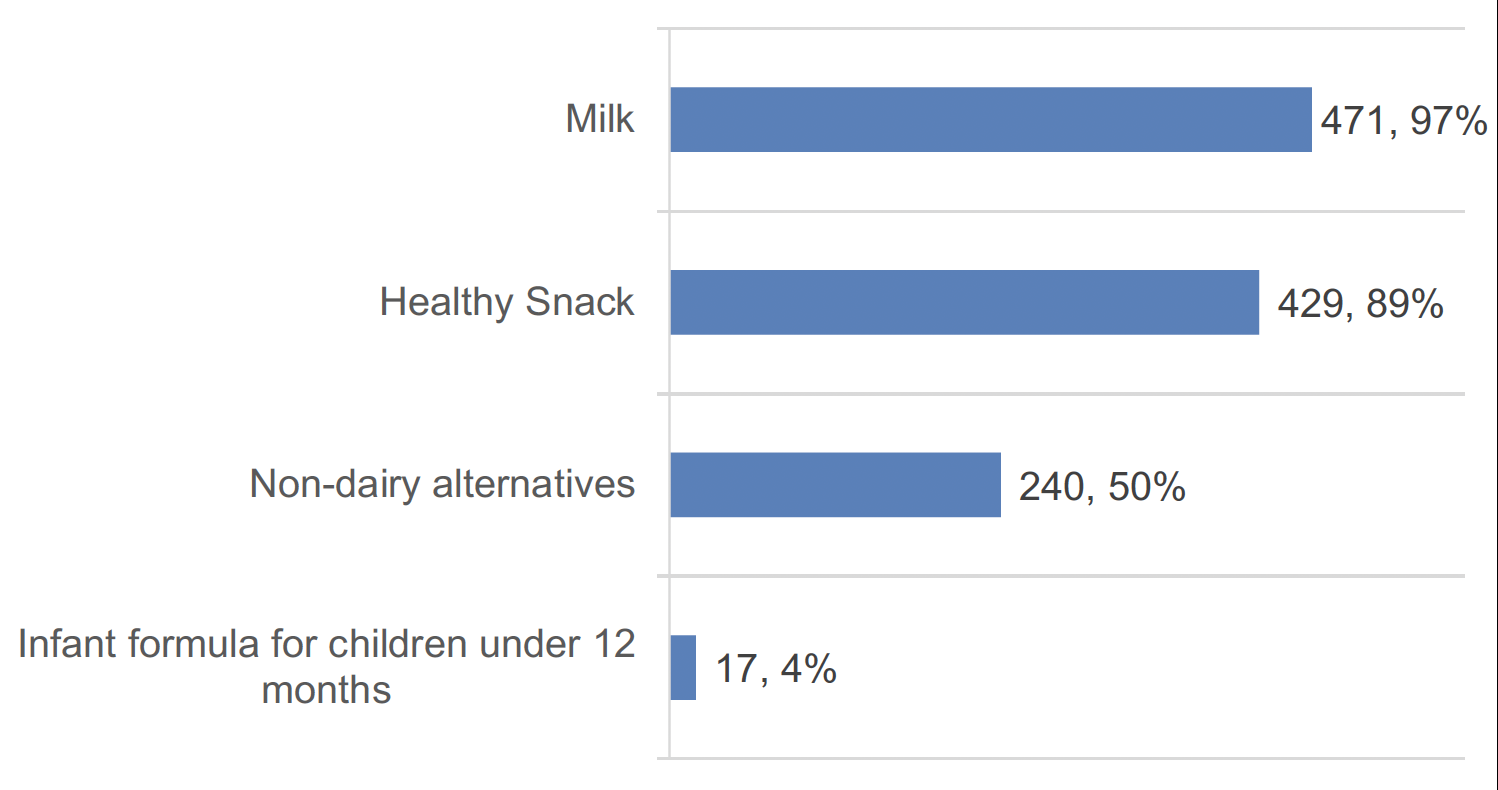
Base: Settings participating in SMHSS and provided a response (484)
Childcare providers were asked what influenced their decisions on how to source the elements they provided via the scheme. Of those who responded to the question 57% said that cost was the main driver of their decisions.
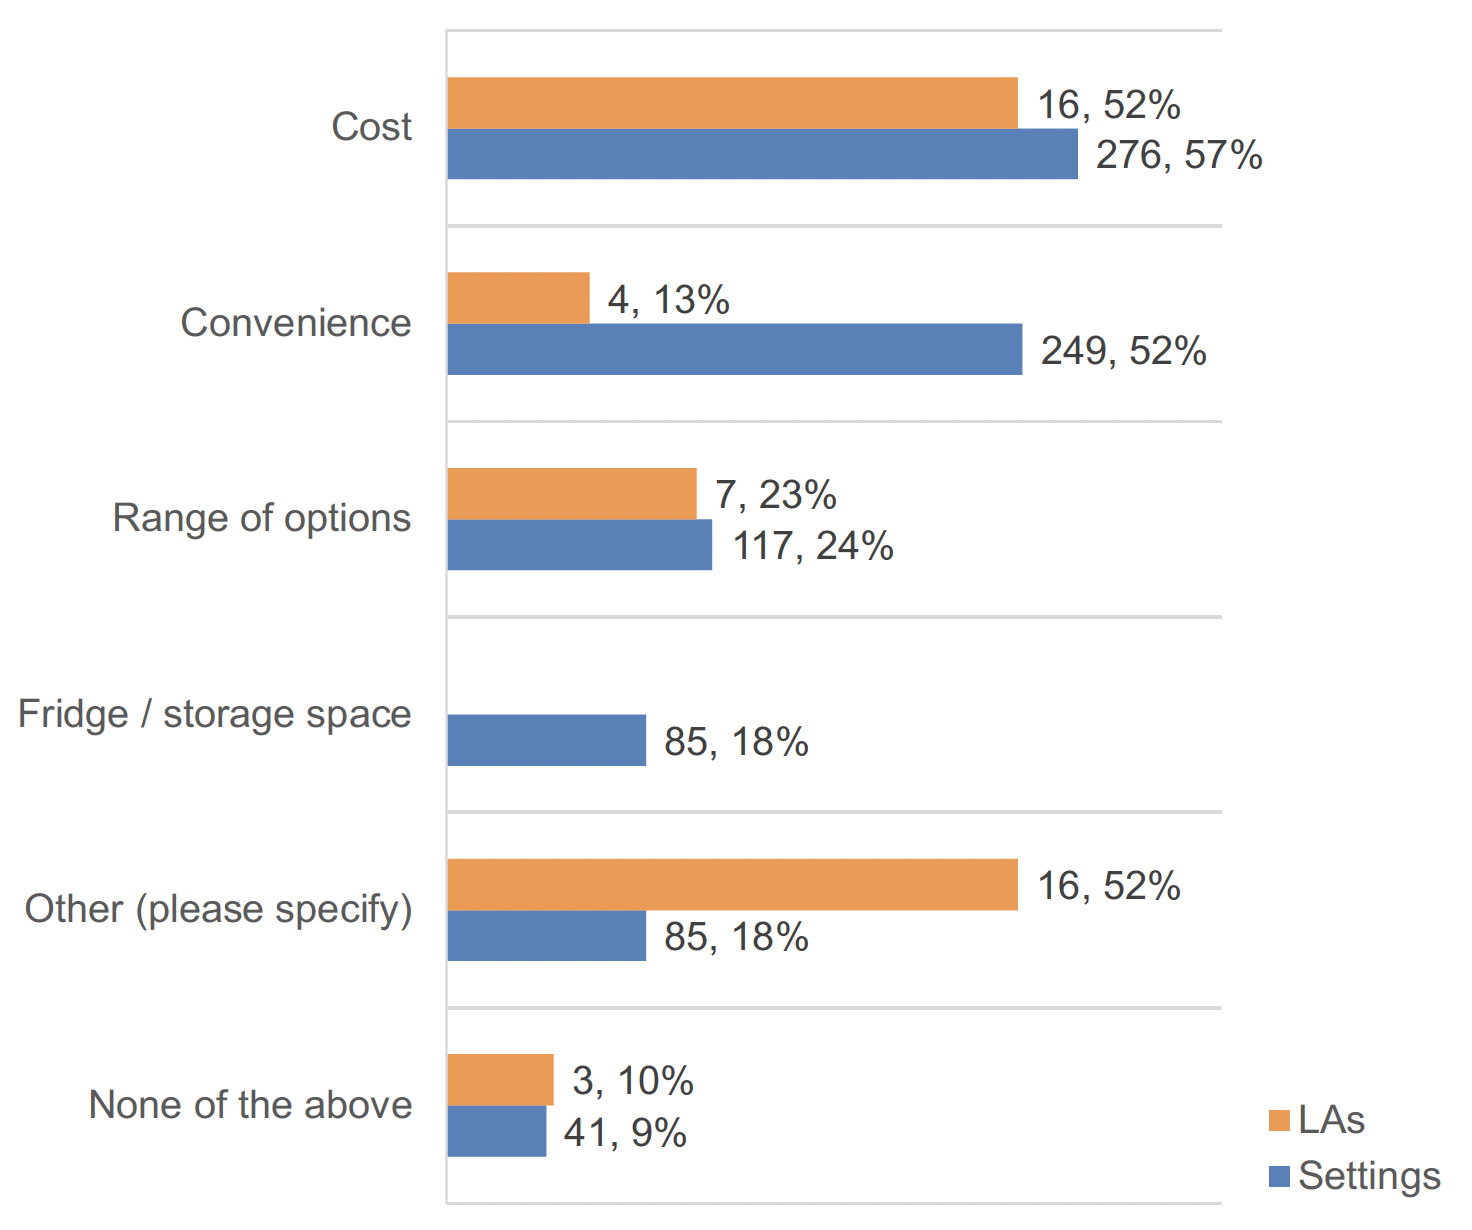
Base: Settings participating in SMHSS and provided a response (481)
There are some notable differences when comparing LA settings to PVI settings on the influences on their decision making when it comes to sourcing products for the SMHSS with 71% of PVIs citing cost as an influence compared to 41% of LA settings. PVI settings also place a greater emphasis on convenience (66%) than LA settings (34%). This is likely to be dictated by the fact that LA settings are more likely to have the costs and arrangements for sourcing products to be managed by the LA than PVI settings.
Similarly, childminder settings are more likely to reference cost (78%) and convenience (64%) as influences than day care of children settings (50% and 47% respectively).
Of those providers who reported supplying milk, 39% reported that they purchased it from a shop. A further 36% reported sourcing this from a milk agent while 14% reported that they sourced milk directly from a dairy. Some settings reported that they source their milk in another way which included ordering from online platforms, utilising local suppliers for fresh produce like fruit, vegetables, and milk, as well as occasional in-person shopping trips. The procurement methods vary based on the nature of the establishment, with some relying on workplace contracts and others incorporating individual parent contributions.
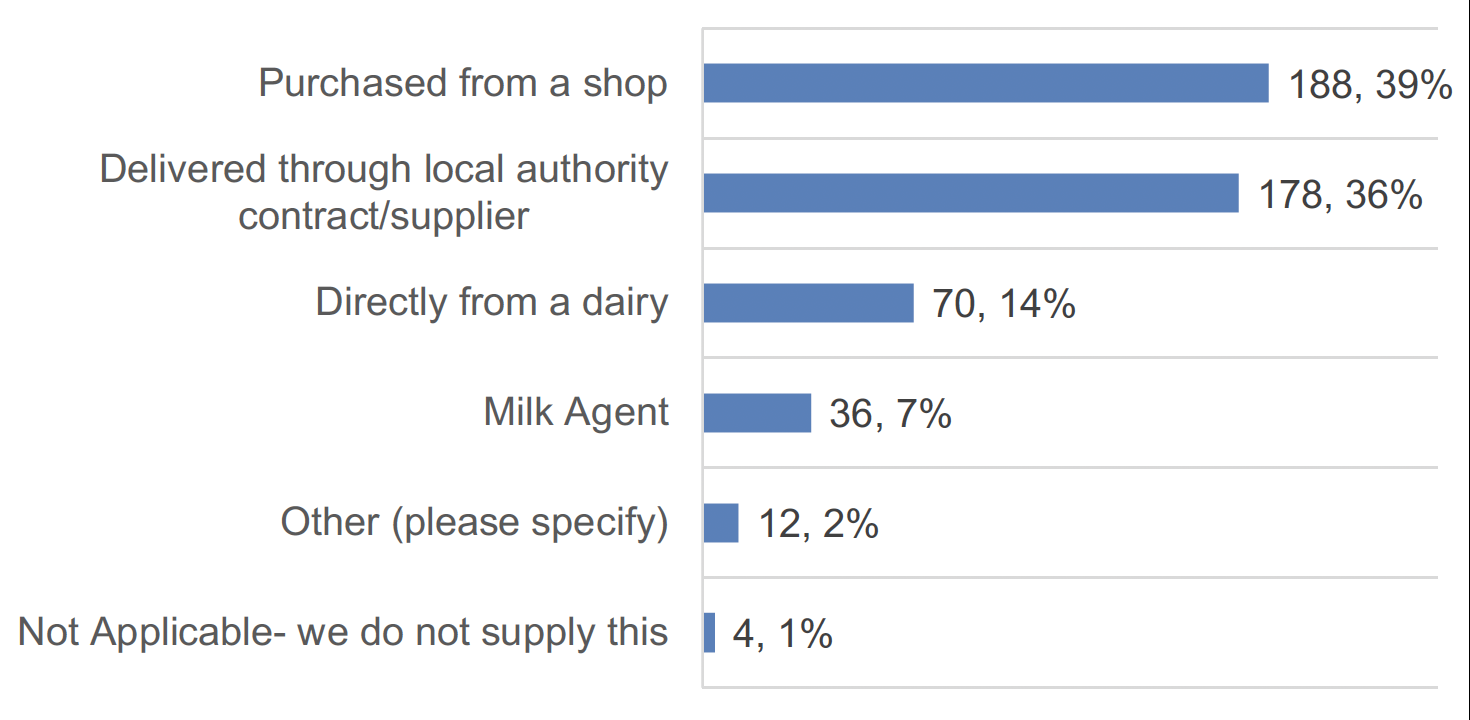
Base: Settings who supply dairy milk and provided a response (488)
There were variations in how dairy milk was supported between LA and PVI settings. PVI settings were more likely to say that they sourced their dairy milk from a shop (61%) than LA settings (12%). Childminder settings were also much more likely to report purchasing from a shop (76%) than daycare settings (25%). PVI settings were also more likely to report that they sourced milk directly from a dairy (20%) than LA settings (7%).
Conversely, LA settings were much more likely to report that milk was delivered via a local authority contract/supplier (76%) than PVI settings (2%).
Provision – Dairy
All of the local authorities and childcare settings that provide dairy milk reported providing cow’s milk, Figure 3.6. Very few settings reported providing goat milk (1%) and only one setting reported providing sheep milk.
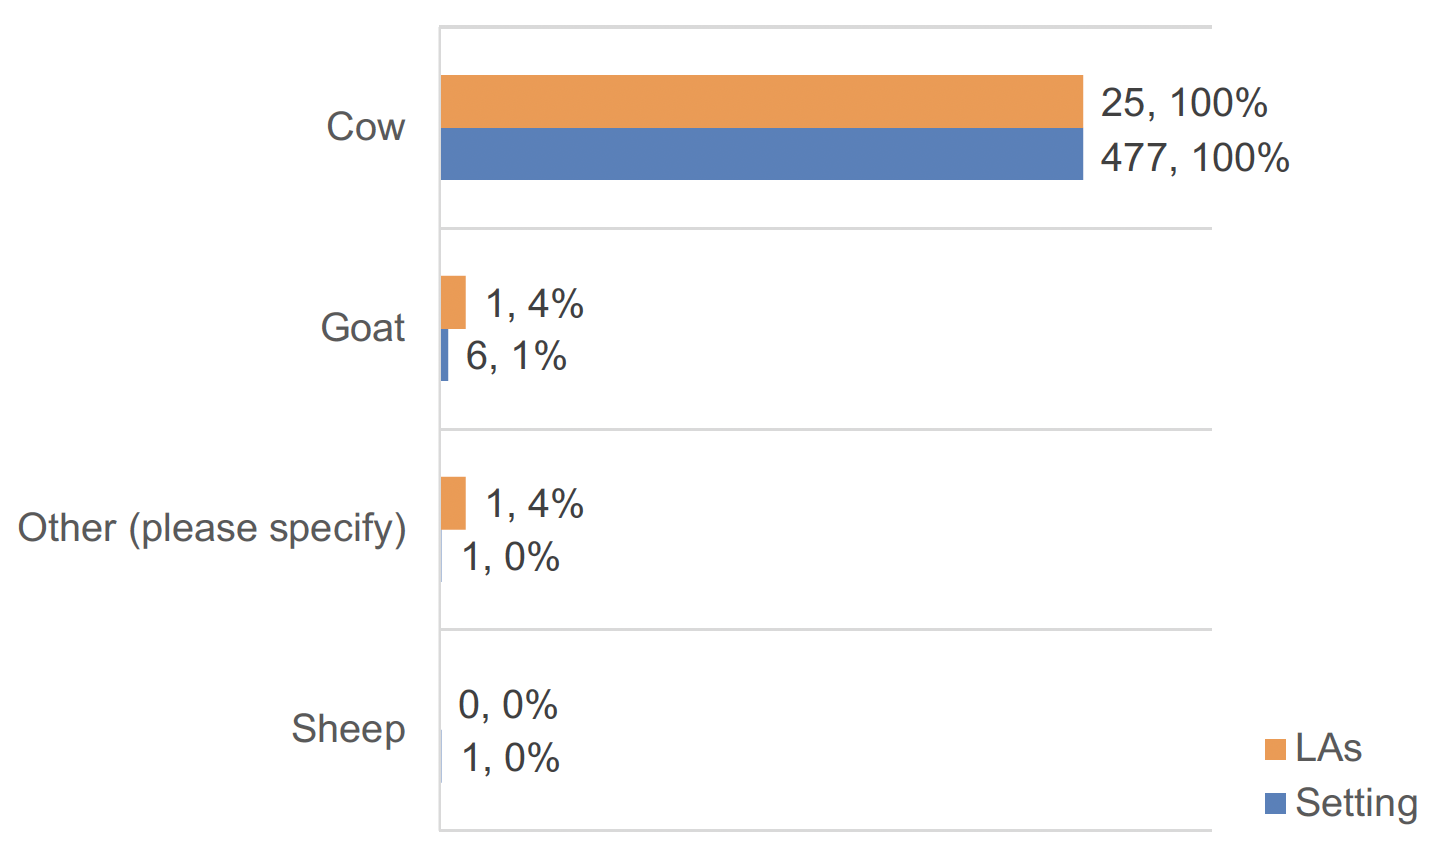
Base: Those who supply dairy milk (25; 477)
More than three quarters of childcare settings (77%) reported that they provide 200ml portions of milk, while the remaining 23% provide 189ml portions (Figure 3.7).
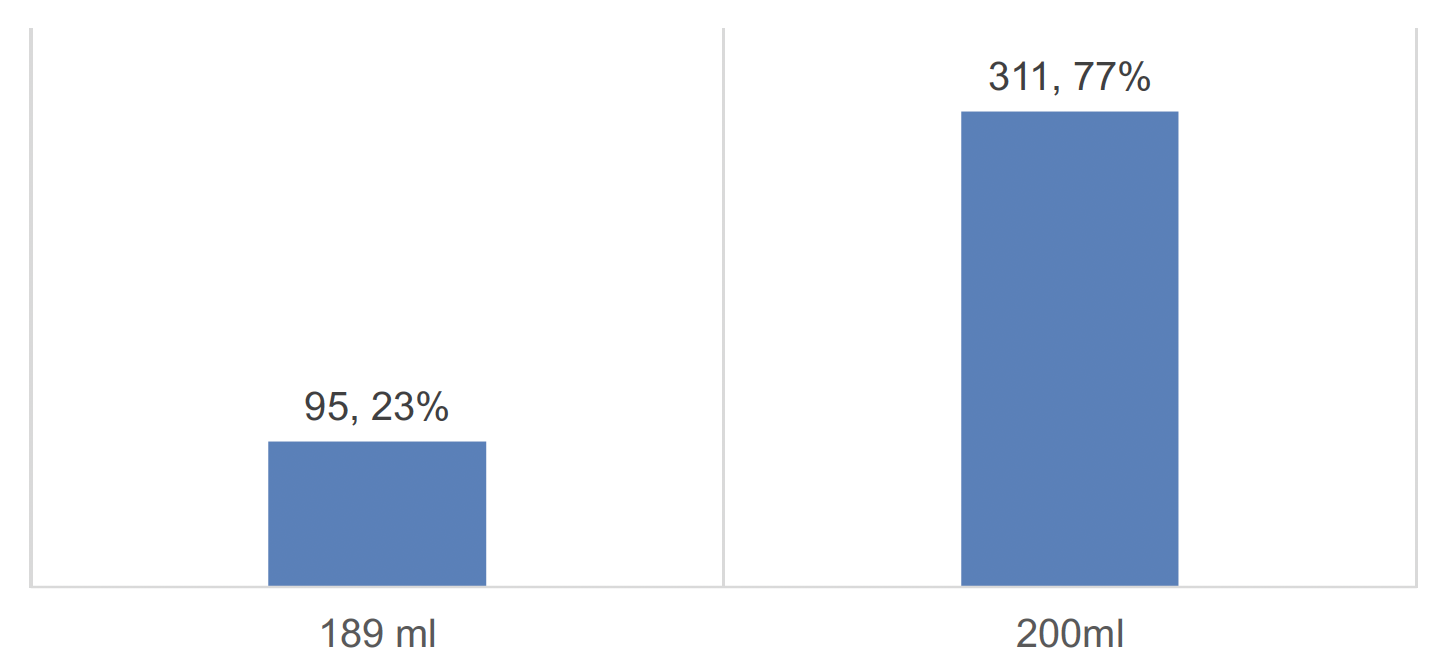
Base: Settings supplying dairy milk and provided a response (406)
Table 3.2 provides a breakdown of the milk portion sizes by different types of childcare settings. In local authority settings, a majority (68%) provide 200ml portions of milk, while 32% offer 189ml portions. In contrast, a majority of PVI settings report serving 200ml portions, with 83% offering this size compared to just 17% offering 189ml portions.
| Type of setting | Number providing 189ml portion (N) | Proportion providing 189ml portion (%) | Number providing 200ml portion (N) | Proportion providing 200ml portion (%) |
|---|---|---|---|---|
| Local Authority | 57 | 32% | 120 | 68% |
| Private, Voluntary or Independent | 37 | 17% | 187 | 83% |
| Total | 94 | 23% | 307 | 77% |
Further categorisation is provided for childminders and day care facilities (which include nurseries, playgroups, crèches, etc.). Among childminders, an overwhelming majority (89%) offer 200ml portions of milk, with only 11% offering 189ml portions. In day care settings, 72% provide 200ml portions of milk, while 28% provide 189ml portions.
| Type of setting | Number providing 189ml portion (N) | Proportion providing 189ml portion (%) | Number providing 200ml portion (N) | Proportion providing 200ml portion (%) |
|---|---|---|---|---|
| Childminder | 13 | 11% | 103 | 89% |
| Day care of children (including nurseries, playgroups, crèches etc) | 82 | 28% | 207 | 72% |
| Total | 95 | 23% | 310 | 77% |
Provision – Non-Dairy
In contrast to the provision of dairy milk, there are several non-dairy alternatives provided by both local authorities and childcare settings.
Under SMHSS, the first option for children who cannot drink dairy milks should be unsweetened calcium enriched soya drinks which are the closest nutritional equivalent to plain cow’s milk. A guide to support those selecting an unsweetened, calcium enriched soya drink is included in Annex B, page 16, of the Scottish Milk and Healthy Snack Scheme: Guidance for Local Authorities and Day Care Settings (www.gov.scot).
Oat milk is the most commonly used non-dairy alternative, provided by 14 local authorities who responded and 80% of childcare settings. Soya milk is provided by 11 local authorities and 40% of childcare settings, while fewer settings supply both almond (16%) and coconut (9%) milk.
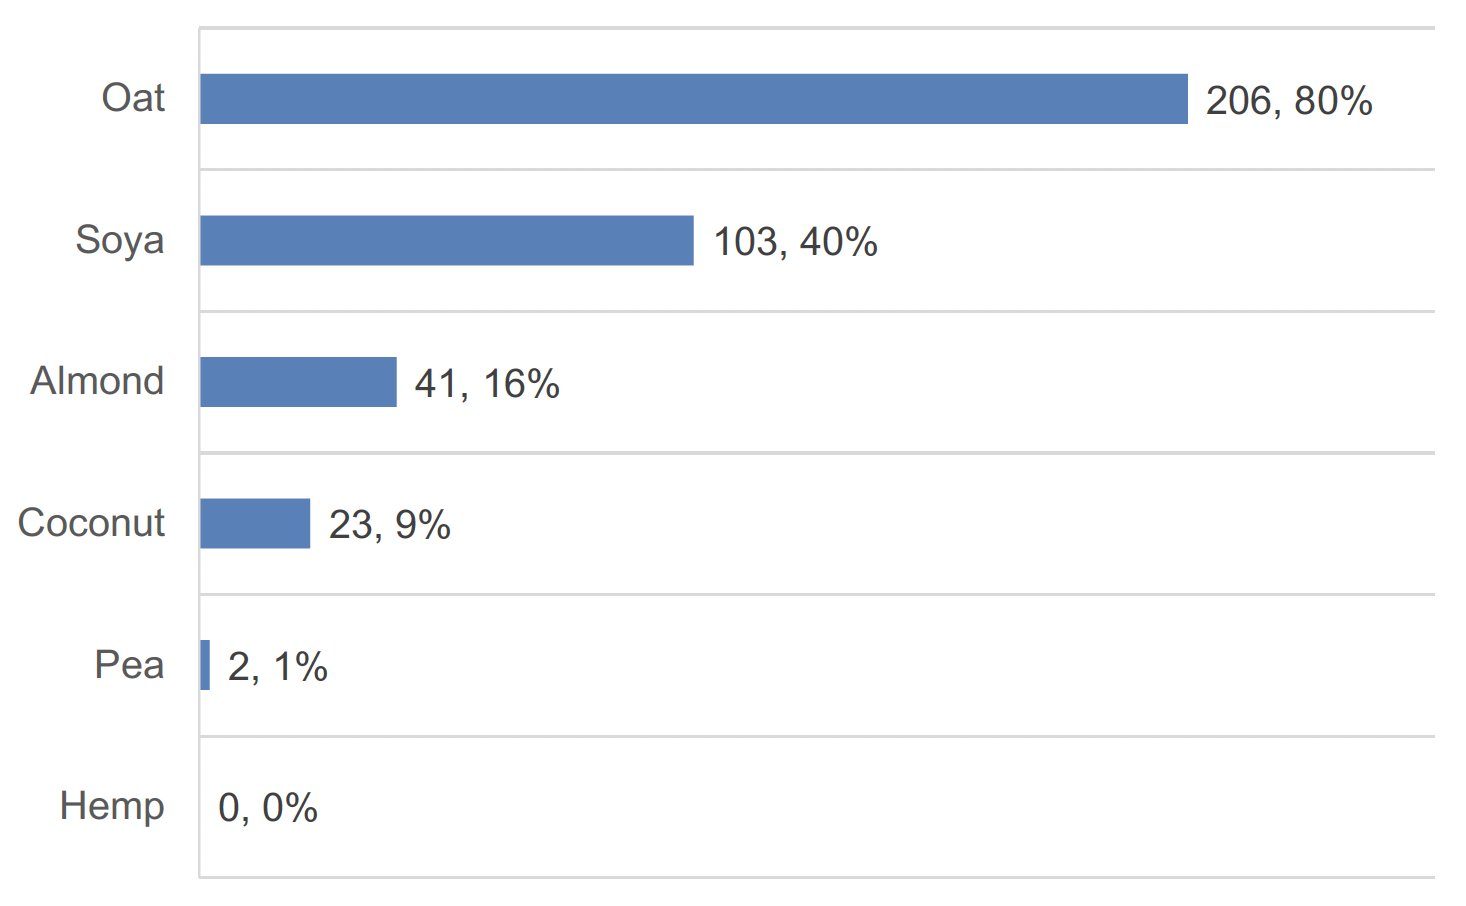
Base: Settings supplying non-dairy alternatives (258)
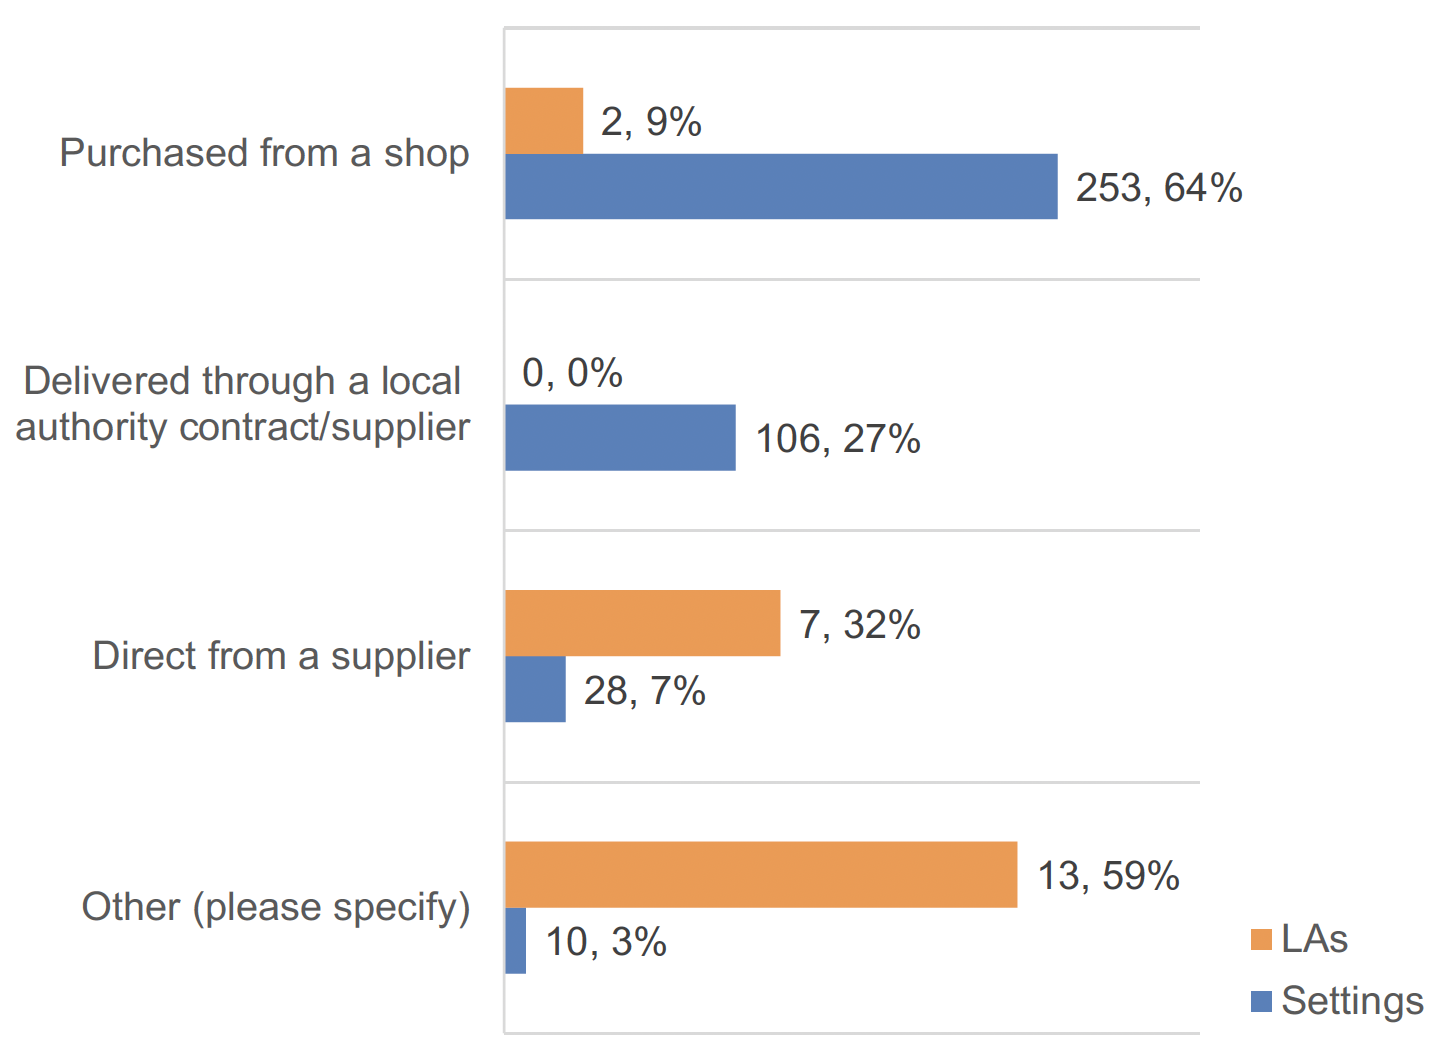
When it comes to sourcing non-dairy alternatives the most common means of sourcing these for settings is purchasing from a shop (64%) followed by delivery through a local authority supplier, Figure 3.9. Local authorities were most likely to select ‘Other’ (68%) and these responses included Scotland Excel and the fact that settings sourced their own non-dairy alternatives within their responses.
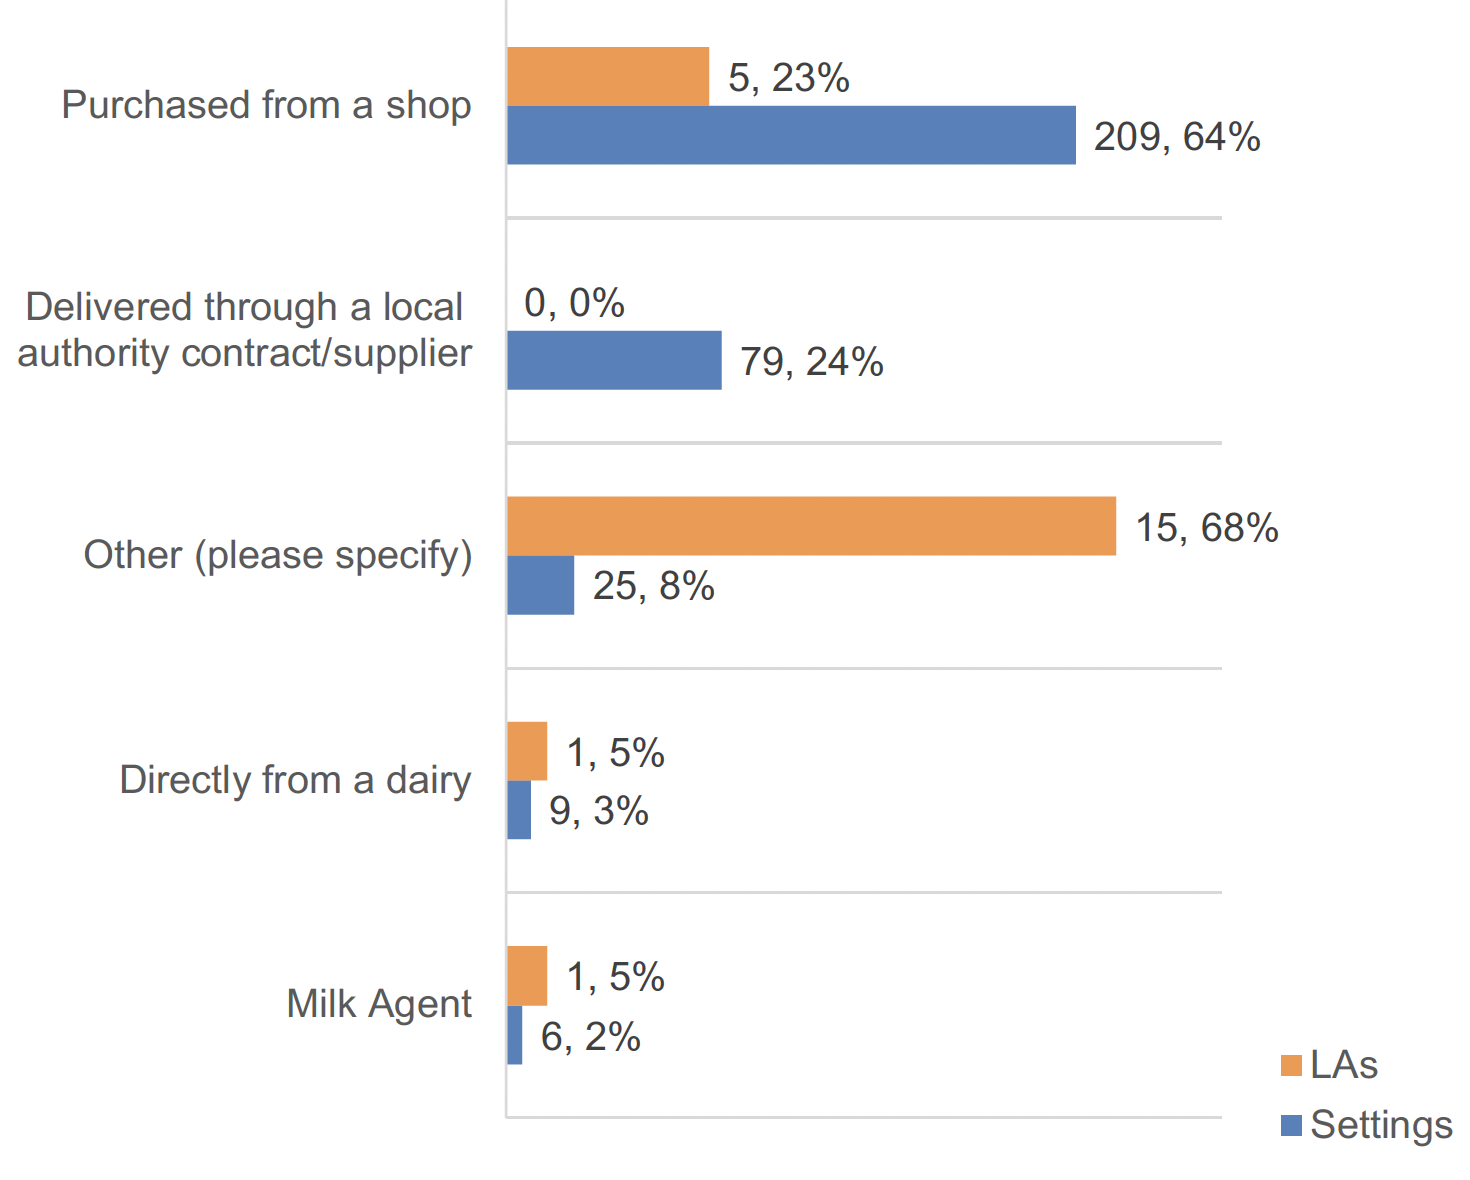
Base: LAs (23) and Settings (328) supplying non-dairy alternatives and providing a response
The majority of local authorities (56%) reported using the Soya Drink Specification to make purchasing decisions of non-dairy alternatives, Figure 3.10. However, the majority of settings said they did not use this (68%).
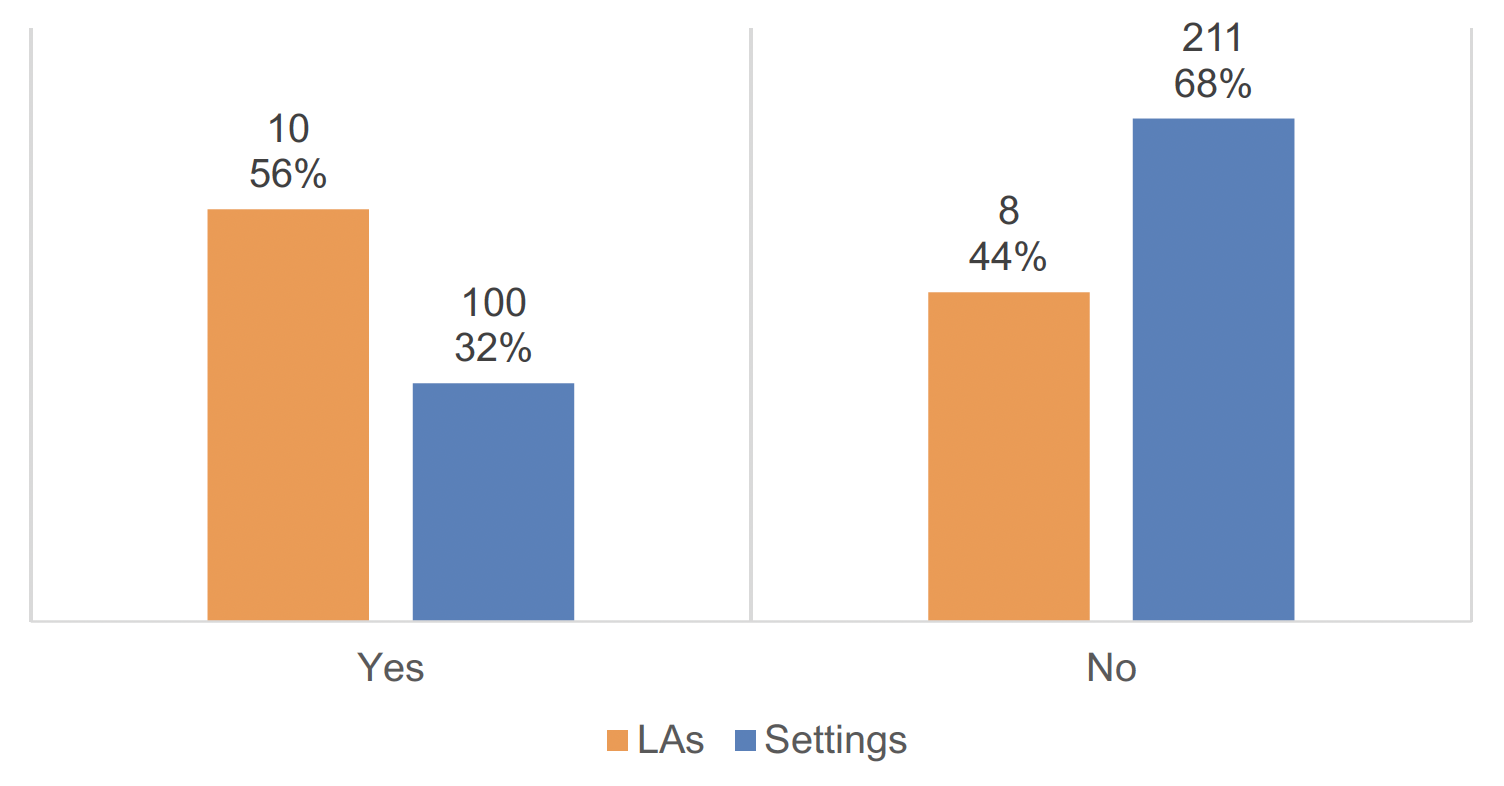
Base: LA (18) Settings providing a response (311)
When reflecting on the reasons for not using the Soya Drink Specification, local authorities reported that they allow settings to source this themselves or that their suppliers arrange it. One local authority also stated that they were unaware of the guidance.
Childcare settings reiterated that allergies to soya is a limitation to the use of this as an alternative to dairy milk. Also, some settings reported only being able to provide an alternative to cow’s milk if a medical diet action plan indicates this is necessary. The preferences of children are also taken into consideration, and oat milk is often the preferred alternative milk drink. Several settings were not aware of the guidance or did not state any reason to use a dairy alternative.
In response to the feedback gathered regarding the provision of non-dairy alternative drinks as part of the scheme, several key points have emerged from the perspectives of both childcare settings and local authorities (LAs). Childcare settings reported engaging in discussions about children's preferences, with some noting that children expressed a reluctance to consume soya alternatives. However, parents expressed gratitude for receiving free alternative milk, highlighting its costliness if purchased independently. Concerns were raised regarding the requirement of a doctor's letter for authority-provided alternatives, as this can pose logistical challenges for parents. Additionally, some settings mentioned that their supplier does not stock soya milk, indicating potential limitations in available options.
From the perspective of LAs, feedback emphasised practical considerations in the implementation of the scheme. There was recognition of the need to account for potential wastage when providing non-dairy milk in litre cartons, particularly in cases where only one child in a setting requires such alternatives. Moreover, it was noted that non-dairy alternatives are typically provided exclusively as part of a medical diet action plan, reflecting a targeted approach to addressing specific dietary requirements. These insights underscore the importance of considering both practical challenges and individual preferences in the provision of non-dairy alternatives within childcare settings.
Provision – First Infant Formula
Very few settings have children under 12 months in their care. Only 17 settings reported providing infant formula and 2 local authorities reported providing this to settings at the outset of the survey.
One local authority reported that this was purchased from a shop. Of the settings who reported providing first infant formula, 14 said they purchased this from a shop and one reported that parents supply the first infant formula.
Provision – Healthy Snack
Settings and LAs were asked to report the healthy snacks that they provided under the scheme. The types of snacks available vary across settings and are chosen based on seasonal availability and children's preferences and there is diversity in the options offered.
These include a variety of fruits such as apples, bananas, blueberries, grapes, honeydew melon, watermelon, oranges, pears, pineapples, plums, raspberries, strawberries, and cherry tomatoes. Additionally, vegetables like carrots, peppers, cucumber, and tomatoes are also provided.
Some settings also noted that they offer breadsticks, cheese, crackers, wraps, and other snack items which would be out of scope of the scheme provision, suggesting either a misunderstanding of the scope of the scheme or what the scheme is intended to provide.
Some settings noted that the cost of snacks varies widely depending on the type and source, making it challenging to determine a standard cost per portion.
The responses indicate a wide range of portion sizes for fruits and vegetables served to children, with measurements varying from grams to hand-sized portions or pieces of fruit. Some specific observations from the responses include:
- Gram Measurements: Portions range from as low as 20 grams to as high as 300 grams, with many falling between 40 grams and 100 grams.
- Hand-Sized Portions: Some responses suggest serving sizes based on what a child can hold in their hand, implying a flexible approach.
- Piece-Based Measurements: Portions are sometimes described in terms of pieces of fruit or vegetables, such as one apple, one banana, or a specific number of cherry tomatoes or cucumber sticks.
- Variability: There's a clear acknowledgment of variability, with portion sizes adjusted based on factors like children's age, preferences, and hunger levels.
Overall, the responses reflect a tailored approach to portion sizes, aiming to provide adequate nutrition while accommodating individual needs and preferences.
In addition to the varied portion sizes and flexible approaches mentioned, many responses also acknowledge the challenge of calculating exact portion sizes. Factors such as children's likes and dislikes, age, and hunger levels contribute to this variability. As a result, some respondents noted that it's difficult to provide precise measurements, and the portion sizes may vary depending on the specific circumstances of each serving. This highlights the importance of flexibility and adaptability in providing nutritious snacks to children in daycare settings.
The majority of childcare settings that provided a response stated that they currently offer a meal or snack in addition to the snack provided as part of the SMHSS (87%).
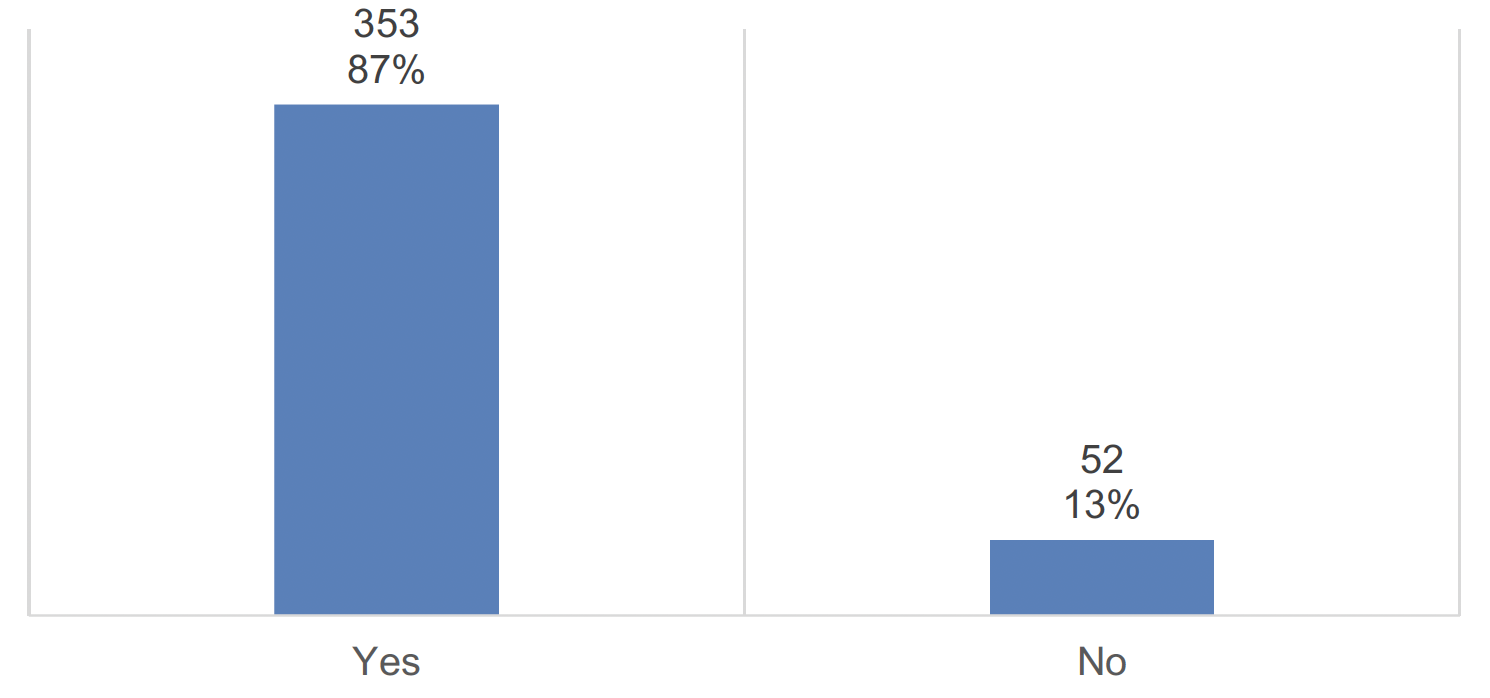
Base: Settings providing a response (405)
The vast majority of childcare settings (95%) also provided a meal or snack prior to their enrolment in the SMHSS.
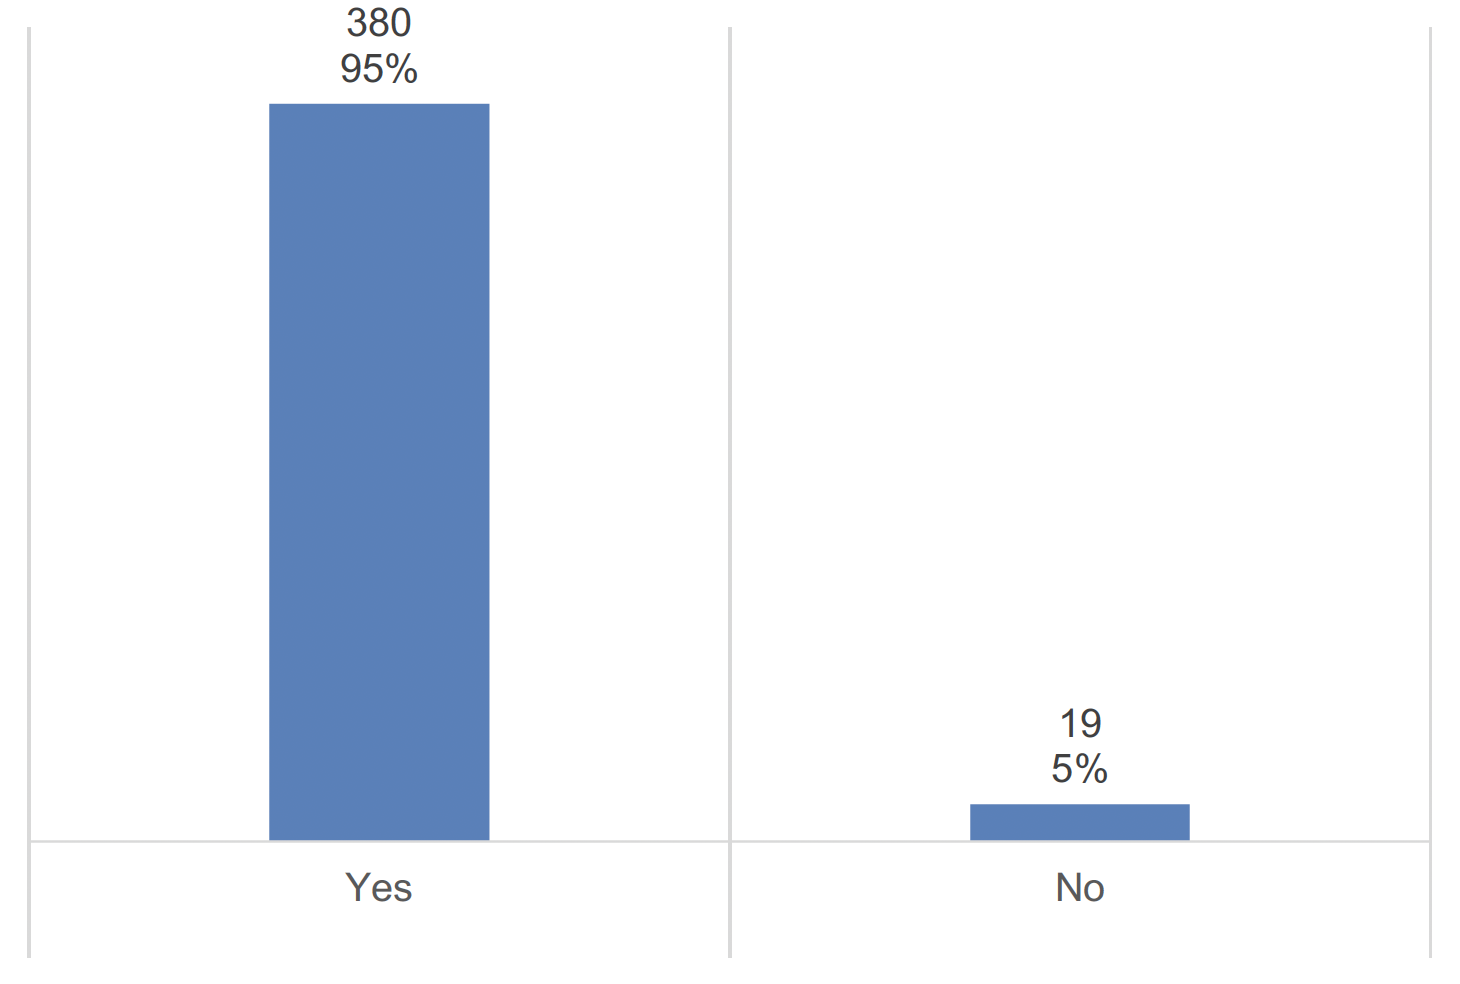
Base: Settings providing an answer (399)
Two thirds of childcare settings source their healthy snack portions from a shop (64%) while around a quarter get a delivery from a local authority contract/supplier (27%). Only 7% of settings source their healthy snacks directly from a supplier (Figure 3.13).
Base: LAs (22), Settings (397)
Contact
Email: SMHSS@gov.scot
There is a problem
Thanks for your feedback