Scottish Milk and Healthy Snack Scheme and the Scottish School Milk Scheme: data collection
Analysis of data collected on the operation of the Scottish Milk and Healthy Snack Scheme and local authority school milk schemes to support the new Scottish School Milk Subsidy Scheme.
Chapter 4: SMHSS Contracts and Costs
Contracts
Local Authorities
Single contract
Out of the 31 local authorities who responded, only eight reported operating a single contract that covers all milk, non-dairy alternatives, and first infant formula. For three out of the eight with single contracts, this also includes the provision of a healthy snack.
The contract period differs by local authority, however four out of the eight operating a single contract are tied to their agreement for 2-4 years.
Prices are not fixed for any of the local authorities operating a single contract, with prices reviewed annually for most.
Milk contracts
Overall, 14 local authorities reported having contract specifically for cow’s milk, meaning nine local authorities are not contractually tied to one supplier for any length of time. No local authorities reported having contracts for the supply of sheep’s milk, goat’s milk or first infant formula.
As with the single contract, the most common contractual length is 2-4 years, with five local authorities tied in for this length of time. However, five local authorities are contracted for a shorter period of 12 months to two years. The remaining four are committed to their supplier for at least 4 years.
Four local authorities have fixed prices for the duration of the contract. Costs are reviewed either every six months or annually.
There are seven local authority areas with a contract specifically for non-dairy alternatives. None of the prices are fixed within these contracts, and the typical length is between 2-4 years. Prices are reviewed every six months for four contracts and annually otherwise.
Healthy Snack contracts
Only seven local authorities have a contract for the supply of a healthy snack tying them to a supplier for any length of time. Three local authorities are tied to their supplier for between 2-4 years, one is committed for 12 months to 2 years while the other three are committed to their supplier for at least four years.
Prices are fixed for two out of the seven healthy snack contracts. Contracts are typically reviewed annually.
Childcare settings
Almost half of all childcare settings report that their local authority looks after all their supply contracts for the SMHSS (47%), Figure 4.1.
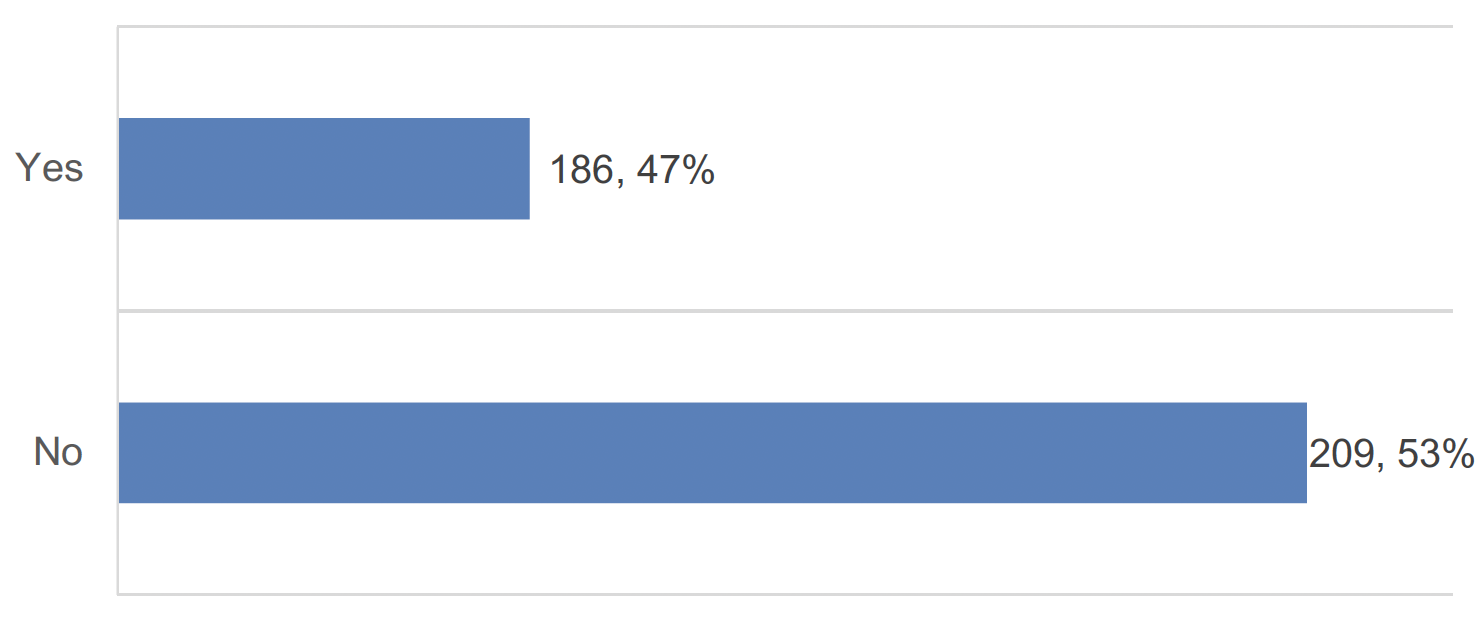
Base: Settings (395)
Six in ten settings (58%) reported that local authorities look after the costs and supply contracts for dairy milk, 42% for non-dairy alternatives and 56% for healthy snacks. Only 20% of first infant formula costs and supply contracts were reported as being managed by local authorities.
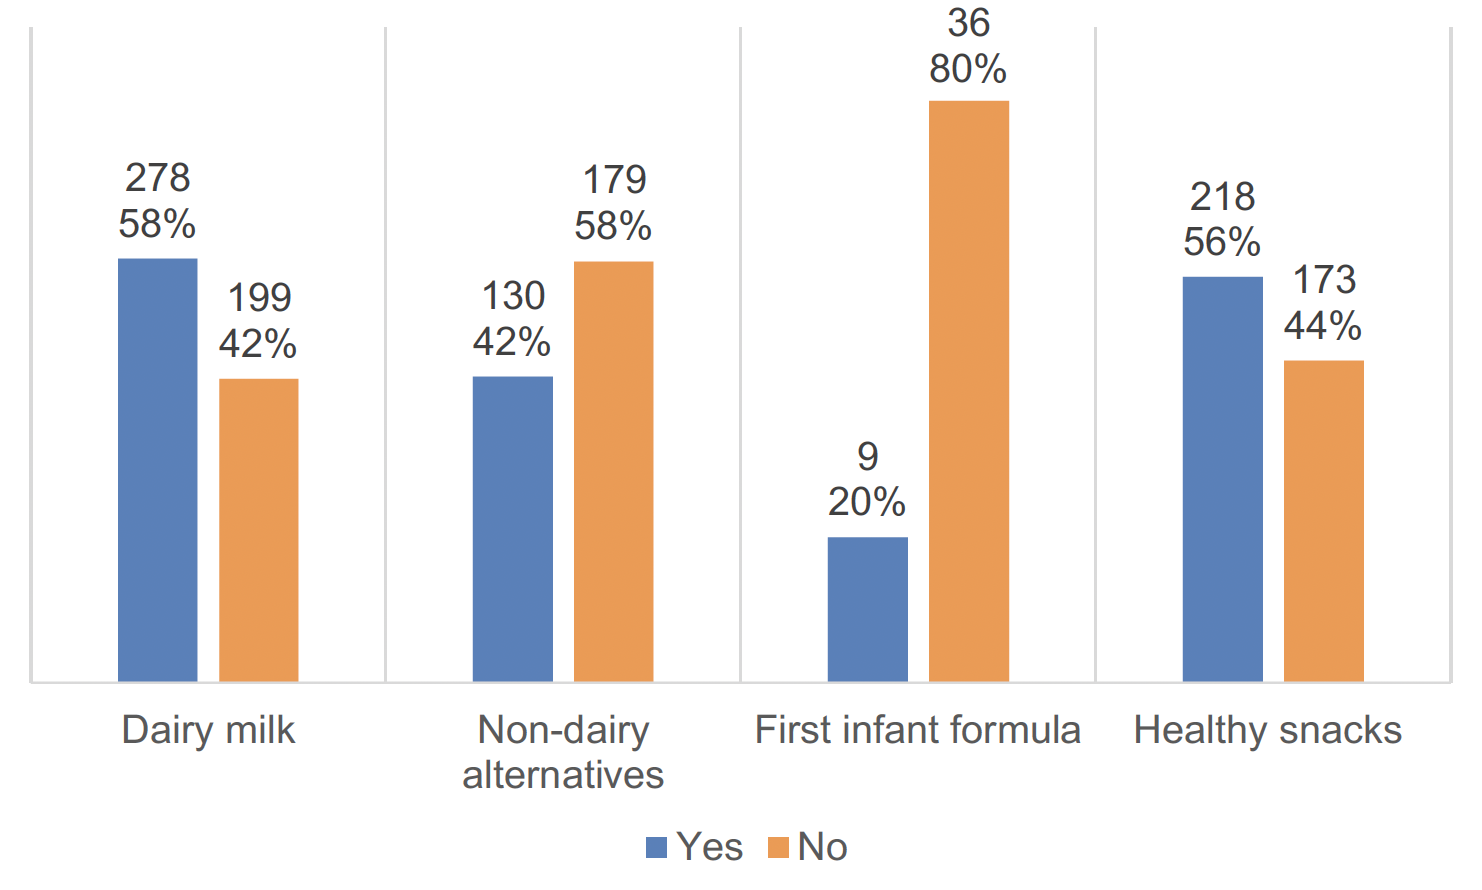
Base: Dairy milk (477), non-dairy milk (309), first infant formula (45), healthy snacks (391)
One in ten (11%) settings reported having a single contract for the supply of milk, non-dairy alternatives and first infant formula.
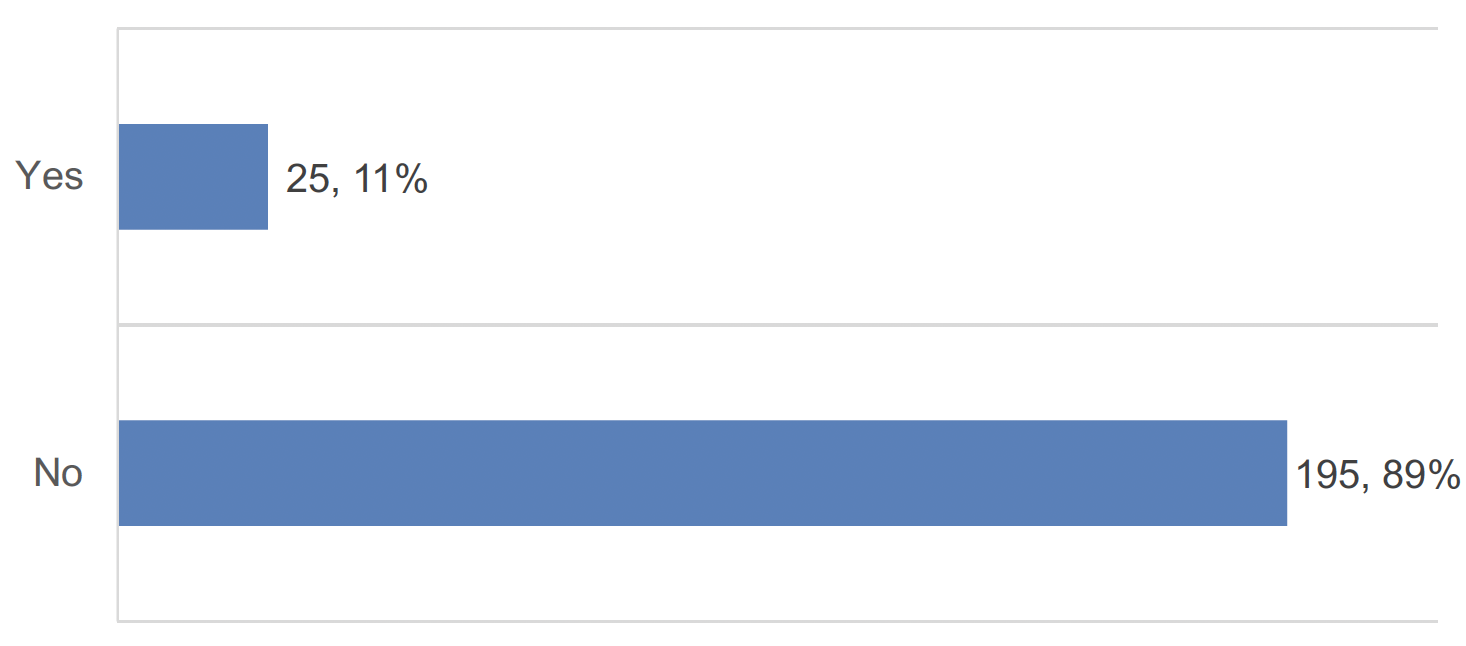
Base: Settings managing their own supply chain (220)
Only 25 settings reported having a single contract which covers the supply of milk, non-dairy alternatives and first infant formula. This contract also includes the provision of healthy snacks within seven of these settings.
The most common contract period was 12 months to two years, with 14 settings indicating this is how long they are committed to their supplier. Similarly, seven settings have fixed prices for the duration of their contract. For those who are not committed to fixed prices, these costs are mostly reviewed annually.
Similarly, only 11% of settings without a single contract have a contract for the supply of cow’s milk, Figure 4.4. However, even fewer have a contract for the supply of non-dairy alternatives (2%), sheep milk (1%) and healthy snacks (1%).
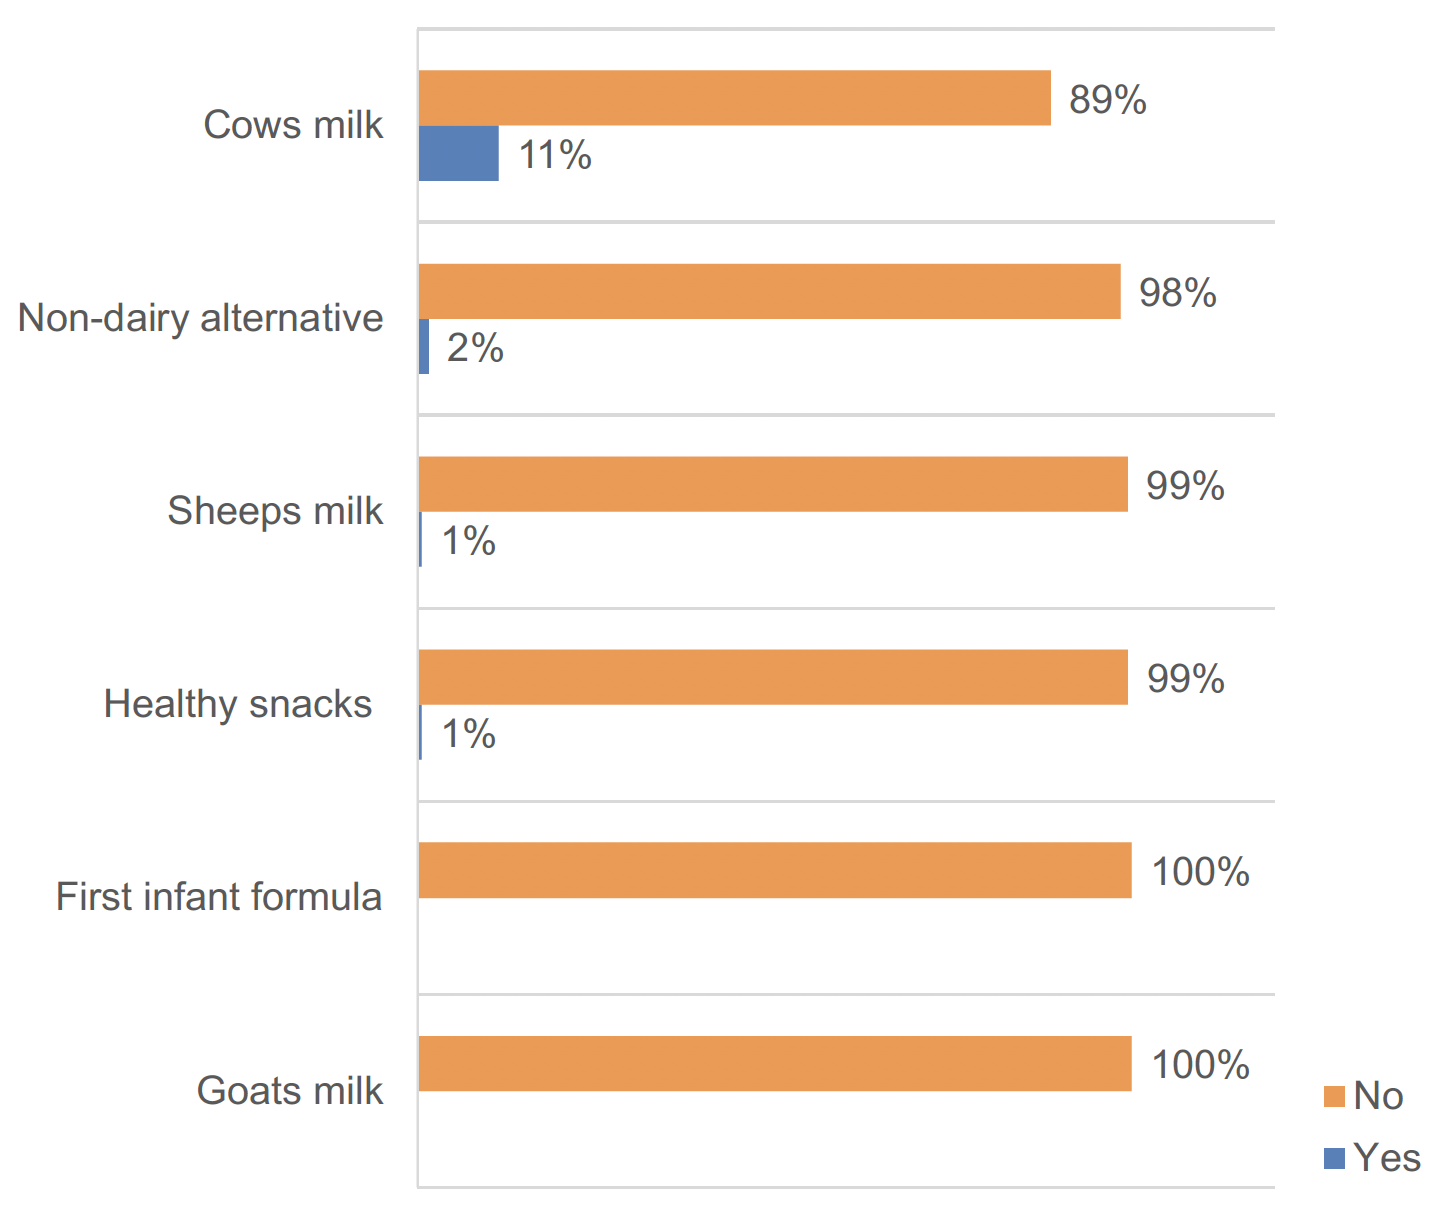
Base: Settings with no single combined or LA contract (194)
Cost analysis
This section examines data relating to costs. Data is only reported where it has been provided by a reasonable number of settings or local authorities to comment on reasonably. In the instances of local authorities, costs were not available for more niche types of dairy milk such as sheep or goat. It also should be noted that many settings did not know their costs as the local authority arranged the costs and contracts on their behalf.
Local Authorities
Local authorities were asked how costs and purchasing decisions were made for the SMHSS. Of those who responded, half (50%) noted that these were made by both local authority and individual childcare settings. This has an implication on the data collected on the contracts and costs as there is a very mixed picture in terms of how these are managed depending on a variety of factors including how they are purchased (e.g. purchasing from a shop not requiring a contract) and by type of product.
Over a quarter of LAs (27%) reported that decisions were made by the local authority and 23% reported that they were made by individual childcare settings.

Base: LAs (30)
Milk and non-dairy alternatives
The costs in Table 4.1 provide insight into the pricing range, mean, and median values for different types of milk and non-dairy alternatives provided by local authorities.
| Type of milk | Minimum | Maximum | Mean | Median |
|---|---|---|---|---|
| Semi skimmed cow’s milk (22) | £0.10 | £0.36 | £0.23 | £0.23 |
| Whole cow’s milk (22) | £0.10 | £0.38 | £0.23 | £0.23 |
| Non-dairy alternatives (13) | £0.20 | £0.46 | £0.32 | £0.35 |
Semi-skimmed and whole cow’s milk demonstrate consistent pricing, with narrow price ranges and identical mean and median values. This consistency suggests stable pricing and availability within the market.
Non-dairy alternatives had a higher average cost compared to cow’s milk options. The higher mean indicates that some non-dairy options may be priced significantly higher than others, potentially impacting affordability and accessibility for some consumers.
Due to the limited demand, no data was returned for the per-serving cost of goat or sheep’s milk. Also, no data was received on the cost to supply first infant formula.
Table 4.2 shows the prices of semi-skimmed and whole cow’s milk across different regions of Scotland, highlighting a high degree of stability. The Highland and Islands region reports the highest prices for both types of milk, with semi-skimmed milk at £0.28 and whole milk at £0.29.
The Edinburgh and Lothians, and Tayside, Central, and Fife regions have lower mean prices but higher median prices, indicating some price variations within those regions. Glasgow and Strathclyde and Scotland South display stable and slightly higher prices, respectively, with minimal variation between mean and median values.
| Region | Semi skimmed cow’s milk: Mean portion cost | Semi skimmed cow’s milk: Median portion cost | Whole cow’s milk: Mean portion cost | Whole cow’s milk: Median portion cost |
|---|---|---|---|---|
| Aberdeen and North East | £0.21 | £0.21 | £0.21 | £0.21 |
| Edinburgh and Lothians | £0.19 | £0.23 | £0.19 | £0.23 |
| Glasgow and Strathclyde | £0.24 | £0.25 | £0.25 | £0.25 |
| Highland and Islands | £0.28 | £0.28 | £0.29 | £0.29 |
| Scotland South | £0.26 | £0.26 | £0.26 | £0.26 |
| Tayside, Central and Fife | £0.21 | £0.23 | £0.21 | £0.23 |
Table 4.3 outlines the services included in the milk unit price received by various local authorities. Delivery service is prevalent, with 17 authorities reporting it for milk and 11 for non-dairy alternatives. Only one authority reported that beakers were included in their service, while two reported jugs or serving vessels.
Notably, five authorities reported that they do not receive any of the listed services for milk, whereas eight reported receiving none for non-dairy alternatives.
| Service | Number of local authorities: Milk (N) | Number of local authorities: Non-dairy alternatives (N) |
|---|---|---|
| Delivery | 17 | 11 |
| Beakers | 1 | 0 |
| Jugs or serving vessels | 2 | 1 |
| Fridge / storage space | 1 | 1 |
| None of the above | 5 | 8 |
Childcare settings
Table 4.4 presents the per portion cost data for various milk and alternative products offered within settings, including their range, mean, and median values. This cost data shows that:
- The mean and median costs for both types of cow’s milk are relatively low compared to other options.
- Goat’s milk options demonstrate higher variability in cost, with wider ranges and higher mean values compared to cow’s milk.
- Semi-skimmed and whole goat’s milk have identical ranges and mean values, indicating consistency in pricing.
- Sheep milk options show moderate variability in cost, with relatively narrow ranges.
- Both semi-skimmed and whole sheep milk have similar mean values, with slightly higher median values for whole sheep milk.
- Non-dairy alternatives exhibit the widest range of costs among all options, with the highest mean and median values. The substantial range suggests significant variation in pricing across different non-dairy products.
- First infant formula stands out as the most expensive option, with a wide range and significantly higher mean and median values compared to other products.
The cost data revealed significant variability across different milk and alternative products, with non-dairy options generally being more expensive than dairy products.
While cow’s milk tends to be less expensive, goats and sheep milk, along with non-dairy alternatives and first infant formula, are notably more expensive. This variation may impact the affordability and accessibility of these products for settings.
| Item | Minimum | Maximum | Mean | Median |
|---|---|---|---|---|
| Semi skimmed cow’s milk (60) | £0.06 | £1.60 | £0.27 | £0.17 |
| Whole cow’s milk (72) | £0.12 | £2.16 | £0.31 | £0.22 |
| Semi skimmed goat’s milk (6) | £0.40 | £2.15 | £0.76 | £0.49 |
| Whole goat’s milk (6) | £0.40 | £2.15 | £0.76 | £0.49 |
| Semi skimmed sheep milk (4) | £0.10 | £0.58 | £0.27 | £0.25 |
| Whole sheep milk (3) | £0.10 | £0.58 | £0.33 | £0.40 |
| Non-dairy alternative (98) | £0.10 | £3.58 | £0.59 | £0.40 |
| First infant formula (21) | £0.72 | £12.00 | £1.29 | £1.20 |
Table 4.5 and Table 4.6 breaks down the costs of dairy milk by the type of setting in terms of whether they are a childminder or daycare setting.
| Setting | Semi skimmed cow’s milk | Whole cow’s milk | Non-dairy alternative |
|---|---|---|---|
| Childminder | £0.31 | £0.35 | £0.60 |
| Day care of children | £0.25 | £0.30 | £0.59 |
| Setting | Semi skimmed cow’s milk | Whole cow’s milk | Non-dairy alternative |
|---|---|---|---|
| Childminder | £0.26 | £0.30 | £0.50 |
| Day care of children | £0.15 | £0.15 | £0.40 |
Table 4.7 and Table 4.8 breaks down the costs of dairy milk by the type of setting in terms of whether they are a local authority or PVI setting. Note, that one setting who provided milk costs did not identify whether they were an LA or PVI setting hence the slight differences in total means from Table 4.4.
| Setting | Semi skimmed cow’s milk | Whole cow’s milk | Non-dairy alternative |
|---|---|---|---|
| LA Setting[11] | - | - | £0.56 |
| PVI Setting | £0.25 | £0.28 | £0.59 |
| Semi skimmed cow’s milk | Whole cow’s milk | Non-dairy alternative | |
|---|---|---|---|
| LA Setting[12] | - | - | £0.29 |
| PVI Setting | £0.16 | £0.20 | £0.40 |
Healthy snacks
After removing outliers and snacks that were not fruit or vegetables from the data, the mean cost of healthy snacks reported by settings was £0.27 and the median cost was £0.20.
When looking only at fruit, the mean cost was £0.27 and the median cost was £0.20. There is some variation in costs evident depending on the type of fruit. For example, the mean cost of strawberries was £0.57 compared to a mean cost of £0.24 for apples and £0.21 for bananas reported in the data.
When looking at vegetables, the mean cost reported £0.25 and the median cost was £0.20.
There were fewer costs provided by local authorities as many settings managed the sourcing of healthy snacks themselves. The mean cost for all healthy snacks was £0.25 and the median was £0.23 for local authorities.
The mean cost for fruit provided by local authorities was £0.26 and the median was £0.24. For vegetables the mean cost was £0.21 and the median was £0.19.
Contact
Email: SMHSS@gov.scot
There is a problem
Thanks for your feedback