Neonatal intensive care unit services - demand and capacity modelling: final report
This report outlines this modelling approach, inputs, and interpretation of the outputs to support the future of neonatal intensive care unit (NICU) services.
3. Baseline Summary
Analysis of collected neonatal data was undertaken and tested with strategic and operational stakeholders as a key first step in the creation of a validated baseline for modelling, feedback was collated and used to update the baseline and ensure reliable and appropriate interpretation of the data. This section of the report outlines a summary of this exercise to highlight how this analysis has shaped the model baseline and assumptions.
3.1 Activity
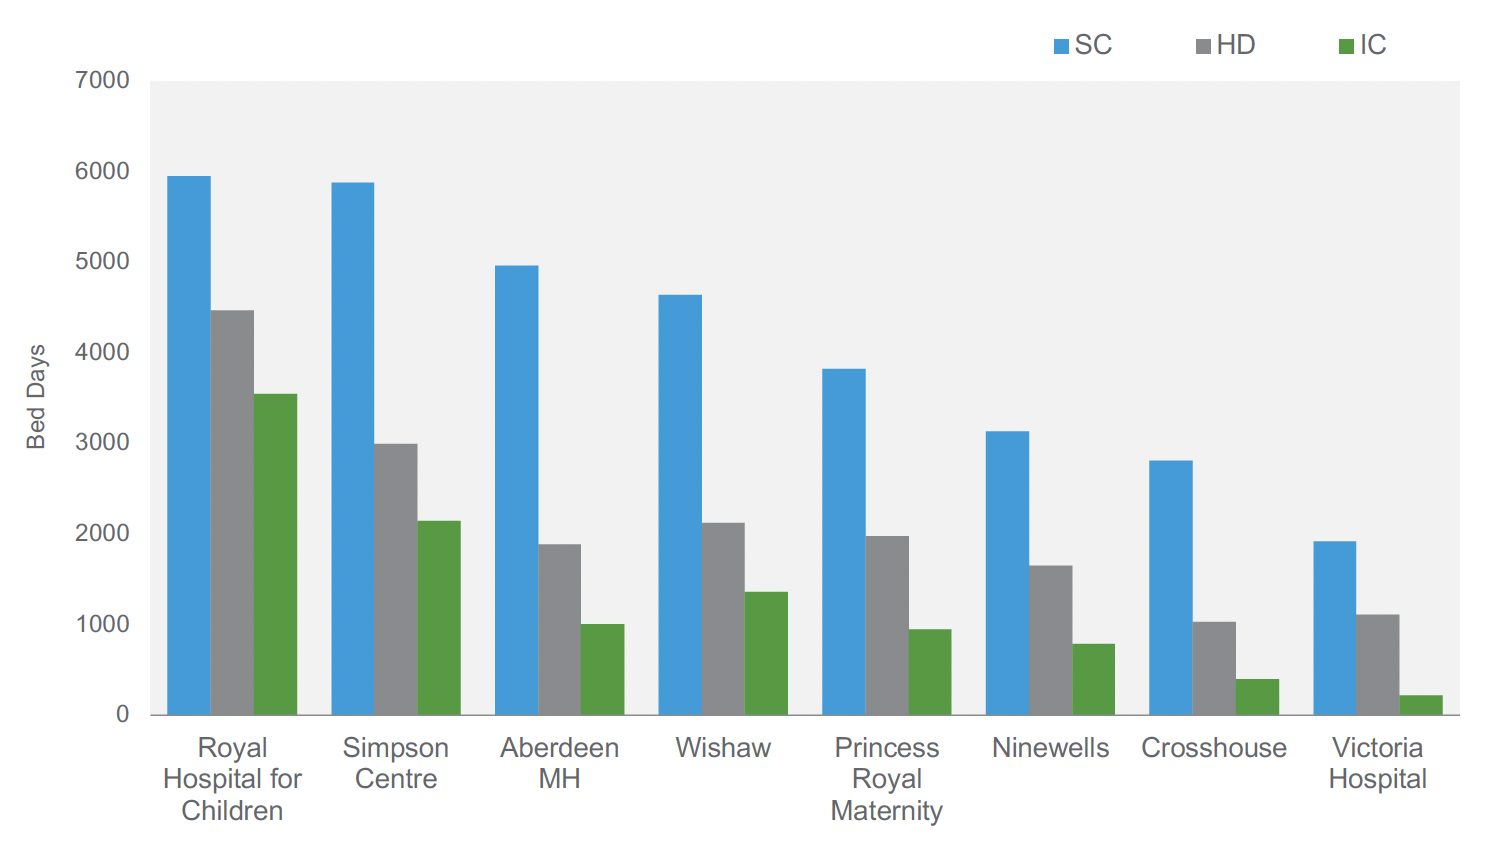
Across Aberdeen Maternity Hospital, Simpson Centre (Edinburgh), and Royal Hospital for Children (Glasgow), there were a total of 6,699 IC care days over the year to September 2023. This is approximately 64% of the total ICU care days across the current NICU sites. Four units saw overall care days decrease between 2022 and 2023. The largest units (Royal Hospital for Children and Simpson Centre) saw increases. Activity (admissions) has generally followed a similar pattern indicating a relatively consistent length of stay over time.
3.1.1 Gestation
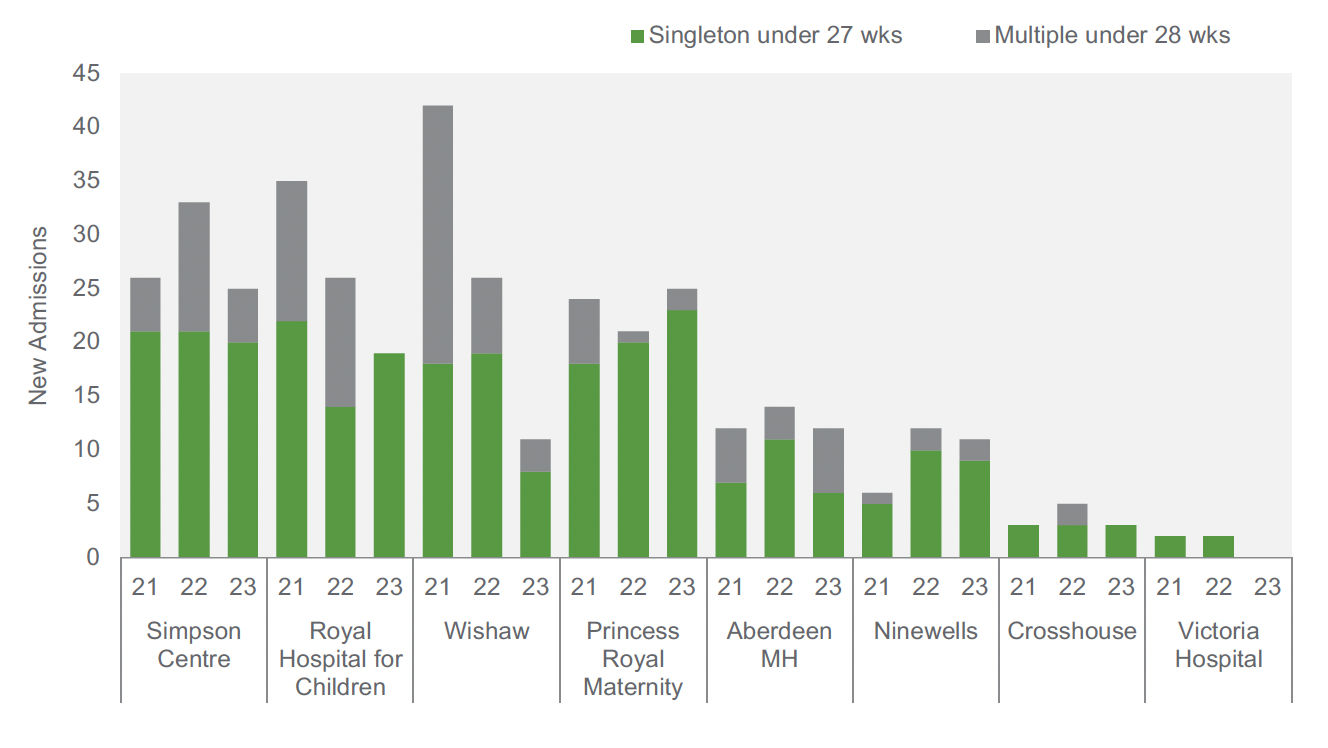
Figure 4 below identifies new admissions into each unit (based on a day of life recorded as less than or equal to one). There were 284 new singleton admissions across the eight sites, and 110 multiple admissions over the three-year period from October 2021 to September 2023.
Analysis has shown a peak in activity observed in the fourth quarter (Q4) of 2021, but beyond this generally based on the data provided, there is sufficient stability to use the most recent twelve-month period as the model baseline. The exception is Wishaw who saw fewer new pre-term admissions in October 2022 to September 2023 compared to the same period in previous years, particularly compared against the peak in 2020/21. Based on discussions with Wishaw, there was no explainable reasons for this trend, and it had not continued in more recent months - based on this local intelligence it was agreed that the future modelling be based on a baseline of Sept 21 – Oct 22 (which represents a midpoint) to account for this, for the Wishaw site only.
3.1.2 Birth weight
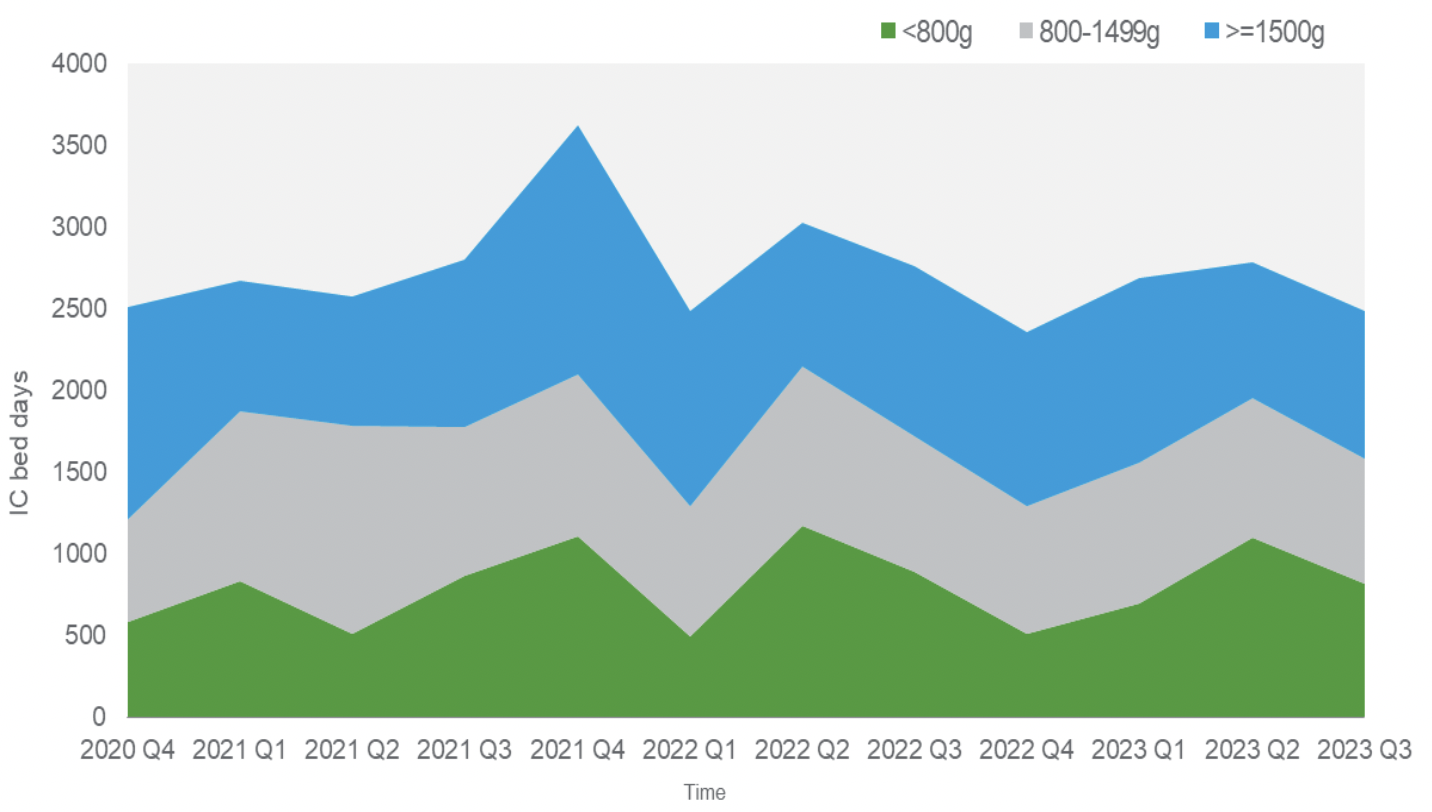
Across the eight units over the last three years there were 957 new admissions in the 800g–1499g birth weight range and 310 in the sub-800g birth weight range. Despite the small volumes, low birth weight categories consume similar intensive care days compared to the >=1500g birth weight category, as evidenced by Figure 5, below.
3.1.3 Sickest babies
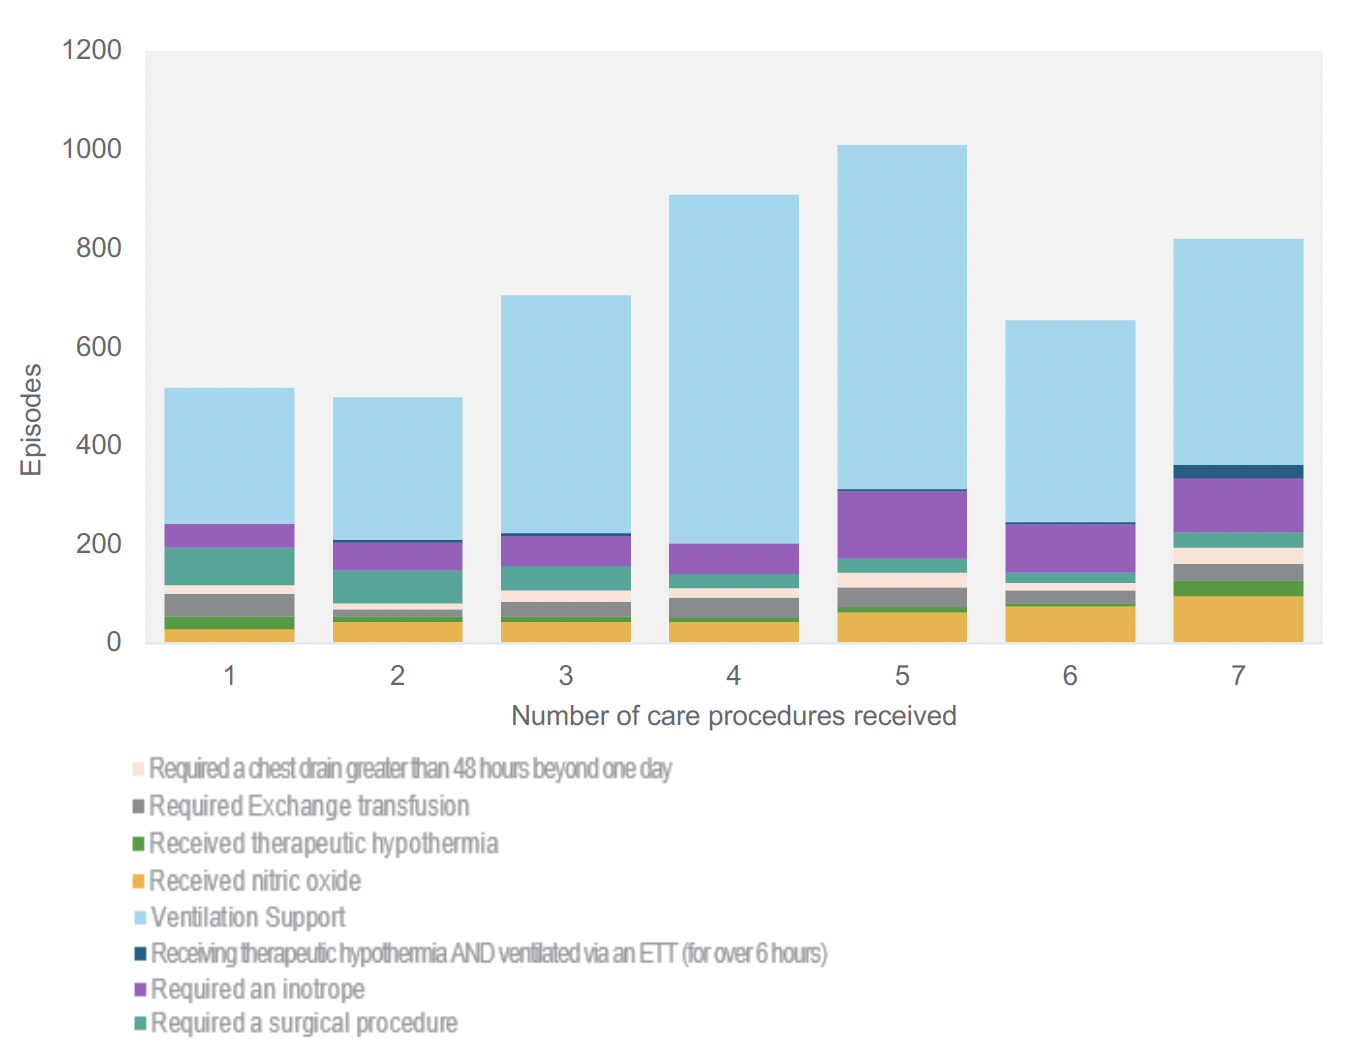
For the purposes of our modelling of impacts we worked with clinicians to identify a data definition for those considered to be the sickest babies to help us understand the levels of care that these babies receive, informed by the Best Start Criteria.
The data capture does not allow us to fully identify each episode of care that would align with the sickest cohort however criteria have been flagged within the activity data as potential proxies (in combination) to estimate the size of this cohort. The chart below illustrates the volumes of treatments received against the number of criteria where this could be identified across the eight units. Babies within Neonatal intensive care are likely to receive a number of interventions during their stay, and we have utilised this information to help define and model the size of the sickest cohort.
3.1.4 Overall cohort size
Based on the data definitions for the smallest and sickest babies, the baseline volumes seen are as follows. The baseline days at identified future LNU sites will proportionately move to the closest available NICU site in the future.
| Pre Term Gestation Cohort | ||
|---|---|---|
| Future designation | 3 Identified NICUs | 5 Identified LNUs |
| IC Days in Cohort | 2,256 | 997 |
| HD Days in Cohort | 2,433 | 1,393 |
| SC Days in Cohort | 867 | 420 |
| Low Weight Cohort (not Including pre term Gestation) | ||
|---|---|---|
| Future designation | 3 Identified NICUs | 5 Identified LNUs |
| IC Days in Cohort | 441 | 609 |
| HD Days in Cohort | 455 | 558 |
| SC Days in Cohort | 235 | 301 |
| Sick Baby Cohort (not including low weight / pre term) | ||
|---|---|---|
| Future designation | 3 Identified NICUs | 5 Identified LNUs |
| IC Days in Cohort | 2,173 | 829 |
| HD Days in Cohort | 2,003 | 877 |
| SC Days in Cohort | 1,620 | 1,135 |
| Extended IC Stay Cohort (not including above ) | ||
|---|---|---|
| Future designation | 3 Identified NICUs | 5 Identified LNUs |
| IC Days in Cohort | 260 | 275 |
| HD Days in Cohort | 295 | 293 |
| SC Days in Cohort | 478 | 637 |
| Combined NICU Cohort | ||
|---|---|---|
| Future designation | 3 Identified NICUs | 5 Identified LNUs |
| IC Days in Cohort | 5,129 | 2,710 |
| HD Days in Cohort | 5,186 | 3,120 |
| SC Days in Cohort | 3,200 | 2,493 |
3.2 Capacity
The chart below shows the current total number of cots available at each of the eight sites[4]. This represents the designated physical capacity available, independent of staff capacity, which is an important point given that we have heard that operationally, the staffing of these cots is seen as the most common reason for lack of capacity (rather than cot availability).
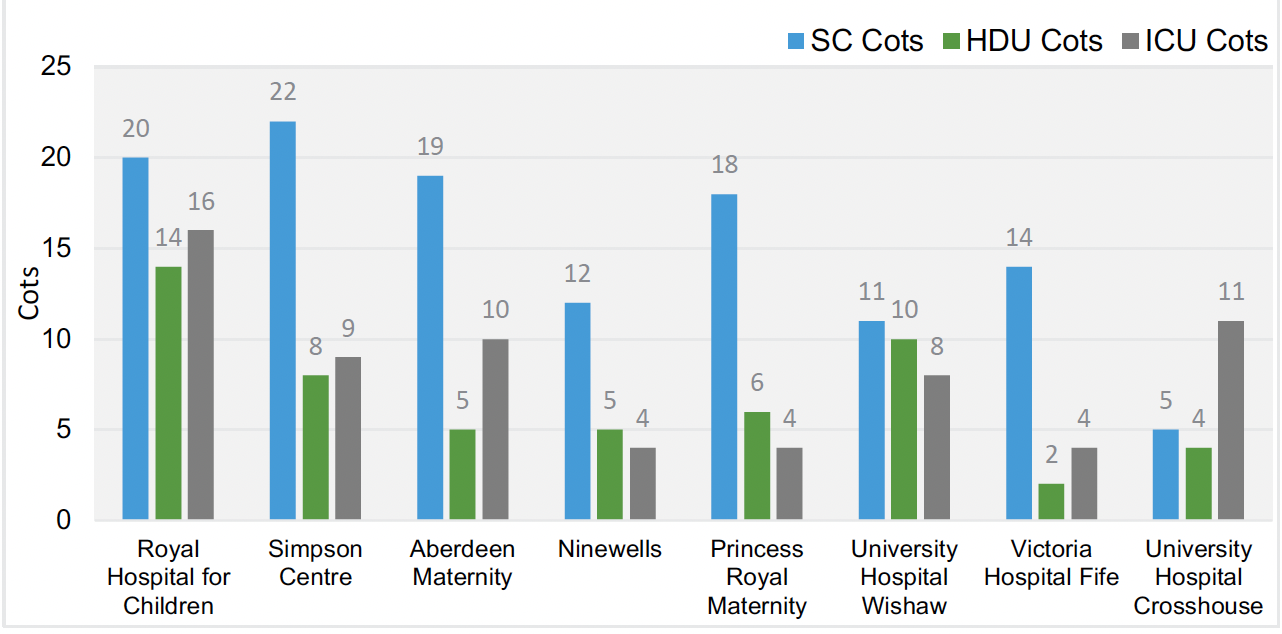
Most units operate capacity with a degree of fluidity between each level of care, this is apparent when analysing current utilisation of this capacity, as the data illustrates a tendency to ‘over-utilise’ HD cots, which is a reflective of most units not having designated HD cots but providing HD level care either in the IC or SC areas of their units.
Overall unit occupancies vary from approximately 55% to 80% compared against designated available physical capacity. Although the cots are used flexibly, gaining an understanding of capacity required at each level (based on agreed future average occupancy) should be considered in modelling of future requirements, which will also inform required staffing.
| Unit Occupancy | ICU | HDU | SCU | Combined |
|---|---|---|---|---|
| Aberdeen Maternity | 28% | 103% | 72% | 63% |
| Royal Hospital for Children | 61% | 87% | 86% | 78% |
| Simpson Centre | 65% | 103% | 73% | 75% |
| Ninewells | 54% | 151% | 61% | 81% |
| Princess Royal Maternity | 65% | 90% | 58% | 75% |
| Victoria Hospital Fife | 15% | 152% | 38% | 54% |
| Wishaw | 58% | 54% | 106% | 70% |
| Crosshouse | 22% | 70% | 70% | 55% |
3.3 Transfers
Throughout Scotland, babies are transferred both in and ex utero by ScotSTAR and the Scottish Ambulance service. The below tables provide a summary on the number of in and ex utero transfers each hospital received between October 2021 and September 2023. Note: this activity is also included in the previous activity and capacity data shared by units.
| Ex utero[5] | In utero | |||||||||
|---|---|---|---|---|---|---|---|---|---|---|
| Units | Uplift (for additional care) | Lack of Resources / Capacity | Repatriation | Out-patients | Other | Lack of Capacity | Clinical reasons | Clinical and capacity | No reason recorded | Total |
| Aberdeen MH | 105 | 1 | 90 | 10 | 1 | 1 | 21 | 19 | 4 | 252 |
| Ninewells | 16 | 5 | 83 | 0 | 1 | 2 | 24 | 34 | 2 | 167 |
| Princess Royal Maternity | 34 | 11 | 97 | 3 | 0 | 6 | 54 | 43 | 7 | 255 |
| Royal Hospital for Children | 818 | 11 | 26 | 20 | 9 | 1 | 63 | 21 | 6 | 975 |
| Simpson Centre | 148 | 0 | 55 | 0 | 6 | 8 | 61 | 47 | 6 | 331 |
| Crosshouse | 19 | 9 | 107 | 0 | 0 | 5 | 14 | 16 | 2 | 172 |
| Wishaw | 50 | 16 | 185 | 2 | 0 | 8 | 46 | 39 | 6 | 352 |
| Victoria Hospital | 11 | 12 | 73 | 0 | 1 | 3 | 14 | 24 | 0 | 138 |
Contact
Email: thebeststart@gov.scot
There is a problem
Thanks for your feedback