Neonatal intensive care unit services - demand and capacity modelling: final report
This report outlines this modelling approach, inputs, and interpretation of the outputs to support the future of neonatal intensive care unit (NICU) services.
5. Modelled impacts
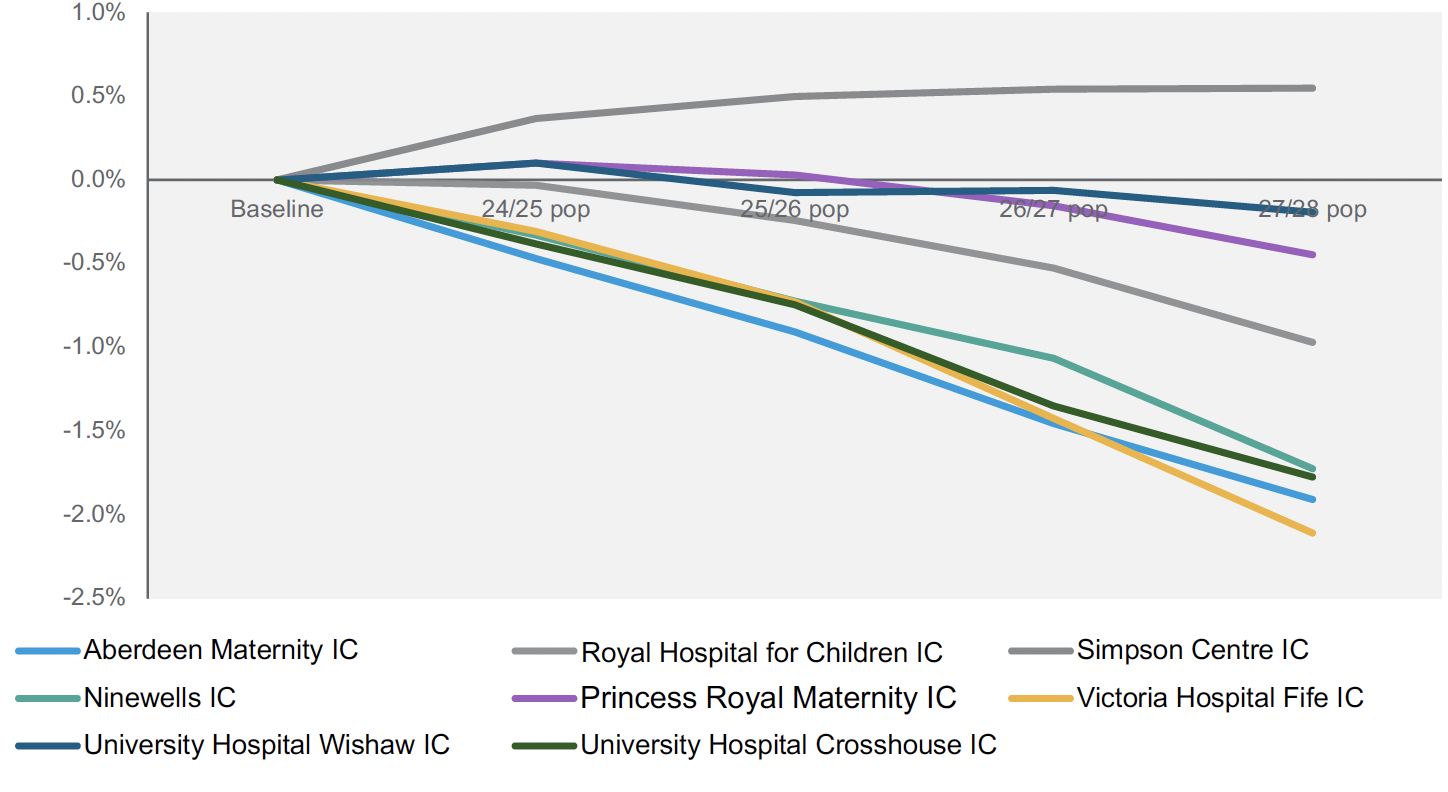
5.1 Demographic projections
Population projections vary by local authorities for the age 0 age group with the highest in Midlothian (plus 5% over 5 years) and the lowest in the Shetland Islands (minus 7% over 5 years), and a Scotland average of minus 1% over 5 years. The impact of applying demographic projections is a therefore a slight reduction in expected demand over time for most units, with the exception being the Simpson Centre given the expected growth in the catchment population for Neonatal services.
5.2 Scenario outputs
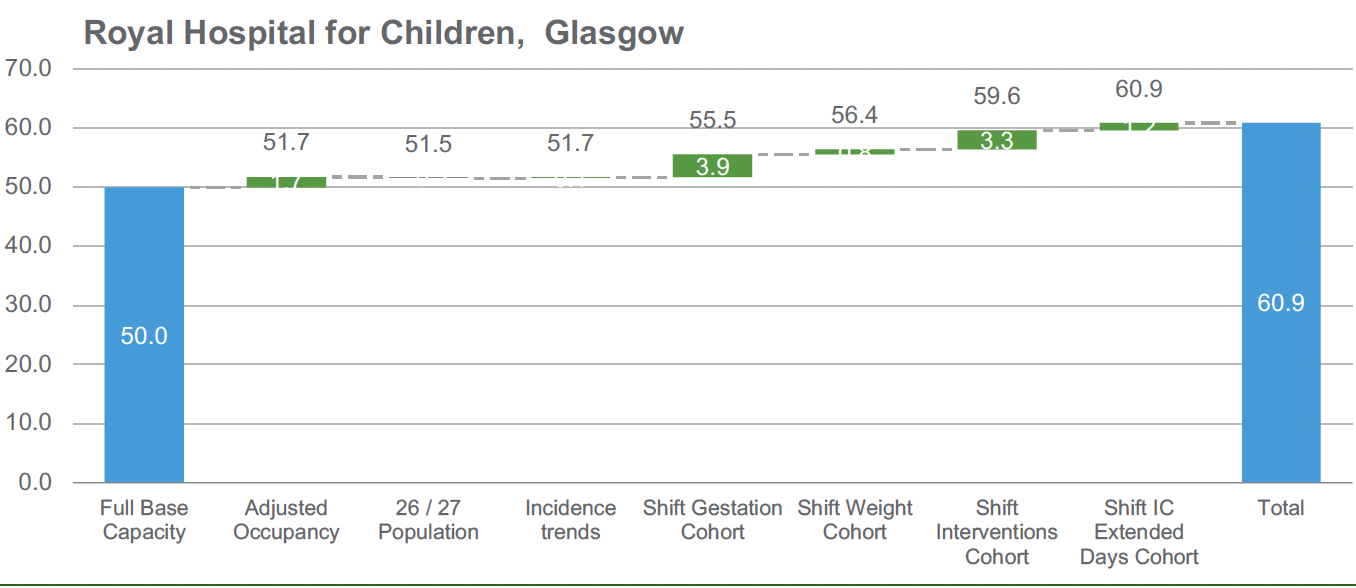
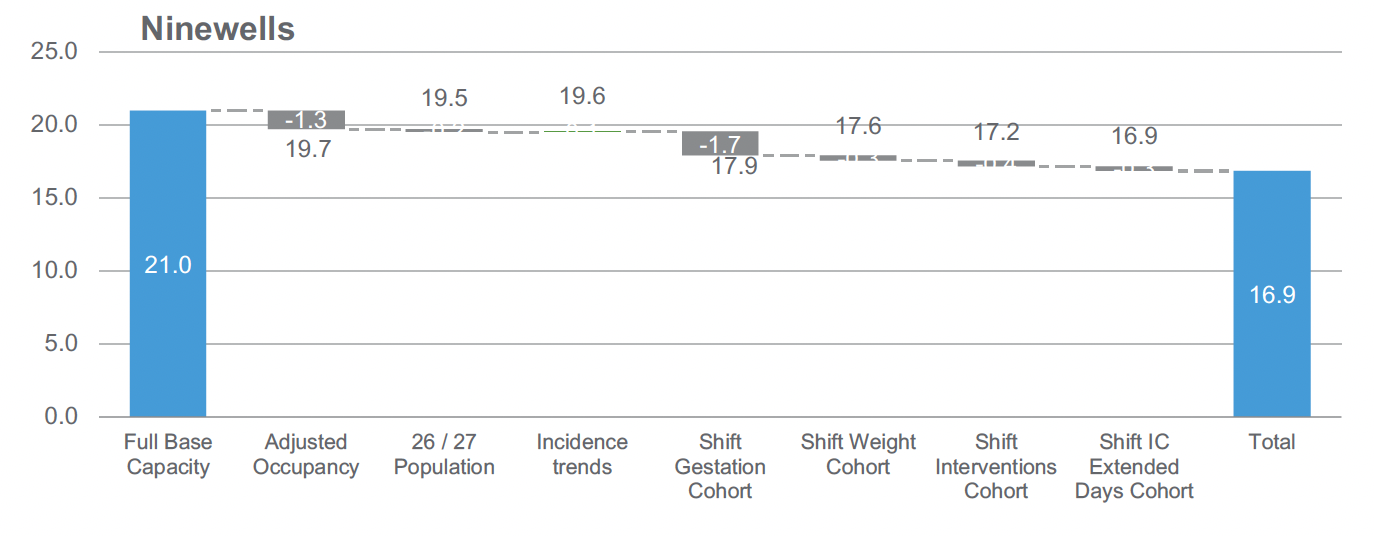
The following waterfall charts illustrate the impact of each modelled scenario for each unit. Each chart includes the following steps:
- Declared Capacity - (Full Base capacity) this is the total available physical capacity in the baseline period (irrespective of whether this capacity has been utilised or fully staffed).
- Required Capacity - (Adjusted Occupancy) this is the nominal capacity to accommodate baseline delivered activity after adjustment for target occupancy rates. This is also a measure of the level of staffed capacity required to meet baseline demand levels.
- 2026/27 Population projections and modelled Incidence trends - This represents demand in the patient cohort changes as a result of population change and the modelled increase in extreme preterm cases, and the resulting change in capacity requirements.
- Shift Gestation Cohort / Shift Weight Cohort - This represents the change in required capacity to accommodate the change in the flow of babies <27 weeks or <800g.
- Shift Interventions Cohort / Shift IC Extended Days Cohort - This represents the change in the flow of babies who receive IC interventions and those who fail to improve at LNUs.
- Total - This is the final predicted capacity required to meet activity, given the modelled flow of babies into and out of each unit.
Under each chart, the table details the impact on SC, HD, and IC cots, as well as the difference that ‘low’ and ‘high’ scenarios have on projected requirements where this is different to the ‘likely’ scenario.
5.2.1 Royal Hospital for Children, Glasgow
The projected activity for Royal Hospital for Children (RHCG) required an overall increase of around 12 cots, consisting of 6.5 IC cots, 3.6 HD and 1.8 SC cots. The biggest expected rise is for the transfer in of babies <27 weeks or <800g, requiring an additional 5.7 cots (4.2 IC).
While an additional 12 cots have been identified for RHCG, there may be capacity to have the care of neonates requiring high dependency or special care located in either of the two LNUs within the Glasgow and Greater Clyde Health Board – either at Princess Royal Maternity (see 5.2.5) or at Royal Alexandra Hospital Paisley. This would support the capacity at RHCG to handle the increase, especially with lower acuity cases (mainly in SC cot capacity), where babies do meet the criteria of ‘smallest and sickest’ during their stay.
| Royal Hospital for Children | SC | HD | IC |
|---|---|---|---|
| Current Physical Capacity | 20.0 | 14.0 | 16.0 |
| Baseline Capacity Requirement | 21.5 | 15.3 | 15.0 |
| Projected Capacity Requirement | 21.8 (21.7 to 21.9) | 17.6 (17.2 to 17.9) | 22.5 (21.1 to 23.5) |
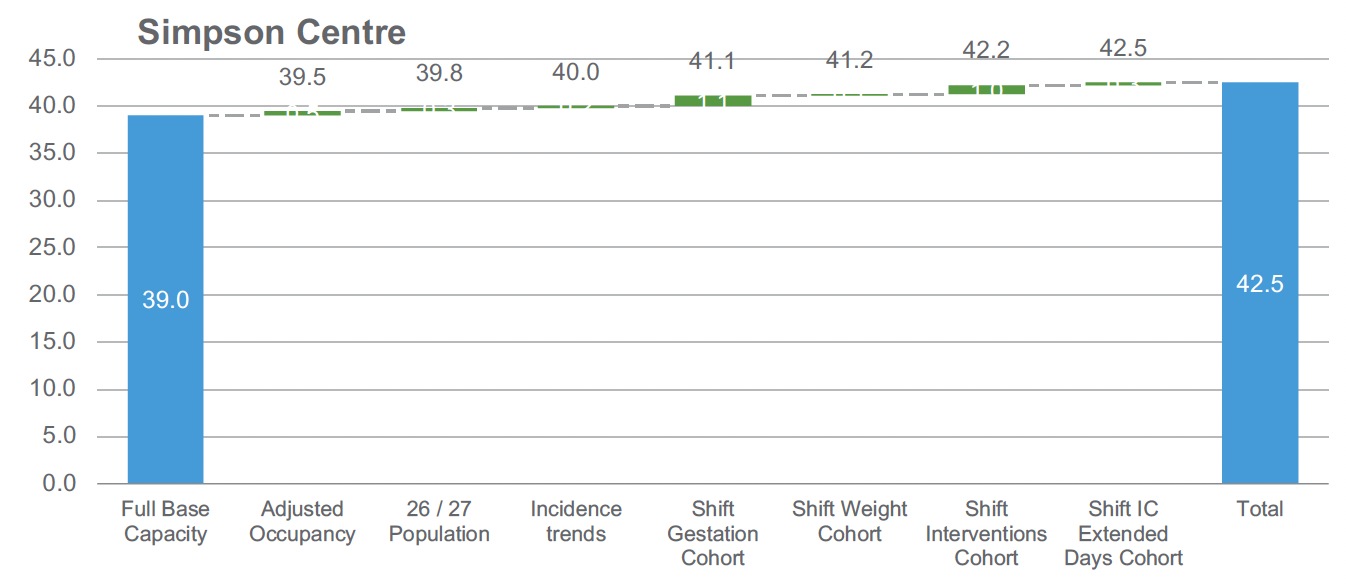
5.2.2 Simpson Centre
The projected increase in activity for The Simpson Centre would need approximately 4 further cots, with increases mainly in IC and HD capacity; overall modelling indicates a change in configuration with slightly lower SC capacity compared to baseline (-1.6), versus more substantial HD (+3.2) and IC (+2.4) increases. The biggest change in the number of required cots is driven by the movement of babies <27 weeks or <800g in the new model of care.
| Simpson Centre | SC | HD | IC |
|---|---|---|---|
| Current Physical Capacity | 22.0 | 8.0 | 9.0 |
| Baseline Capacity Requirement | 20.1 | 10.3 | 9.0 |
| Projected Capacity Requirement | 20.4 | 11.2 (11.1 to 11.3) | 11.4 (11.2 to 11.7) |
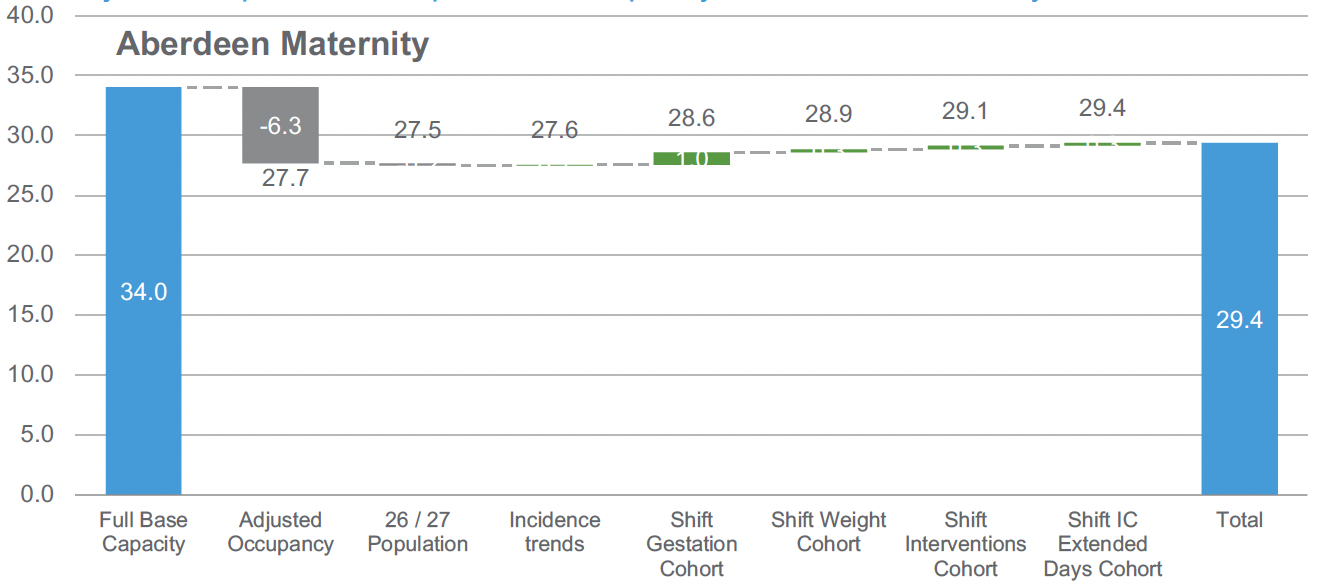
5.2.3 Aberdeen Maternity
Aberdeen Maternity Hospital currently has more physical neonatal care capacity than is currently utilised by the activity supported, particularly in IC capacity. Based on activity, this suggests that the unit utilised 28 cots in the baseline period . This cot capacity would increase to 30 cots given the model of care changes.
| Aberdeen Maternity | SC | HD | IC |
|---|---|---|---|
| Current Physical Capacity | 19.0 | 5.0 | 10.0 |
| Baseline Capacity Requirement | 17.0 | 6.5 | 4.2 |
| Projected Capacity Requirement | 17.0 | 6.9 (6.9 to 7) | 5.5 (5.3 to 5.8) |
5.2.4 Ninewells
Projected requirements for Ninewells show an overall reduction in physical capacity requirements of 4 cots, particularly with IC cot requirements reducing from 4 to 1.4. This decrease in cots is driven by adjusting physical capacity based on activity (a reduction in cots of 1.3) and the movement of the smallest babies in the new model of care.
The slight increase in HD cot requirements versus physical capacity indicates the flexible use of SC and IC cots for HD babies in the baseline period.
| Ninewells | SC | HD | IC |
|---|---|---|---|
| Current Physical Capacity | 14.0 | 3.0 | 4.0 |
| Baseline Capacity Requirement | 10.8 | 5.7 | 3.3 |
| Projected Capacity Requirement | 10.6 | 4.8 (4.7 to 4.9) | 1.4 (1.0 to 1.7) |
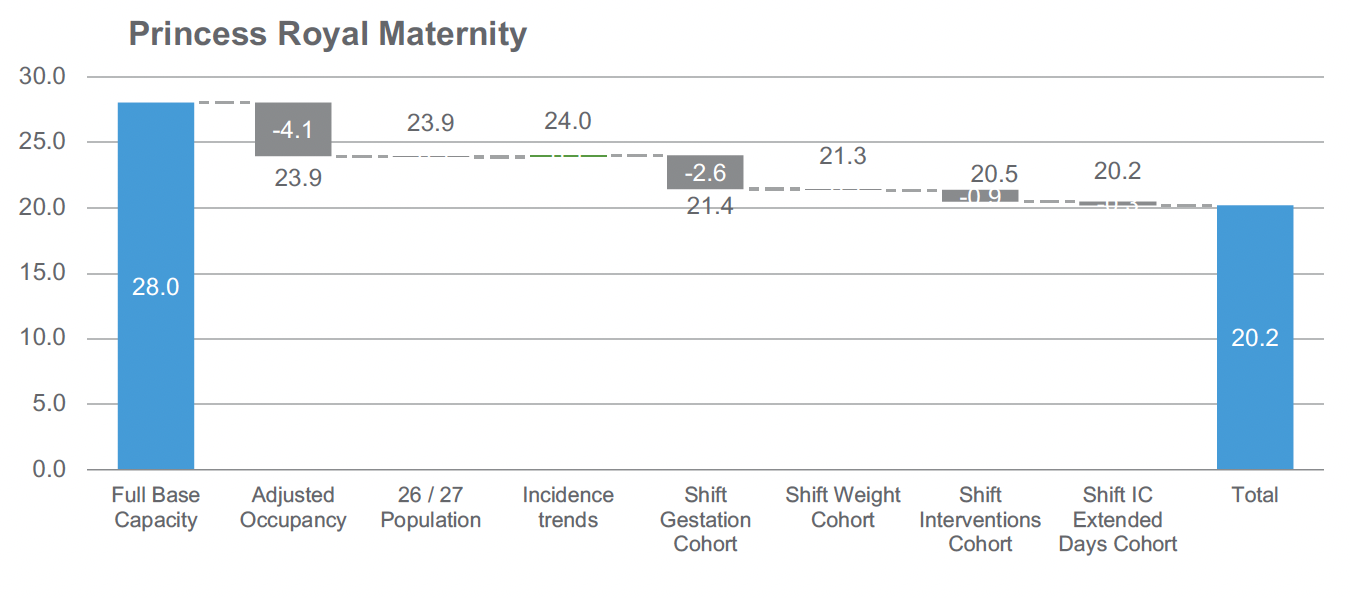
5.2.5 Princess Royal Maternity
The impacts on Princess Royal Maternity Hospital show a decrease in HD and IC requirements of 3 cots. At 80% occupancy the requirement for SC cots is 5 less than the available physical capacity.
While there is a total decrease in the number of cots of 7.8 for Princess Royal Maternity, these cots may be needed to support lower level of care babies, who in the baseline period would have received care in RHCG, especially with lower acuity cases (mainly in SC cot capacity), where babies do not meet the criteria of ‘smallest and sickest’ during their stay. This would support the capacity at RHCG to handle the increase in NICU activity.
| Princess Royal Maternity | SC | HD | IC |
|---|---|---|---|
| Current Physical Capacity | 18.0 | 6.0 | 4.0 |
| Baseline Capacity Requirement | 13.2 | 6.8 | 4.0 |
| Projected Capacity Requirement | 13.0 (12.9 to 13.0) | 5.7 (5.5 to 5.8) | 1.4 (1.1 to 1.7) |
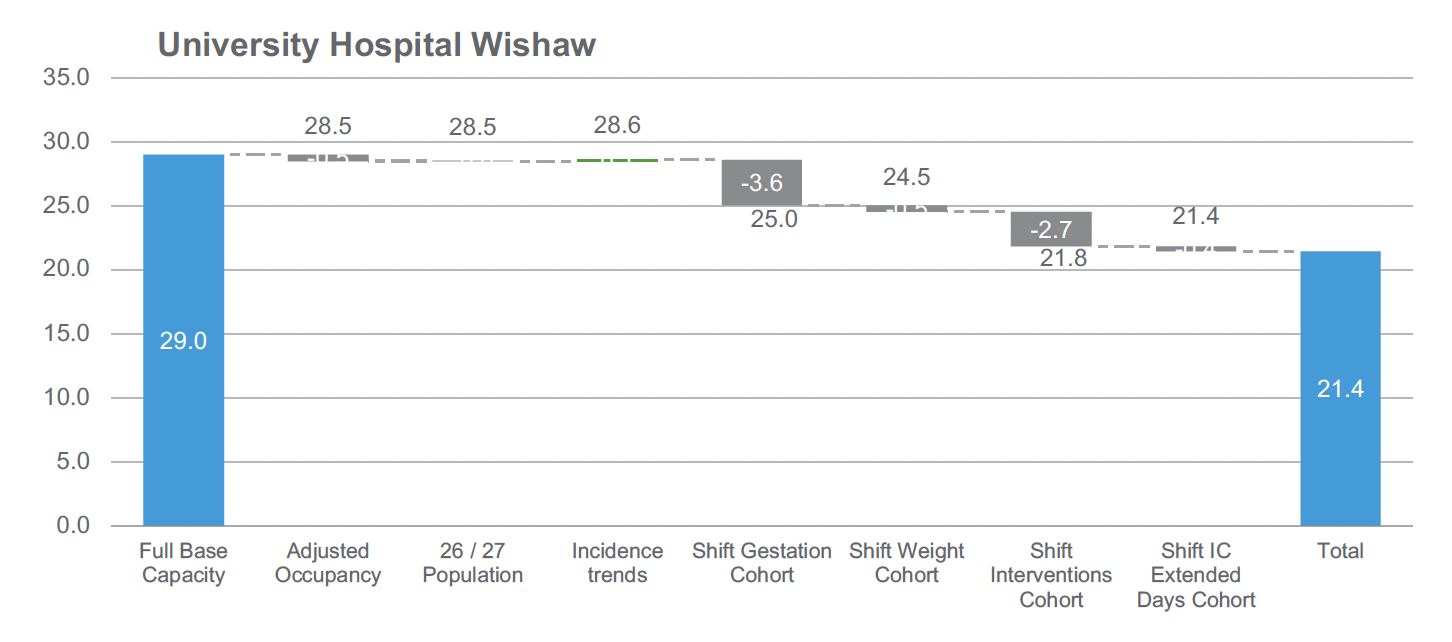
5.2.6 University Hospital Wishaw
The projection for Wishaw is an overall decrease in approximately 7 cots, predominantly in IC capacity (a reduction of 6.4 cots). There is also a configuration change with a higher proportion of SC cots to meet baseline and future demand – of an additional 3.4 cots. This increase in special care cots will support the timely repatriation of babies in the new model of care.
| University Hospital Wishaw | SC | HD | IC |
|---|---|---|---|
| Current Physical Capacity | 11.0 | 10.0 | 8.0 |
| Baseline Capacity Requirement | 14.6 | 6.7 | 7.2 |
| Projected Capacity Requirement | 14.4 (14.3 to 14.4) | 5.5 (5.4 to 5.8) | 1.6 (1.1 to 2.5) |
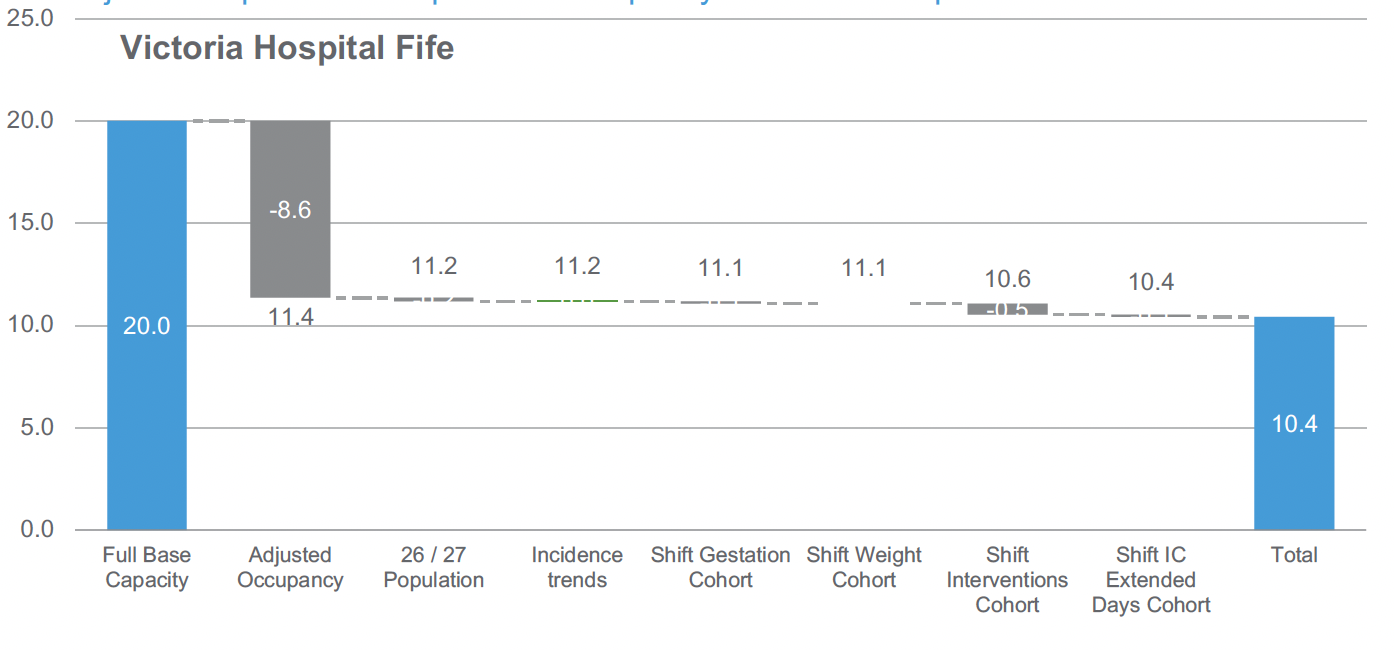
5.2.7 Victoria Hospital Fife
As an early adopter site, Victoria Hospital has a large difference between physical capacity and utilised capacity, for the same reason the site does not see a significant additional impact in the projected capacity requirements, this is because the majority of activity in the smallest and sickest cohorts will have already moved under the early implementer arrangements. The future modelled requirement for IC cots is only 0.5, and consideration will need to be given to the practical configuration (ie is there a safe minimum number of cots that needs to be upheld) and the associated staffing required.
| Victoria Hospital Fife | SC | HD | IC |
|---|---|---|---|
| Current Physical Capacity | 14.0 | 2.0 | 4.0 |
| Baseline Capacity Requirement | 6.6 | 3.8 | 0.9 |
| Projected Capacity Requirement | 6.5 | 3.5 (3.4 to 3.5) | 0.5 (0.3 to 0.6) |
5.2.8 University Hospital Crosshouse
University Hospital Crosshouse follows a similar pattern to Victoria Hospital, which is reflective of being an early adopter of the model of care. There is a notable difference (-5.2 cots) in physical capacity compared to required capacity in the baseline, mainly due to IC cot requirements (-3.3 cots), but only very minor changes due to any further shift in activity. It is worth noting that the projected change as part of the ‘sickest’ cohort does not show any impact, due to a lack of granular baseline data for the Crosshouse site, meaning it was not possible to identify the more complex interventions in the same way as other sites.
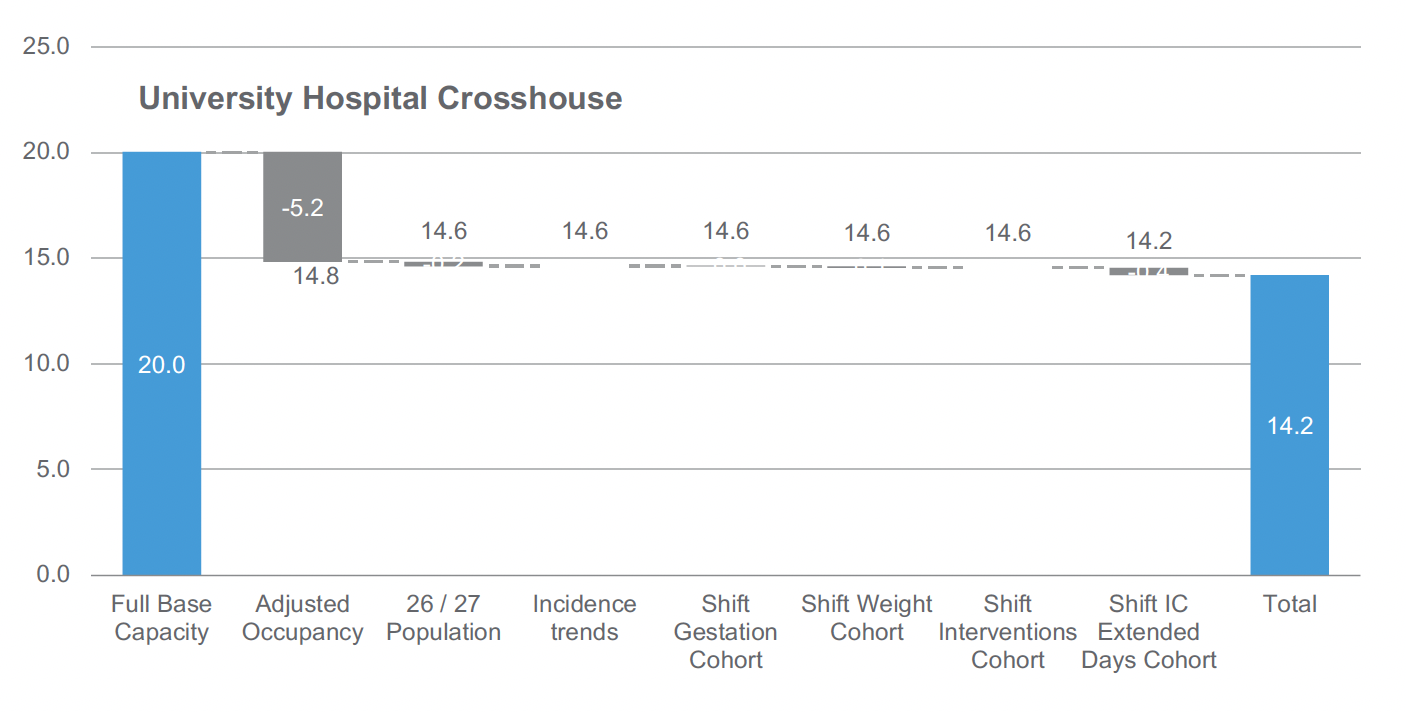
| University Hospital Crosshouse | SC | HD | IC |
|---|---|---|---|
| Current Physical Capacity | 11.0 | 4.0 | 5.0 |
| Baseline Capacity Requirement | 9.6 | 3.5 | 1.7 |
| Projected Capacity Requirement | 9.5 | 3.4 | 1.3 (1 to 1.5) |
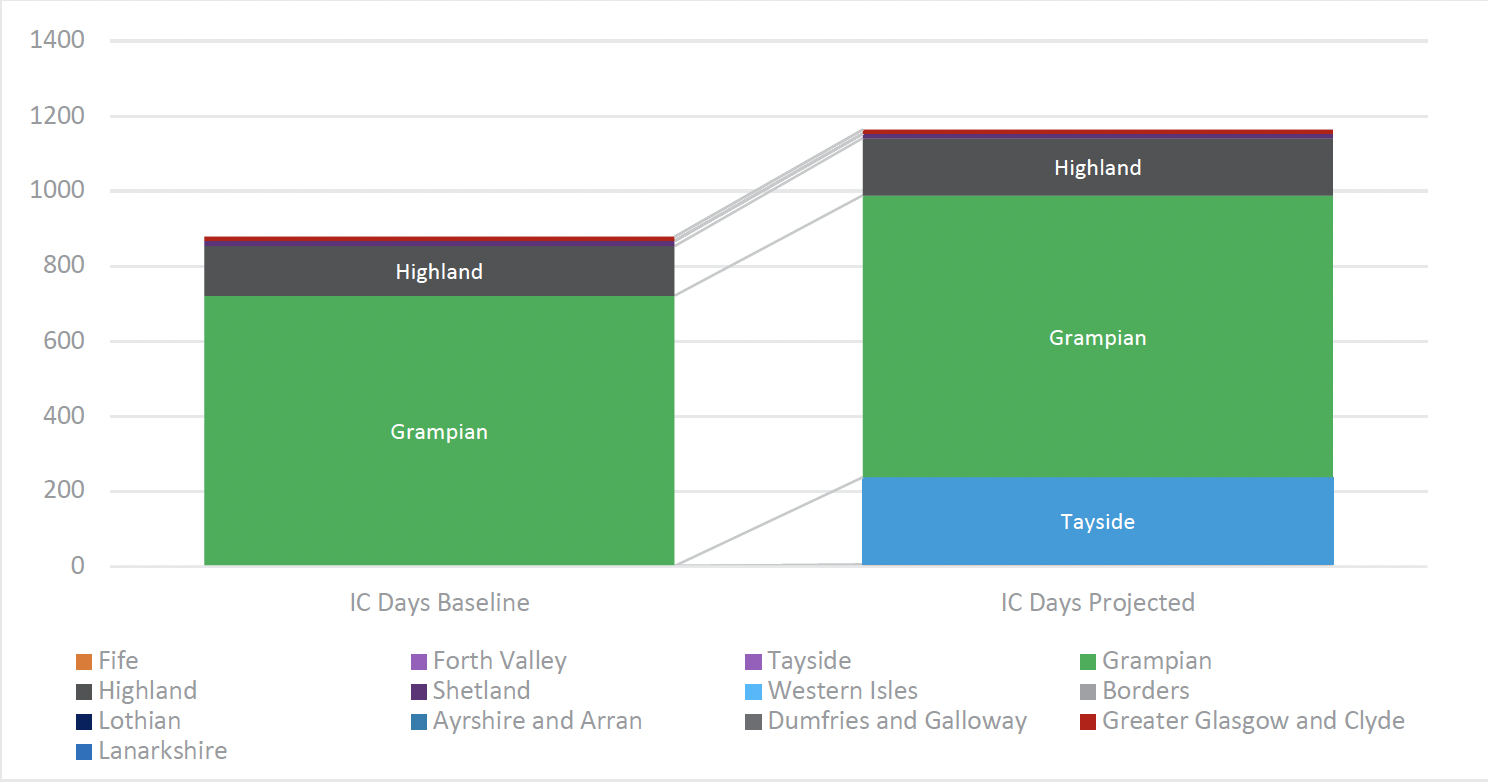
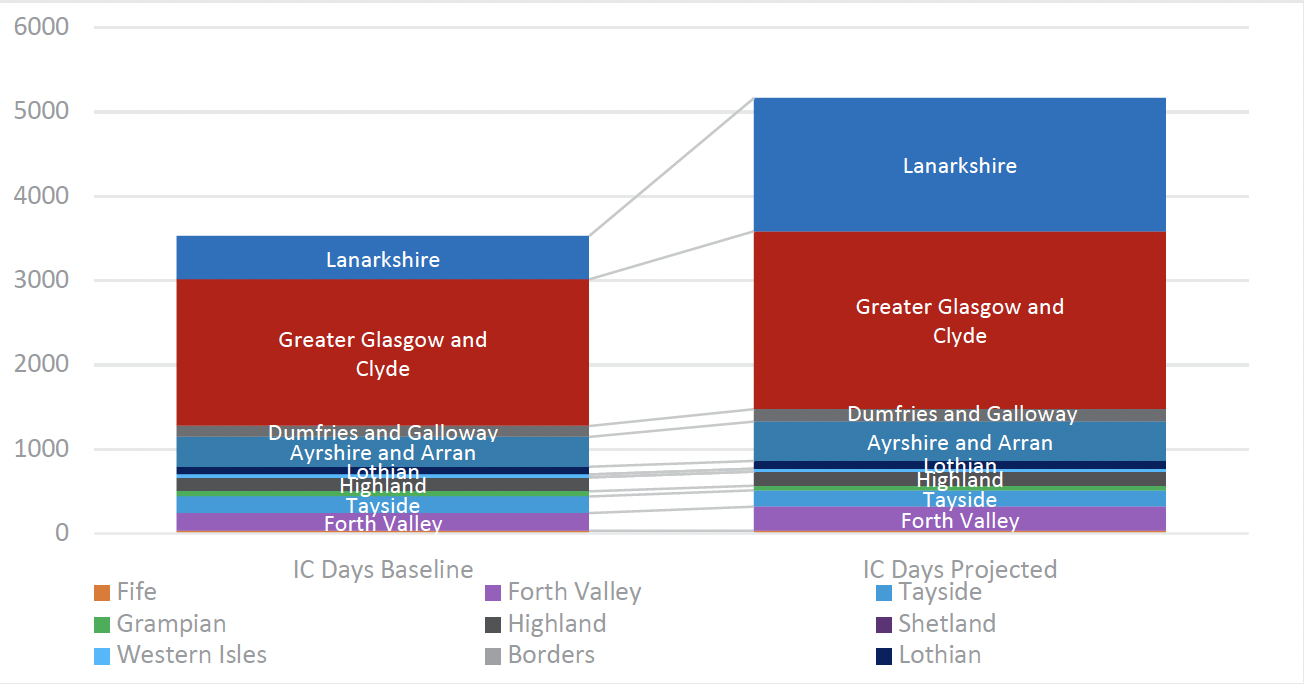
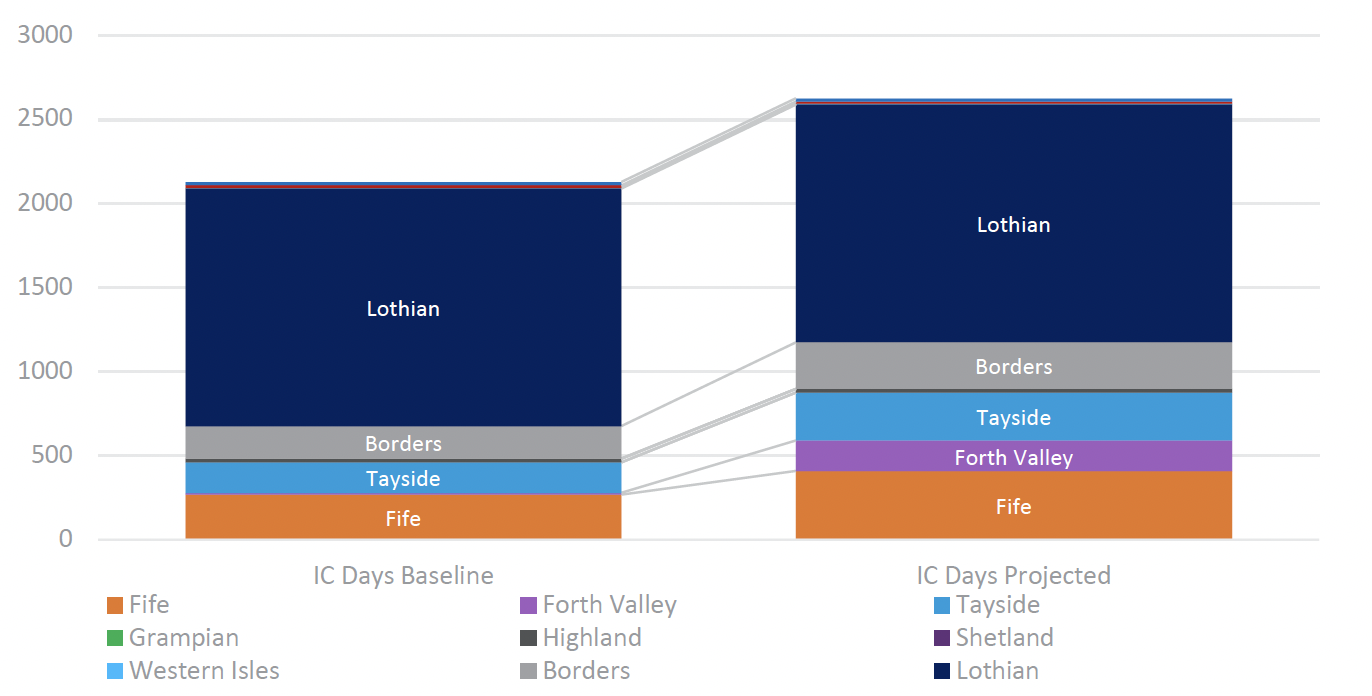
5.2.9 Impact on flows
The following charts illustrate the modelled changes in flow by Health Board, which indicate the key changes in catchment areas for each NICU and the projected distribution of activity.
Aberdeen Maternity Hospital
The most significant change for Aberdeen Maternity Hospital is the projected increase in activity from Tayside. This is due to the transfer of activity that is currently being delivered from Ninewells and will be split between the Simpson Centre and Aberdeen. Aberdeen will also expect to see small uplifts from Grampian and Highland for the same reason.
Royal Hospital for Children, Glasgow
RHCG is projected to see a significant increase in the activity seen from Lanarkshire, as that activity would have previously been undertaken at Wishaw. There is also a large increase from Greater Glasgow and Clyde – mainly due to the shift from Princess Royal Maternity, but also some activity that would have previously been undertaken at Wishaw. Smaller increases are projected from Ayrshire and Arran, which would have previously been undertaken by a combination of Crosshouse, Wishaw or Princess Royal Maternity. Forth Valley activity, currently delivered across a range of units, will also increase. However, comparatively more activity from Forth Valley Health Board is projected to flow to The Simpson Centre as the nearest NICU site.
Simpson Centre
The Simpson Centre is projected to receive more intensive care activity particularly from Fife (previously delivered by Victoria Hospital) and Forth Valley (currently mainly delivered by Wishaw), with a share from Tayside, and the majority of the Borders activity that currently flows to Wishaw.
5.2.10 Maternity capacity
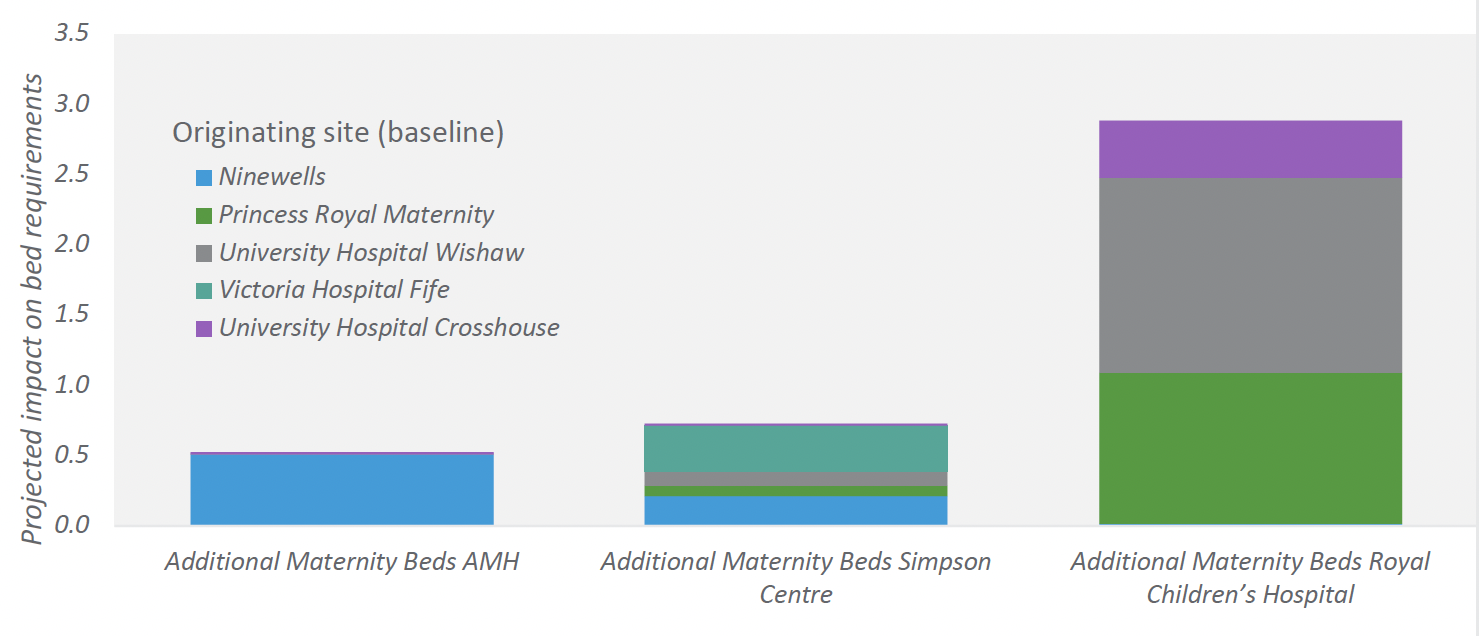
Based on the modelling of future neonatal flows and the assumptions regarding associated uplift in demand on maternity services, the projected increase in maternity activity comprises 163 additional bed days for AMH, 227 for Simpson Centre and 895 for RHCG.
The equivalent bed capacity that would need to be resourced is included in Figure 20, assuming an average occupancy of 85% to allow for variation in demand over time. For births for preterm less than 27 weeks and 800g babies that are not in the correct setting, mothers would require postnatal transfer alongside their infant and inpatient care if needed. Considerations would also be needed as maternal care in this group has been described as complex.
5.2.11 Impact on transfers
The change in the model of care will impact on both the volume of transfers and journey travel times.
It is difficult (with the data available in the timeframe of this work) to determine the activity that is already transferred in utero in the baseline period, and we would recommend further work to collect and test and validate transfer impact assumptions. We have based a planning assumption on the overall ratio of 6 in-utero transfers to 10 new neonatal admissions (see 0 maternity assumptions) to IC or HD cots. We have assumed that modelled changes in the location for in utero transfers would not result in additional journeys, under the logic that the transfer would be to a different location, but not an additional journey for SAS. This would nonetheless result in an increased travel time.
We have assumed that based on this overall proportion, a volume of activity moving under the new model would potentially require an ex-utero transfer. This results in an estimate of an additional 100 Ex utero transfers per year for the ScotSTAR service, though ideally a higher proportion of babies within the identified cohorts will be transferred antenatally to ensure births occur in the correct setting. In practice, the experience in England is that that approximately 90% of births for preterm less than 27 weeks and 800g babies occurs in the correct setting, meaning that this number will be an overestimate.
| Booking Hospital | Ex Utero Transfer to Aberdeen Maternity | Ex Utero Transfer to RHCG | Ex Utero Transfer to Simpson Centre |
|---|---|---|---|
| Ninewells | 6 | 0 | 3 |
| Princess Royal Maternity | 0 | 28 | 1 |
| University Hospital Wishaw | 0 | 48 | 4 |
| Victoria Hospital Fife | 0 | 0 | 7 |
| University Hospital Crosshouse | 0 | 3 | 0 |
In addition to these uplift transfers, we estimate approximately 79 additional repatriation transfers per year, for ex-utero transfers returning from the NICU sites to these LNU sites. Additionally, there would be approximately 50 additional repatriations for babies initially transferred in-utero.
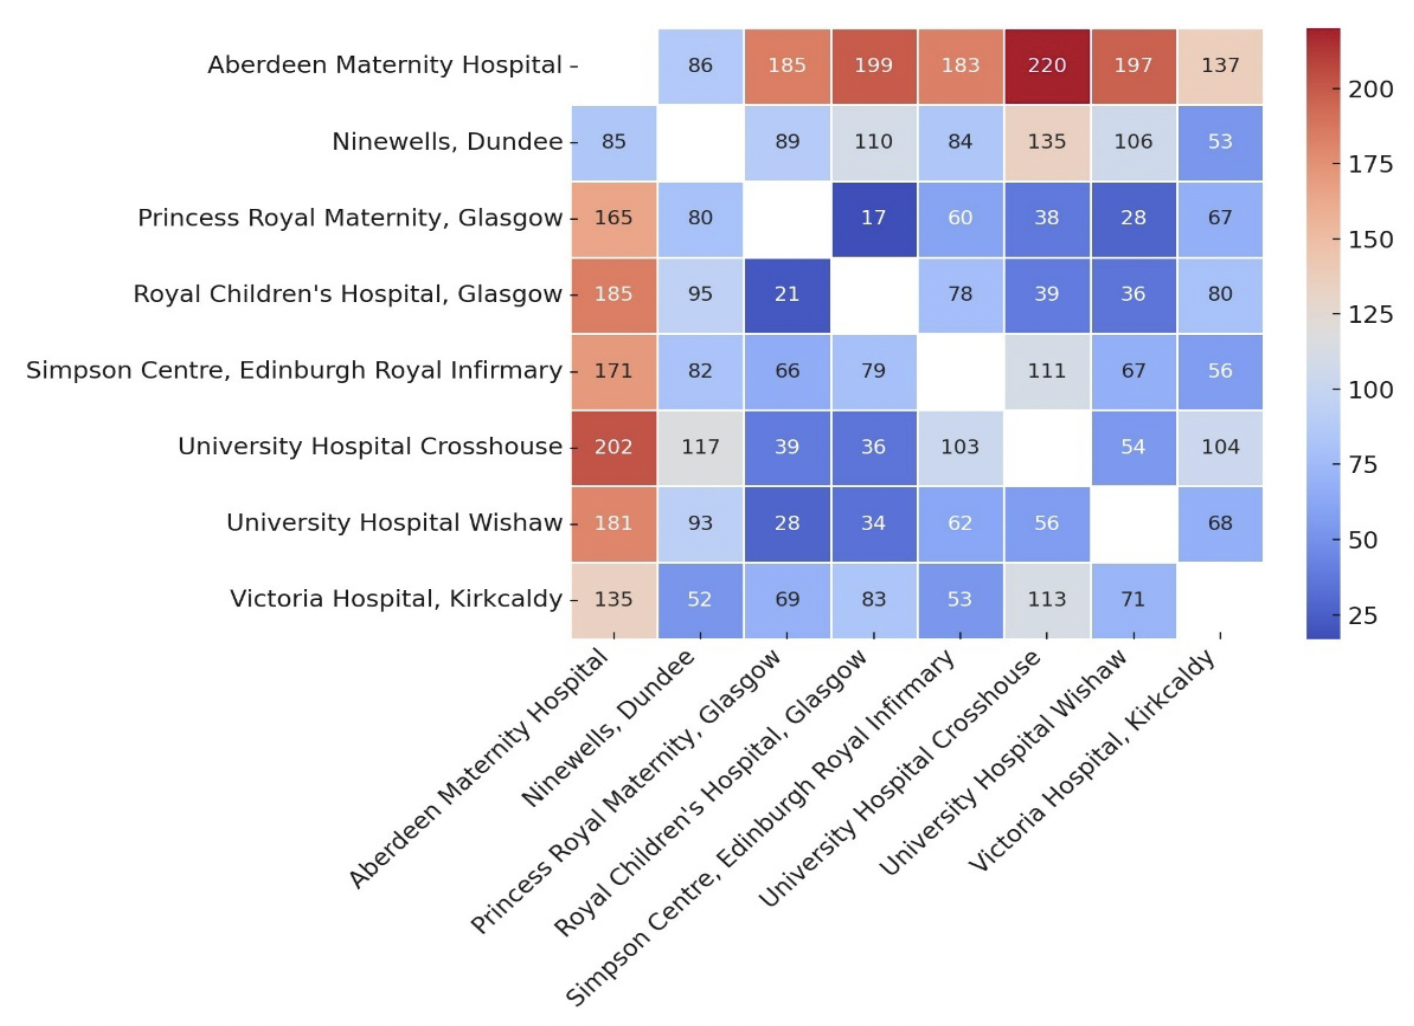
Based on travel time analysis (Google Maps Distance Matrix API, see
Figure 22), this would require an additional 64 hours of transportation per year, with an average travel time of 38 minutes. The average journey times vary from an average of 19 minutes (for activity displaced from PRM), to an average of 1 hour and 26 minutes (for activity displaced from Ninewells).
Given that the major impacts are projected for transfers moving from either Wishaw and Princess Royal Maternity to Royal Hospital for Children, it should be emphasised that this is an overestimate, but at the same time is an impact to be planned for and mitigated in order to minimise excess transfers. We would recommend further work to understand this as part of regional implementation planning.
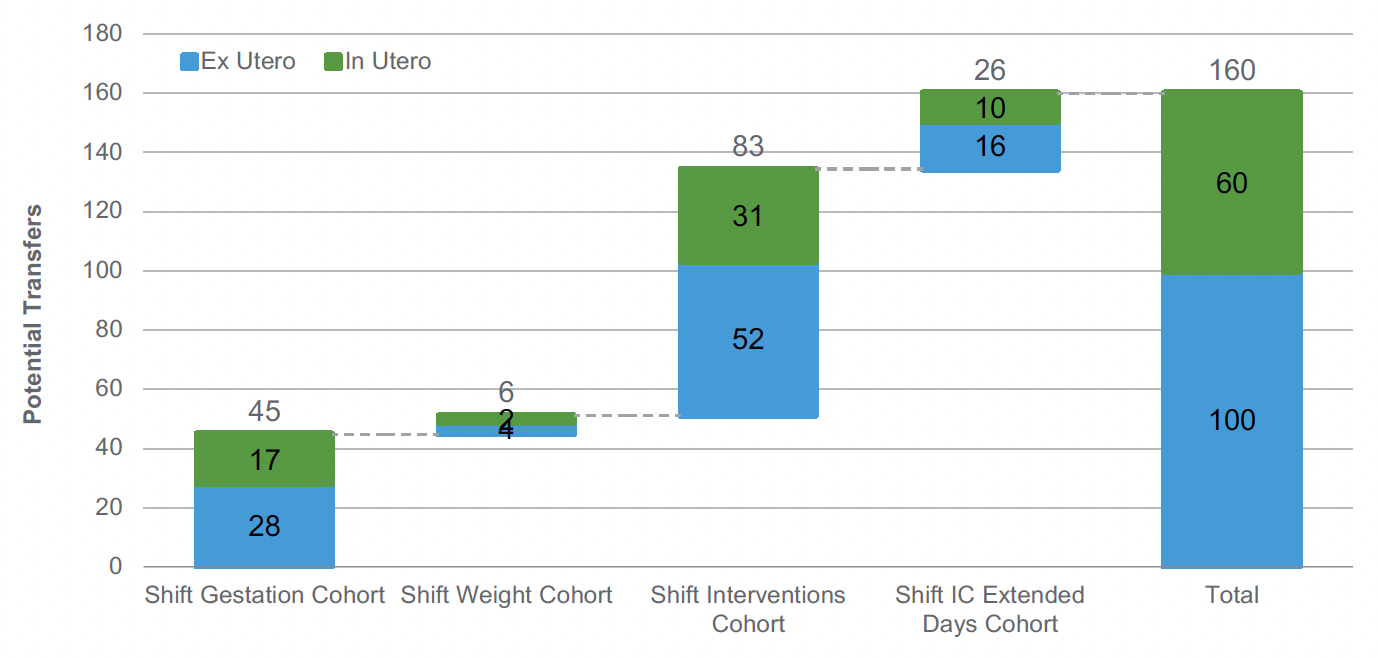
Figure 21 below illustrates the main drivers of potential impact, with the new model altering the pathway for just over 50 babies per year in the ‘smallest’ cohort, and the potential for close to 100 for the ‘sickest’ cohort.
Contact
Email: thebeststart@gov.scot
There is a problem
Thanks for your feedback