Developing a population model for Rum Manx Shearwaters for assessing offshore wind farm impacts and conservation measures
This study undertook a detailed review and collation of available historical and current data for Manx shearwaters on the Isle of Rum. It combined the data into an integrated population model, allowing the reconstruction of population trends and quantifying of future sensitivities.
4 Results
4.1 Baseline model
The prior and posterior distributions for the parameters of model 1 (see Technical Report) indicated that the model is gaining information from the data, in the sense that no major disagreements with the priors were observed and most posteriors are less dispersed than their corresponding priors. Of interest is the indication that density dependence is weak in this population and that the breeding success in Canna is probably consistently lower (by about 10%) than the breeding success on Rum. The magnitude of variability in each demographic process can be used as an indicator of which process seems less buffered from external influences and may provide direction for future inclusion of covariates (in the sense that more variable demographic processes may deserve closer investigation with causal hypotheses about extrinsic covariates). To explain the observations, the model needed to assume highly variable adult survival. As discussed below, this may be an artefact of the inconstant methodology used to estimate population sizes on the island. Other than that, variability in fledgling survival is hinted as a likely source of variability in numbers.
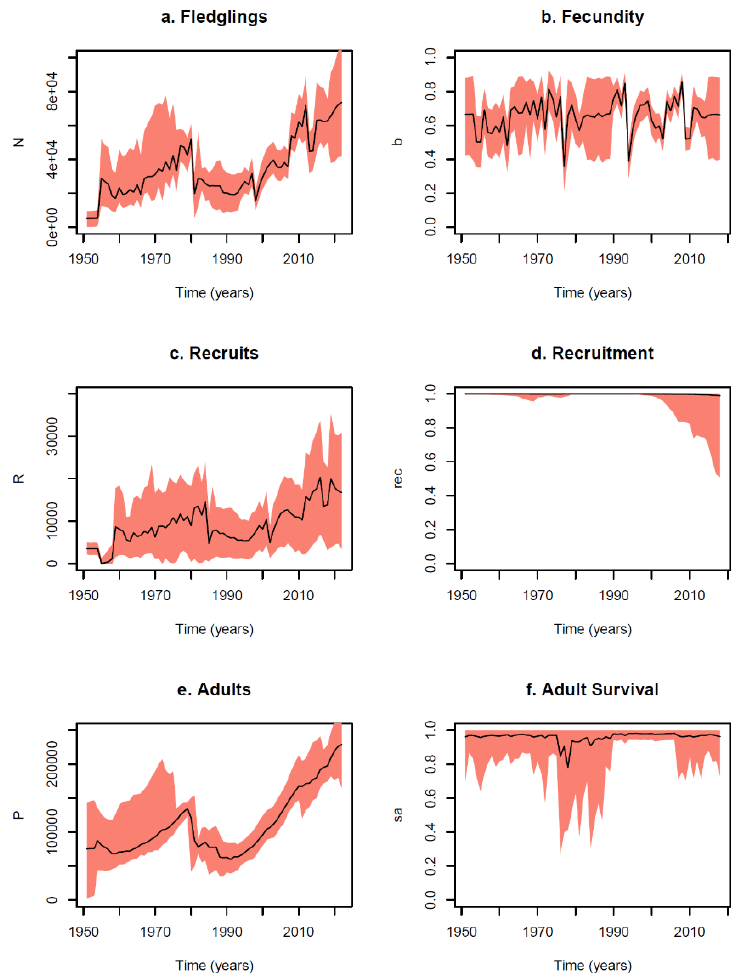
The reconstructed trajectories from the model are summarised in Fig. 1. The inferred reductions in adult survival (Fig. 1f) during the 1980s coincide with a drop in observed numbers that may be induced by changes in population size estimation methods. The model indicates that recruitment in recent years may be experiencing a drop (Fig. 1d), hinting that density dependence may be starting to have an effect. However, this is only suggested by the lower 95% credible limit, and the trend is not reflected by the median trajectory, a consequence of the high uncertainty in the inference of density dependence.
4.2 Validation with simulated data
Fitting Model 1 to simulated data converged and gave realistic reconstructions of the (synthetic and hence known) simulation parameters and data (see Technical Report). However, there are also some key warnings arising from this validation exercise. First, it appears particularly difficult to infer the true effects of covariates. Second, the model indicates only limited capacity in inferring the strength of density dependence.
4.3 Sensitivity analysis
Details and graphical outputs for all results mentioned in this section are provided in the Technical Report.
Model 2: The results indicate that the sustained recent population increases of Model 1 were entirely down to the Inger et al. (2022.) estimate. However, this did not affect the apparent population crash at the start of the 1980s. As a direct consequence, this version of the model also suggests that recruitment is more constrained, both now and in the past.
Model 3: The results from this ad-hoc model averaging between Models 1 and 2 are more akin to the trajectories produced by Model 2. The conclusion from this is that even when offered the possibility of the higher 2021 population estimate, the model finds it easier to explain the data (subject to its mechanistic assumptions) by resorting to a lower recent population size, and a stronger density dependence.
Model 4: Doubling the CVs of all surveys gave reconstructions similar to Model 1. Therefore, even though the model was given more flexibility to ignore fluctuations in the observations, the relative magnitude of the point estimates drove it to conclude that the population is currently increasing well beyond historical levels.
Model 5: Increasing all survey CVs by a scale of 10 was such a large increase in observation uncertainty that it led the model to infer a completely flat trajectory, across the history of observation (i.e., from the point of view of inference, the population data were as good as absent).
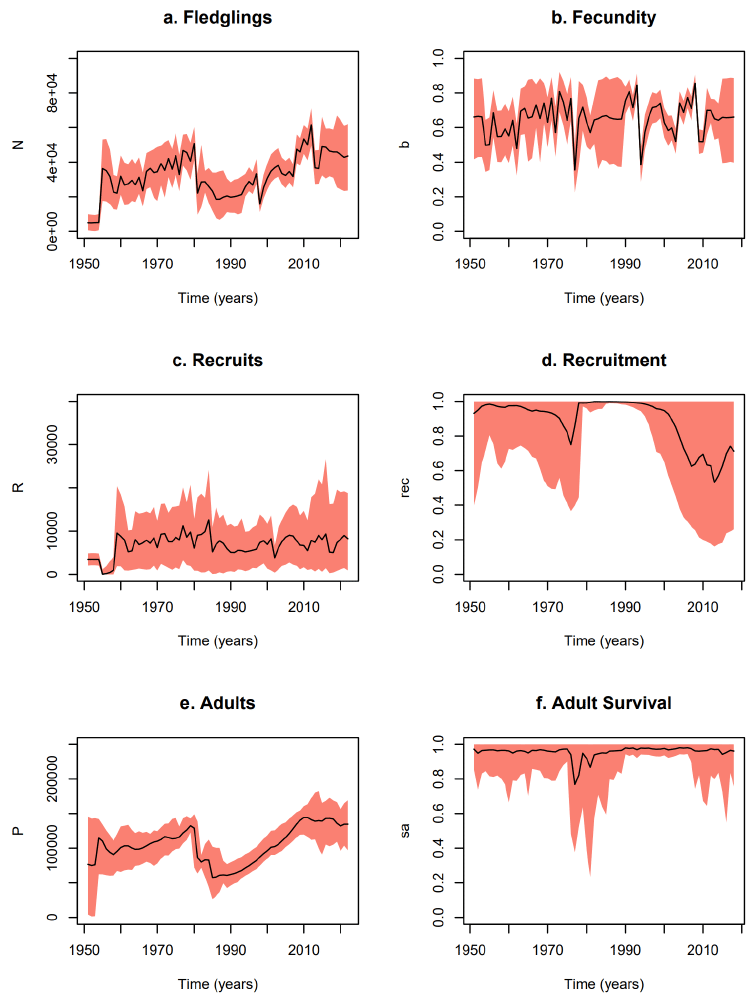
Examination of the sensitivity of the model’s results to different assumptions about the bias and precision in the population data indicated that Model 3 is the most parsimonious. It affords some credibility to historical counts but encompasses both possibilities of a low and high count for 2021 Therefore, it was decided that Model 3 would be the most suitable vehicle for investigation of candidate covariates, forecasts and counterfactuals. Reconstructions from this model are shown in Fig. 2.
4.4 Effect of covariates
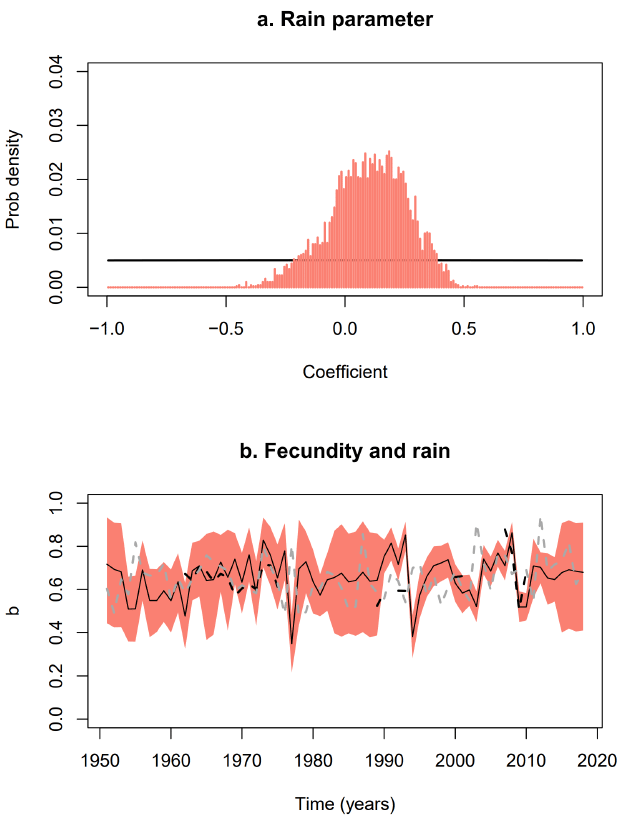
The effect of rain was investigated in two versions of this model. The first version assumed that (as previously reported in (Thompson 1987; Thompson and Furness, 1991)), rain has a detrimental effect on breeding success. The second version, took a more agnostic approach, investigating whether rain could have any effect on breeding success. The first version of the model found that there was no evidence for a negative effect. The second version indicated a small positive impact. However, this effect is weak (see posterior in Fig. 3a) and certainly cannot be discerned by visually inspecting the reconstructed time series of fecundity and the corresponding rainfall time series (Fig. 3b).
There is evidence from the neighbouring island of Canna that shearwater population declined as a result of predation of eggs and chicks by rats. However, the sparsity of data on rat abundance did not permit us to examine rat abundance as a covariate of breeding success.
4.5 Forecasts
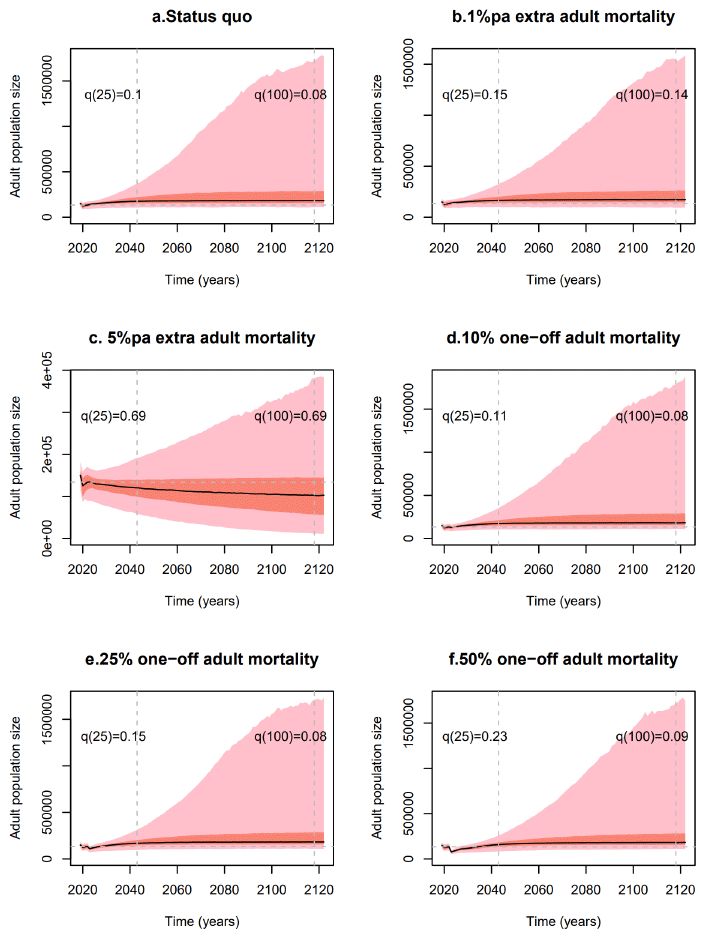
Effects on adult survival: The baseline scenario (Fig. 4a) was the forecast generated from the population continuing with the current regime of environmental stochasticity in all the demographic processes. Importantly, despite having generated these predictions from Model 3 (i.e., not adhering to the optimistic 2021 estimate by Inger et al. (2022)), the model predicts only a 10% chance of population reduction in the next 25 years and 8% for the next century. From that baseline we examined two scenarios of press perturbation. A 1% reduction in annual adult survival yields a small increase in decline risk (Fig.4b) but decline becomes the predominant outcome if adult survival is suppressed by 5% annually (Fig.4c). These scenarios were followed by three pulse perturbation scenarios (10%, 25% and 50% reductions in adult survival applied in 2024). The population is predicted to be completely robust to such events (Figs 4d, e & f).
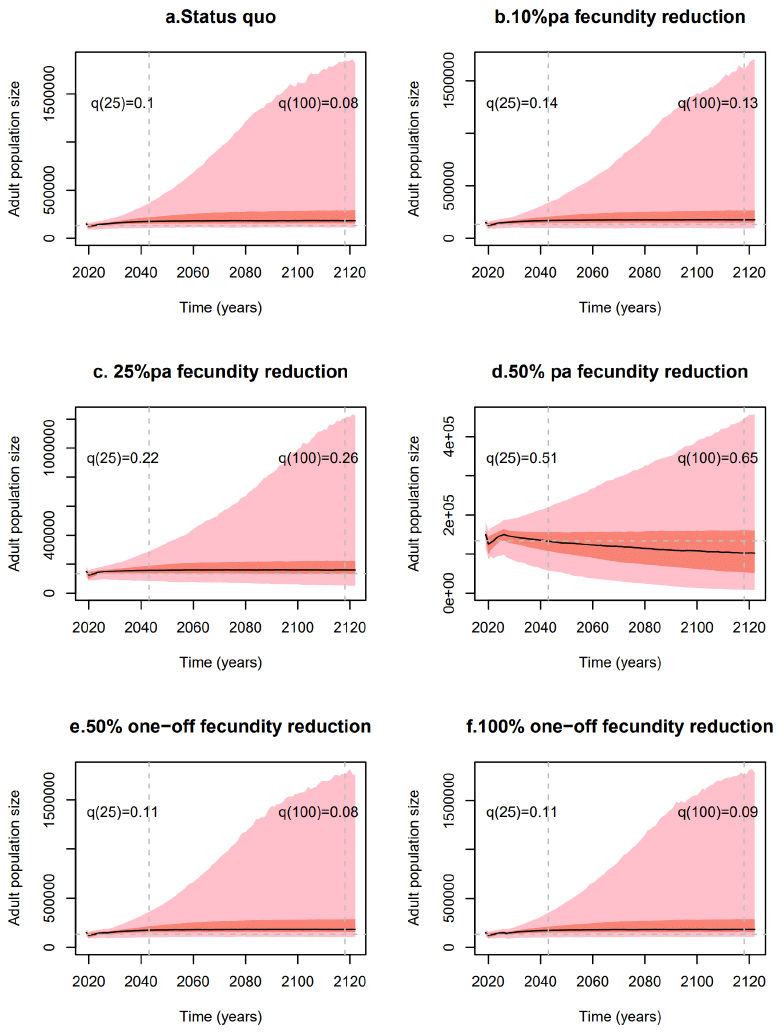
Effects on fecundity: The baseline scenario (Fig. 5a) is, once again, the forecast generated from the population continuing with the current regime of environmental stochasticity in all the demographic processes. Incrementally more severe attritions on fecundity, from 10% to 50% pa (Figs 5c, d, & e) indicate that the population is quite robust to loss in reproductive capability, assuming the survival probabilities remain as they are. Equivalently, the population could survive with no lasting impact in the next 25 or 100 years if it lost half or all its fledgling cohort in 2024 (Figs 5e & f).
Contact
Email: ScotMER@gov.scot
There is a problem
Thanks for your feedback