Economic inactivity of young people aged 16-24: Definition, reasons and potential future focus
Report brings together evidence on inactivity and build knowledge on the reasons for inactivity amongst young people aged 16 to 24. In this report, we used published ONS data and have summarised the main results from existing published qualitative research for Scotland and the UK in the last 5 years
Unemployment and economic inactivity of young people 16-24
Overall, Scotland outperforms the rest of the United Kingdom for employment, unemployment and inactivity rates amongst 16-24 year olds. The latest data (January to December 2022) estimates Scotland had higher youth employment rates (57.9% vs. 53.7%), lower youth unemployment rates (9.7% vs. 10.4%), and lower youth inactivity rates (35.8% vs. 40.1%) when compared with the UK as a whole (Table 1).
| Employment | Unemployment | Inactivity | |
|---|---|---|---|
| Scotland | 57.9% | 9.7% | 35.8% |
| United Kingdom | 53.7% | 10.4% | 40.1% |
Source: Annual Population Survey. Data corresponds to time from January to December 2022.
Unemployment figures in Scotland
As stated earlier, though inactivity and unemployment differ in their definition, in the context of identifying the level and characteristics of the cohort of young people economically inactive in Scotland, it is relevant to explore the levels of unemployment within this age group. In January to December 2022, the estimated unemployment rate was of 9.7%. The unemployment rate estimates for this age band decreased between 2018 and 2019 with an increase in 2020 (Table 2). The latest estimate (2022) is 0.5 percentage points(pp) lower than the estimates for unemployment from one year ago, and 3.5 pp lower than two years ago. Though it is important to caveat that the data for 2020 and 2021 could have been affected by the COVID-19 pandemic.
In comparison with the United Kingdom, in January to December 2022, the unemployment rates in Scotland have been consistently lower with the latest figures reporting a 0.7 pp gap between both (Scotland’s rate 9.7% and United Kingdom’s rate 10.4%).
| 2018 | 2019 | 2020 | 2021 | 2022 | |
|---|---|---|---|---|---|
| Scotland | 9.6% | 8.3% | 13.2% | 10.2% | 9.7% |
| United Kingdom | 11.6% | 11.3% | 13.5% | 12.5% | 10.4% |
Source: Annual Population Survey. Data corresponds to time from January to December in any given year.
The unemployment figures offer a more in-depth understanding of this age cohort when excluding those young people aged 16-24 who are in full-time education. This is because if an individual is enrolled in full- or part-time education and:
- in employment they will be included in the employed category;
- if they are not actively seeking employment, would be classified as economically inactive;
- if they are actively seeking employment they would be classed as ILO unemployed.
In January to December 2022, the proportion of individuals aged 16-24 enrolled in full-time education was 45.4%. As such, excluding these individuals from the analysis allows for a better understanding of this cohort. As participation in education increases over time, inactivity levels tend to also increase as young people enrolled in full-time education will be less likely to be engaged or searching for full-time employment. If employed, it is likely that young people enrolled in full-time education will do so on a part-time basis.
The latest data for January to December 2022, shows that Scotland’s unemployment rate for young people aged 16-24 not in full-time education was 9.8% while the estimate for the UK was 9.9%. Scotland and the United Kingdom have had similar rates throughout the years (Figure 1).
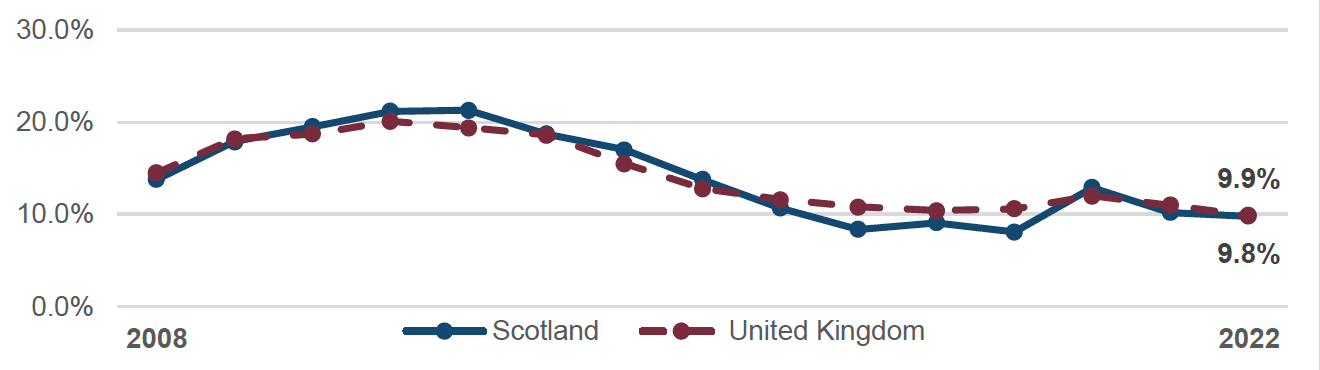
Source: Annual Population Survey. Due to the COVID-19 pandemic, data between 2020 and 2021 should be interpreted with caution. Data corresponds to time from January to December in any given year.
When it comes to sex, men account for a higher proportion of unemployed people aged 16 to 24 not in full-time education when compared with women (Figure 2). Throughout the years, unemployment proportions have been higher for men. The proportions have remained stable throughout the years for both men and women with the exception of 2015, 2019 and 2021 where the figures show the proportion of men was noticeably higher than women. For the latest years, some of these changes might be a result of the COVID-19 pandemic.
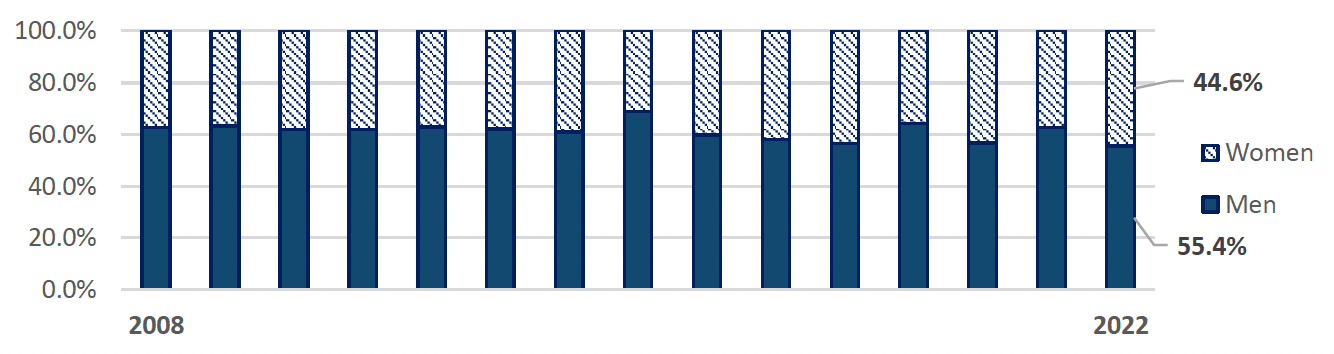
Source: Annual Population Survey. Due to the COVID-19 pandemic, data between 2020 and 2021 should be interpreted with caution. Data corresponds to time from January to December in any given year.
Finally, when it comes to age, the proportion of unemployed young people not in full-time education aged between 16-19 is lower when compared with unemployed young people not in full-time education between the ages of 20 and 24 (Figure 3). It is relevant to highlight that between 2015 and 2017 there was almost an even split between both age groups. From then on, the proportion of 20 to 24 year olds increased until 2020. Followed by a more equal split again in 2021 and maintaining similar values in 2022. This pattern could be due to the effects of the COVID-19 pandemic on the job market with young people transitioning to the labour market and exiting from education.
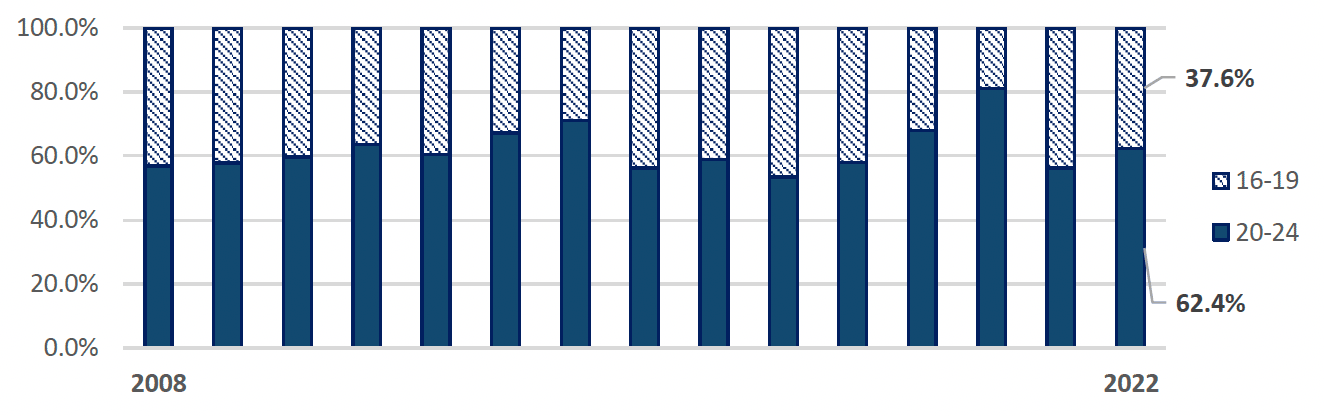
Source: Annual Population Survey. Due to the COVID-19 pandemic, data between 2020 and 2021 should be interpreted with caution. Data corresponds to time from January to December in any given year. Estimates for 16 to 19 year olds in 2020, 2021, and 2022 are from small sample sizes and should be used with caution.
Economic inactivity in Scotland
In this section two sources of data will be used: Annual Population Survey (ONS) reporting on 16-24 years old and the Annual Participation Measure reporting on the 16-19 cohort.
Annual Population Survey
When discussing economic inactivity, figures including those in full-time education will be presented, followed by figures for those not in full-time education. This is to allow for a baseline to be established between overall inactivity numbers and the numbers when accounting for individual’s reasons.
According to the most recent figures, from January to December 2022 an estimated 197,200 (35.8%) young people, aged 16-24, were economically inactive in Scotland. Since 2008, inactivity estimates have been steadily increasing. The latest estimate is 4.1 pp lower than the estimates for inactivity from 2020 and 2021. Though it is important to caveat that the data for last year and two years ago could have been affected by the COVID-19 pandemic.
Comparing with the UK as a whole, between January and December 2022 the estimates of inactivity for young people aged 16-24 was 40.1%. The inactivity rates have been consistently lower in Scotland than in the UK up until 2020 when they were similar. The latest data shows the gap widening between Scotland and the UK – the gap for 2022 is 4.3 pp, while in 2021 it was 1.4 pp (Figure 4).
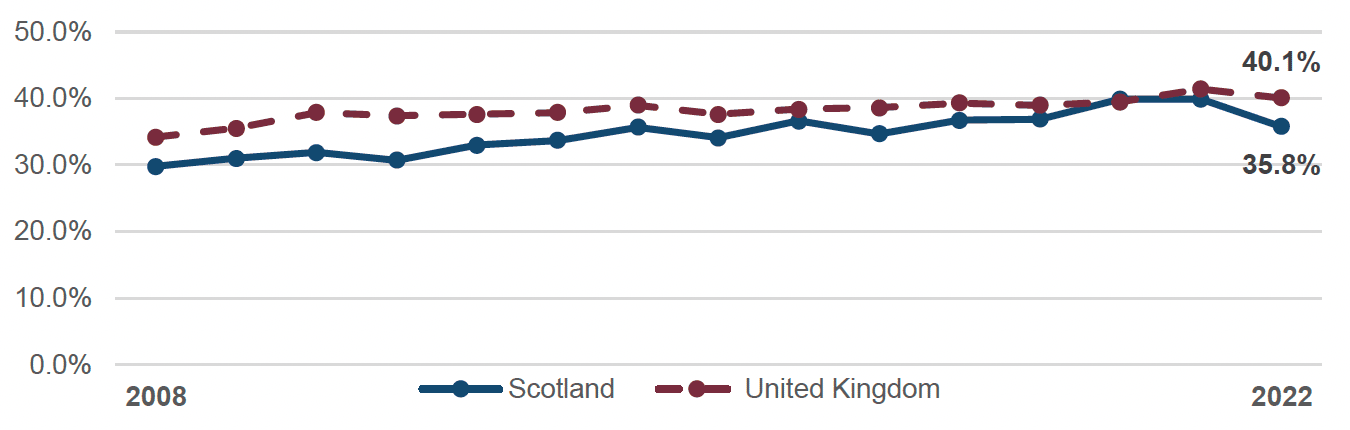
Source: Annual Population Survey. Due to the COVID-19 pandemic, data between 2020 and 2021 should be interpreted with caution. Data corresponds to time from January to December in any given year.
Figure 5 also reports on sex split for young people 16-24 economically inactive in Scotland. According to the latest data for 2022, the inactivity estimates for men were higher than for women (37.8% versus 33.8%). Up until 2021, the tendency was for women to have higher inactivity estimates than men, with the gap between both keeping relatively stable (with the exception of some years where the estimates were similar).
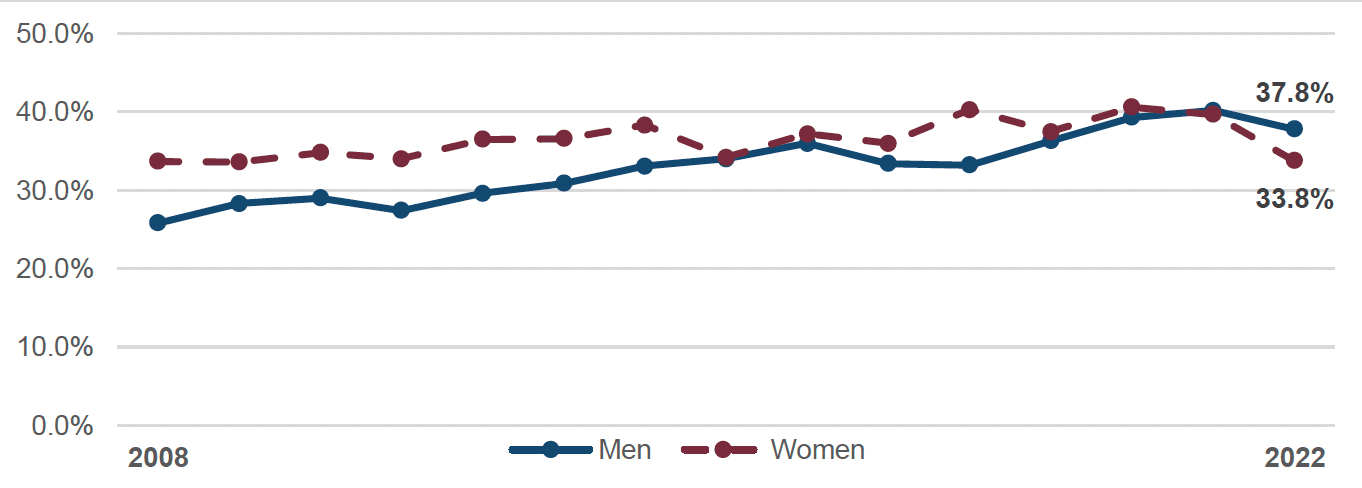
Source: Annual Population Survey. Due to the COVID-19 pandemic, data between 2020 and 2021 should be interpreted with caution. Data corresponds to time from January to December in any given year.
Figure 6 reports on the proportion of people in the age groups 16-19 and 20-24 who are inactive. The estimates remained stable across the years for the age group 20-24. For 16-19 year olds, the estimates show a steady increase across the years up to 2020. From that point on, the proportion of 16-19 year olds who are inactive has been decreasing, with the latest data showing a gap between both age groups of 28.0 pp.
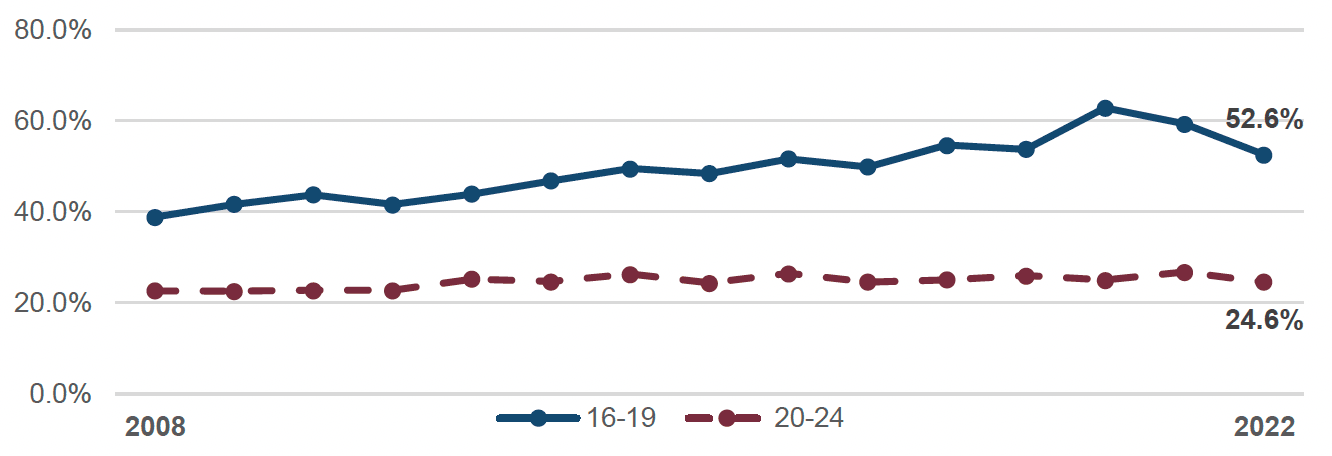
Source: Annual Population Survey. Due to the COVID-19 pandemic, data between 2020 and 2021 should be interpreted with caution. Data corresponds to time from January to December in any given year.
In 2022 the inactivity rates were higher for disabled young people in this cohort (54.9% versus 31.2%; Figure 7) (see Annex A for definition of disabled). From 2014 up to 2022, there have been fluctuations in inactivity amongst disabled young people. In 2016, disabled inactive young people accounted for 56.8% of disabled 16-24 years old. This figure dropped in 2017, followed by an increase again in 2018. When looking at the non-disabled cohort, figures have remained stable since 2014.
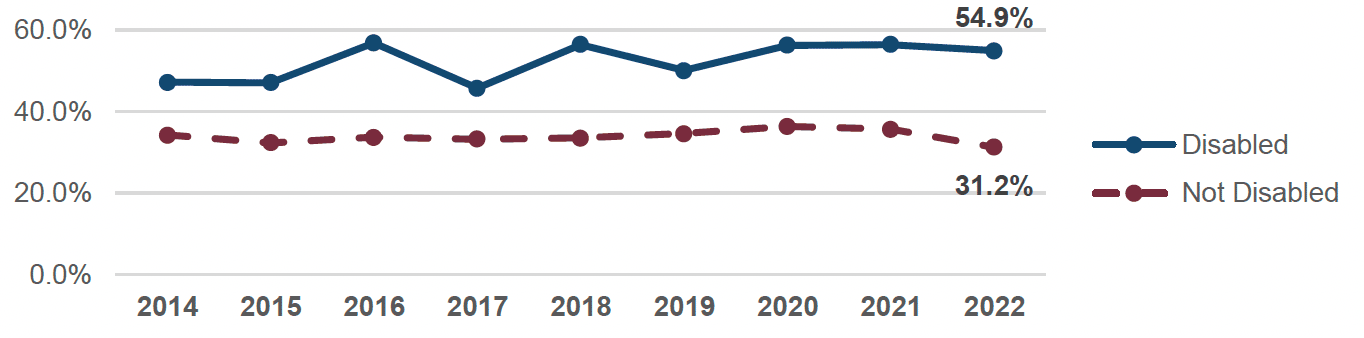
Source: SG dashboard on Disabled people in the labour market in Scotland. Data covers January to December on each given year.
Annual Participation Measure
The Annual Participation Measure (APM) published by Skills Development Scotland (SDS) explores non-participation rates by providing a breakdown of unemployed 16-19 years old that are either seeking or not seeking employment. The latest data shows that 4.0% of the 16-19 cohort were not participating in education, training or employment (Table 3). This breaks down as 2% unemployed and seeking a job, and the other 2% unemployed and not seeking work – including status such as under custody (0.0%), unavailable due to ill health (0.4%) and economically inactive (1.6%). It is important to highlight when interpreting these figures that 3.6% of this cohort is reported under the unconfirmed status, with 7.9% of them being 19 years old.
| 16-19 years old | 16 | 17 | 18 | 19 | |
|---|---|---|---|---|---|
| Participating in education, employment or training | 92.4% | 99.3% | 95.7% | 89.8% | 84.2% |
| Not participating in education, employment or training | 4.0% | 0.6% | 2.6% | 5.2% | 7.9% |
| Unemployed and seeking job | 2.0% | 0.3% | 1.1% | 2.3% | 4.3% |
| Unemployed and not seeking job | 2.0% | 0.3% | 1.4% | 2.9% | 3.7% |
| Unconfirmed numbers | 3.6% | 0.1% | 1.7% | 5.1% | 7.9% |
Source: Annual Participation Measure. For further caveats of this data please see Annex B.
In the group not participating – unemployed and not seeking a job, the focus will be on the 1.6% of young people who are economically inactive. Table 4 shows an increase from the 1.4% reported to be inactive in 2021. This increase could be explained by the inclusion of the Universal Credit as explained in Annex B. Out of these 1.6% economic inactive, 2.9% were 19 years old and 1.7% were female while 1.5% were male. The gender split is different from APS data presented earlier, however it is possible that the difference can be explained by the unconfirmed status data (3.3% female versus 4% male). Regarding ethnicity, 1.6% of inactive young people were white while 2.6% did not disclose that information.
| 2020 | 2021 | 2022 | ||
|---|---|---|---|---|
| Economically inactive | 1.1% | 1.4% | 1.6% | |
| Sex | Female | 1.2% | 1.5% | 1.7% |
| Male | 0.9% | 1.4% | 1.5% | |
| Ethnicity | White | 1.1% | 1.4% | 1.6% |
| Mixed or Multiple; Asian; African; Caribbean or Black; and other ethnic groups | 0.7% | 0.9% | 0.9% | |
| Not Known / Not Disclosed | 1.8% | 2.2% | 2.2% | |
Source: Annual Participation Measure. For further caveats of this data please see Annex B.
In 2022, 1.7% of young people were economically inactive and lived in large urban areas. When looking at accessible rural areas, 1.2% of young people were economically inactive. These figures remained relatively stable between 2021 and 2022 (in 2021, 1.6% for young people living in large urban areas and 1% for young people living in accessible rural areas) (Table 5).
| 2020 | 2021 | 2022 | |
|---|---|---|---|
| Accessible Rural | 0.8% | 1.0% | 1.2% |
| Accessible Small Towns | 0.9% | 1.2% | 1.3% |
| Large Urban Areas | 1.2% | 1.6% | 1.7% |
| Other Urban Areas | 1.2% | 1.5% | 1.8% |
| Remote Rural | 0.6% | 0.8% | 1.0% |
| Remote Small Towns | 1.1% | 1.2% | 1.8% |
| Not Known | 0.0% | 4.3% | 0.0% |
Source: Annual Participation Measure. For further caveats of this data please see Annex B.
When it comes to disability, in 2022, young people economically inactive and disabled accounted for 3.9% of the sample. This was an increase of 0.4 pp from 2021, and an increase of 1.2 pp from 2020 (Table 6).
| 2020 | 2021 | 2022 | |
|---|---|---|---|
| Identified as disabled | 2.7% | 3.5% | 3.9% |
| Not identified as disabled | 1.0% | 1.3% | 1.5% |
Source: Annual Participation Measure. For further caveats of this data please see Annex B.
SIMD (Scottish Index of Multiple Deprivation) breakdown shows that in 2022 young people economically inactive living in the 20% most deprived areas of Scotland represented 2.9%. In the previous year, this figure was of 2.5% (Table 7).
| 2020 | 2021 | 2022 | |
|---|---|---|---|
| Q1 – 20% most deprived | 2.1% | 2.5% | 2.9% |
| Q2 | 1.4% | 1.9% | 2.0% |
| Q3 | 0.9% | 1.1% | 1.4% |
| Q4 | 0.6% | 0.9% | 0.9% |
| Q5 - 20% least deprived | 0.3% | 0.5% | 0.6% |
| Not known | 0.0% | 4.3% | 0.0% |
Source: Annual Participation Measure. For further caveats of this data please see Annex B.
Contact
Email: socialresearch@gov.scot
There is a problem
Thanks for your feedback