Public sector: economic overview
This analytical note brings together key economic data and analysis in relation to the Scottish public sector, covering both its size and pay levels. It considers how the size and employment in the public sector has changed over time and how it compares to other parts of the UK and internationally.
GVA and output per hour
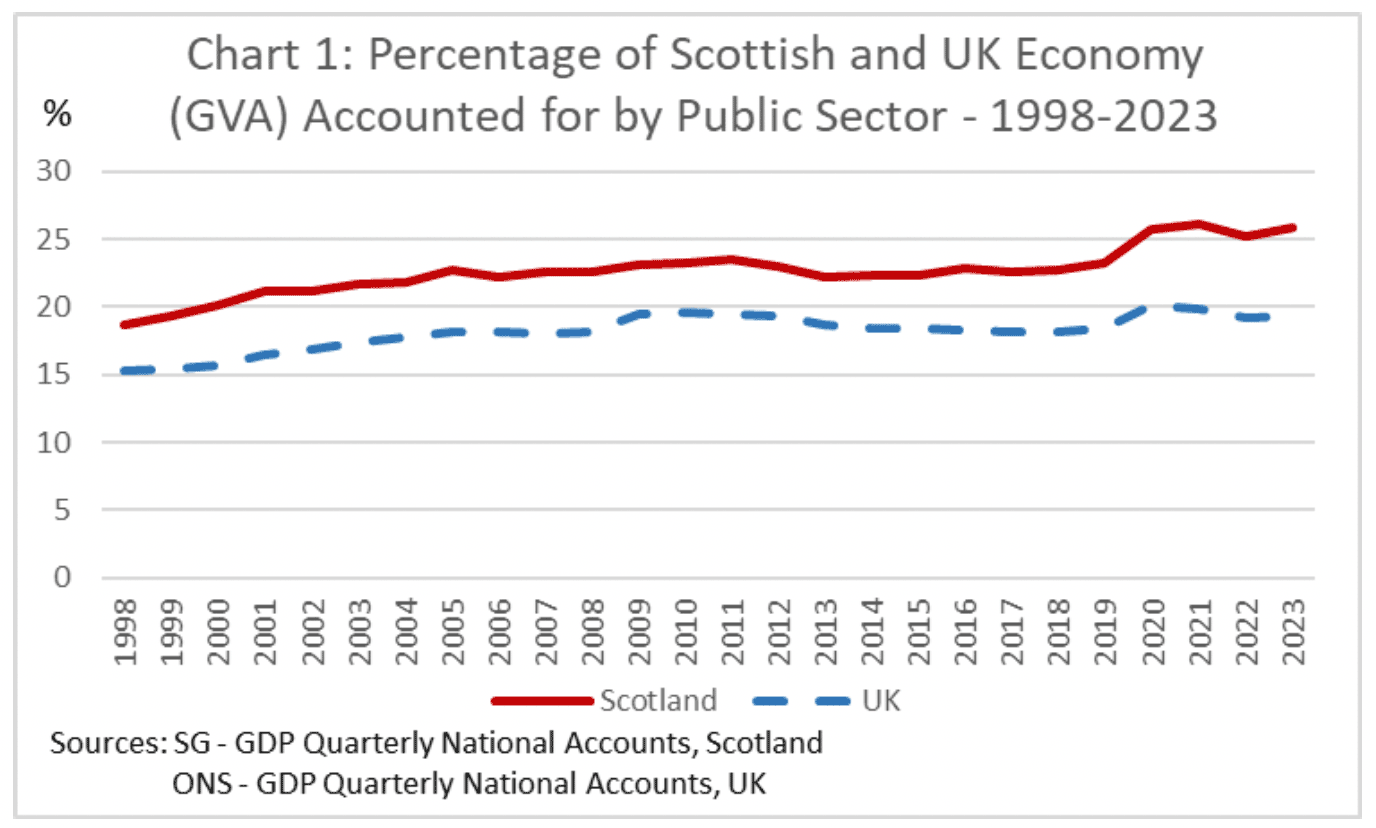
Over the past 20 years, the public sector in Scotland has, on average, accounted for around 22% of the economy (GVA) and 21% of total employment. Similarly, public spending as a share of the economy is higher in Scotland, at 51% compared to 46% in the UK.
The size of the public sector in Scotland, across all measures, has been consistently higher than the UK (around 4 percentage points higher). Chart 1 below compares the size of the public sector in Scotland and the UK, using the share of GVA.
As set out in the recent ONS Public Services Productivity Review, measuring productivity in the public sector is challenging.[1] Public services are normally provided free at the point of use, and there are often not clear measures of service delivery. Measures of public sector productivity often focus on outputs, such as the number of NHS operations performed or arrests made, rather than outcomes, such as the health of the population or overall security people feel in their communities. Links between these outputs and outcomes are often unclear. For example, if the number of arrests made by the police were to fall, this could be interpreted as either falling productivity, were the police to be less effective at arresting criminals, or rising productivity, were the police to be more effective at deterring crime. Crime itself may also reflect wider social factors, rather than directly reflecting the productivity of the police force.
Similarly, even when there are good measures of service delivery, such as in the NHS, where it is possible to measure number of GP appointments and operations delivered, there can be challenges in measuring the quality of public services. For example, the complexity or duration of activity provided by the NHS will be changing over time.
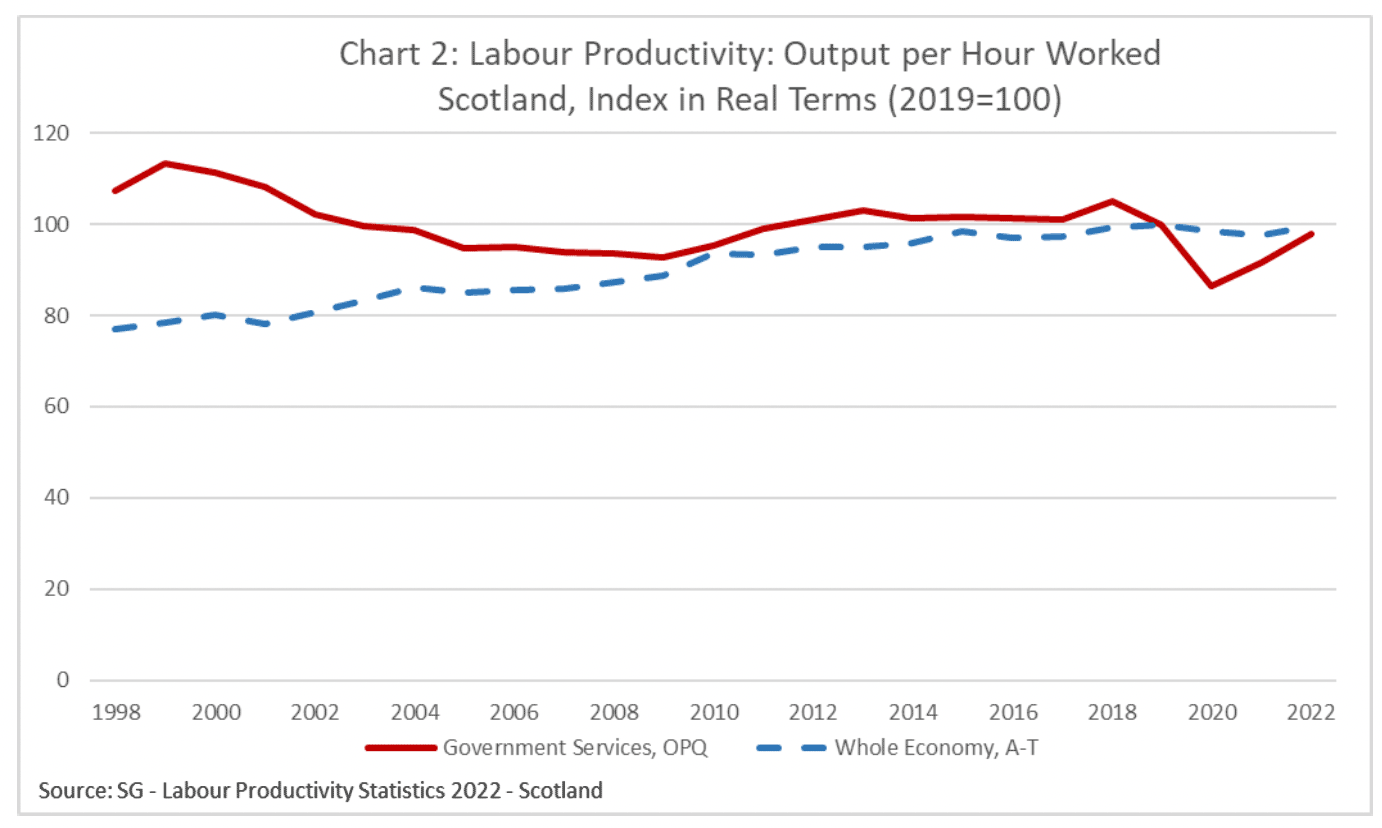
Nonetheless, an efficient and productive public sector is essential to delivering effective public services. The charts below compare productivity, as measured by economic output per hour worked, in the public and the wider economy, and for Scotland and the UK.
Chart 2 shows that public sector productivity has been broadly flat in Scotland over the last two decades. This is in contrast to productivity in the economy as a whole, which has grown over the period.
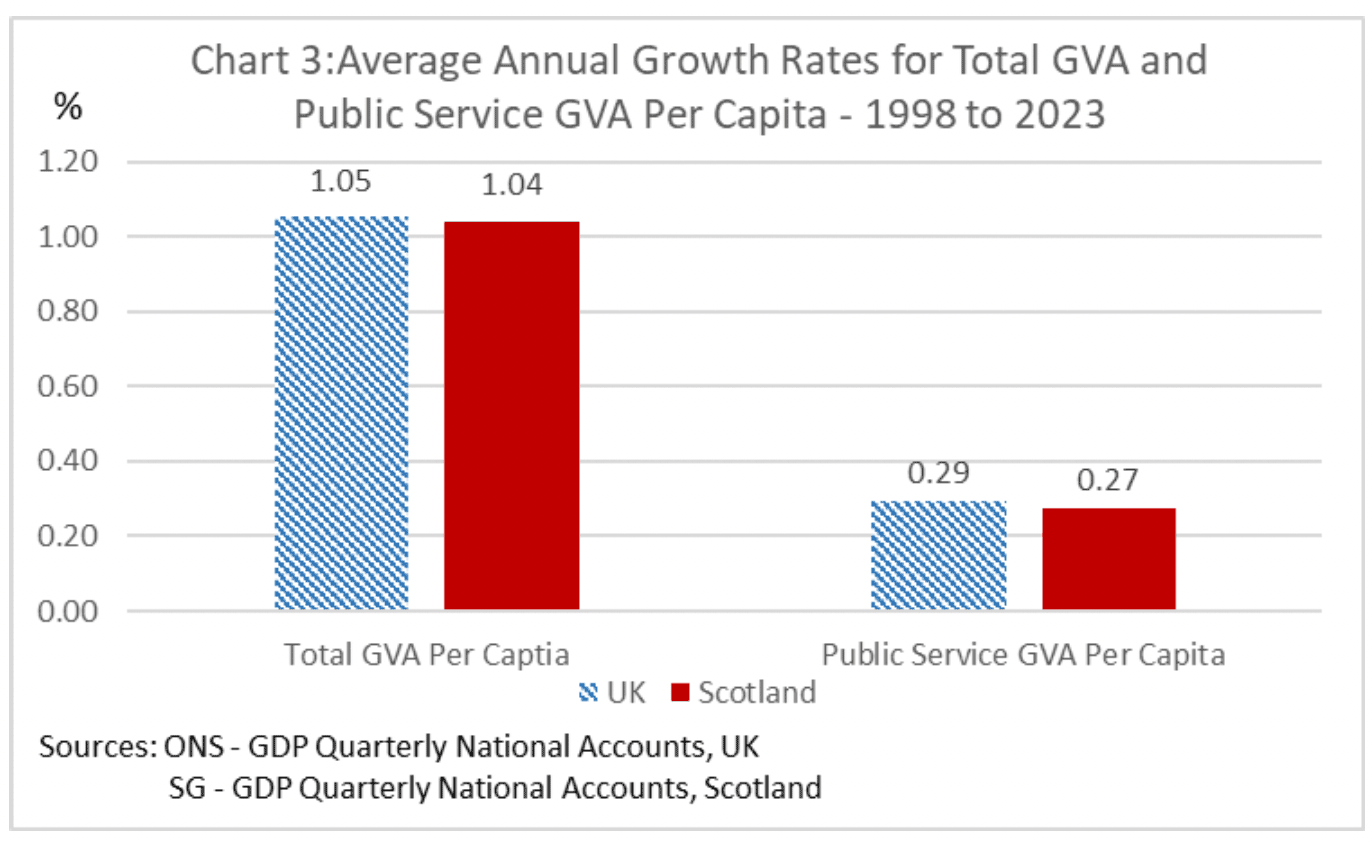
As highlighted in Chart 3, Scotland’s productivity performance has been very similar to the UK’s since 1998, with public service GVA per person growing slower than the wider economy. This highlights that the productivity challenges the public sector faces are not unique to Scotland, but are common to the UK as a whole.
Contact
Email: OCEABusiness@gov.scot
There is a problem
Thanks for your feedback