Public sector: economic overview
This analytical note brings together key economic data and analysis in relation to the Scottish public sector, covering both its size and pay levels. It considers how the size and employment in the public sector has changed over time and how it compares to other parts of the UK and internationally.
Employment
Trends in employment
Public sector employment in Scotland has grown over the last four years, as shown in Figure 1. Over the last year, it has increased by around 10,500, with the public sector accounting for 22.2% of total employment. The Scottish public sector is now broadly the same size as it was between 2005 and 2008. For consistency, all figures in this publication refer to public sector figures excluding the effects of reclassification changes.
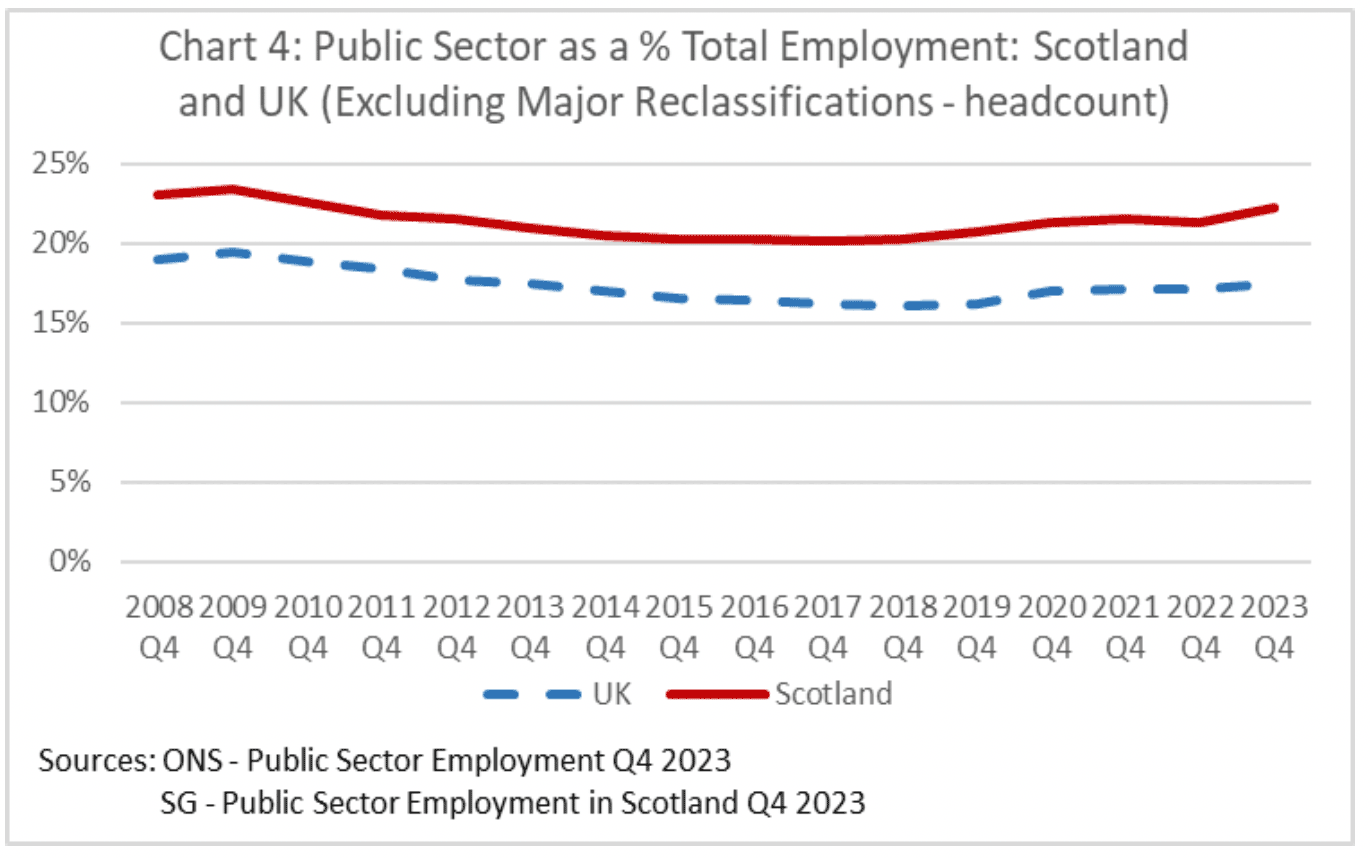
A similar trend is seen in the UK, where public sector employment has increased by around 140,000 over the last year, and now accounts for 17.5% of total employment. In headcount terms, the UK public sector is now the largest it has been since records began in 1999, and as a share of total employment it is the largest since 2013.
In both Scotland and the UK, the increase in the size of the public sector has been driven by increased employment in the NHS. In Scotland, NHS employment has increased by 3.4% over the last year, compared to growth of 1.1% in the rest of the public sector.
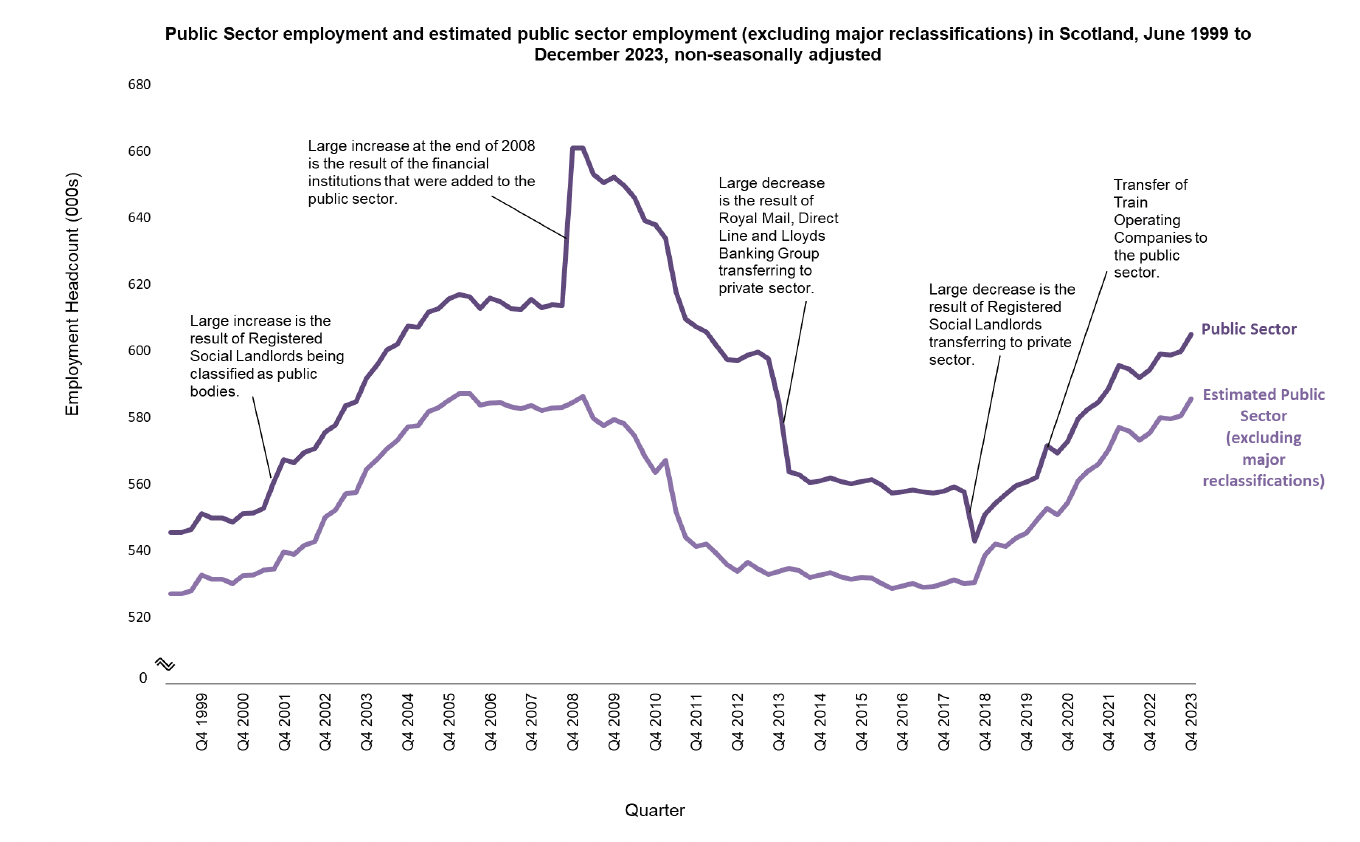
Source: Public Sector Employment Statistics Scotland 4th Quarter 2023
One factor to bear in mind when looking at the size of the public sector is that it can be affected by bodies being moved in and out of the public sector. This is known as reclassification. The public sector increased notably in size in 2008 when the UK government bought significant shareholdings in RBS and Lloyds Banking Group, bringing them into the public sector. More recently, Train Operating Companies across the UK were brought into the public sector during the pandemic following the introduction of Emergency Measures Agreements to mitigate the financial impacts of COVID-19. Figure 1 shows significant changes in the coverage of the public sector in Scotland.
However, the size of the public sector also reflects changes in the way that public services are delivered. In the devolved public sector, Social Security Scotland was added to the public sector series in the third quarter of 2018. It has grown in size over time to a headcount of just over 4,000[2] as it has introduced 14 Scottish Government benefits, seven of which are available only in Scotland (such as the Adult Disability Payment which replaced the Personal Independence Payment delivered by DWP and the Child Disability Payment which replaced the Disability Living Allowance for Children delivered by DWP and Scottish Child Payment which is unique to Scotland).
On a like for like basis – excluding major reclassifications – the current level of public sector employment is on a par with levels seen between 2005 and 2008, when it was around 585,000.
Chart 4 shows a timeseries of public sector employment as a share of total employment, excluding the effect of major reclassifications.
Devolved and reserved public sector employment
In 2023 there were around 605,000 public sector employees in Scotland. These employees are primarily within the devolved public sector, which accounts for around 90% of public sector employment, with the remaining 10 per cent in the reserved public sector. Within the devolved public sector, Local Government and the NHS account for just over 80% of employment.
Both devolved and reserved headcount in public sector increased over the last year. Figure 2 shows the devolved public sector headcount and figure 3 shows the reserved position.
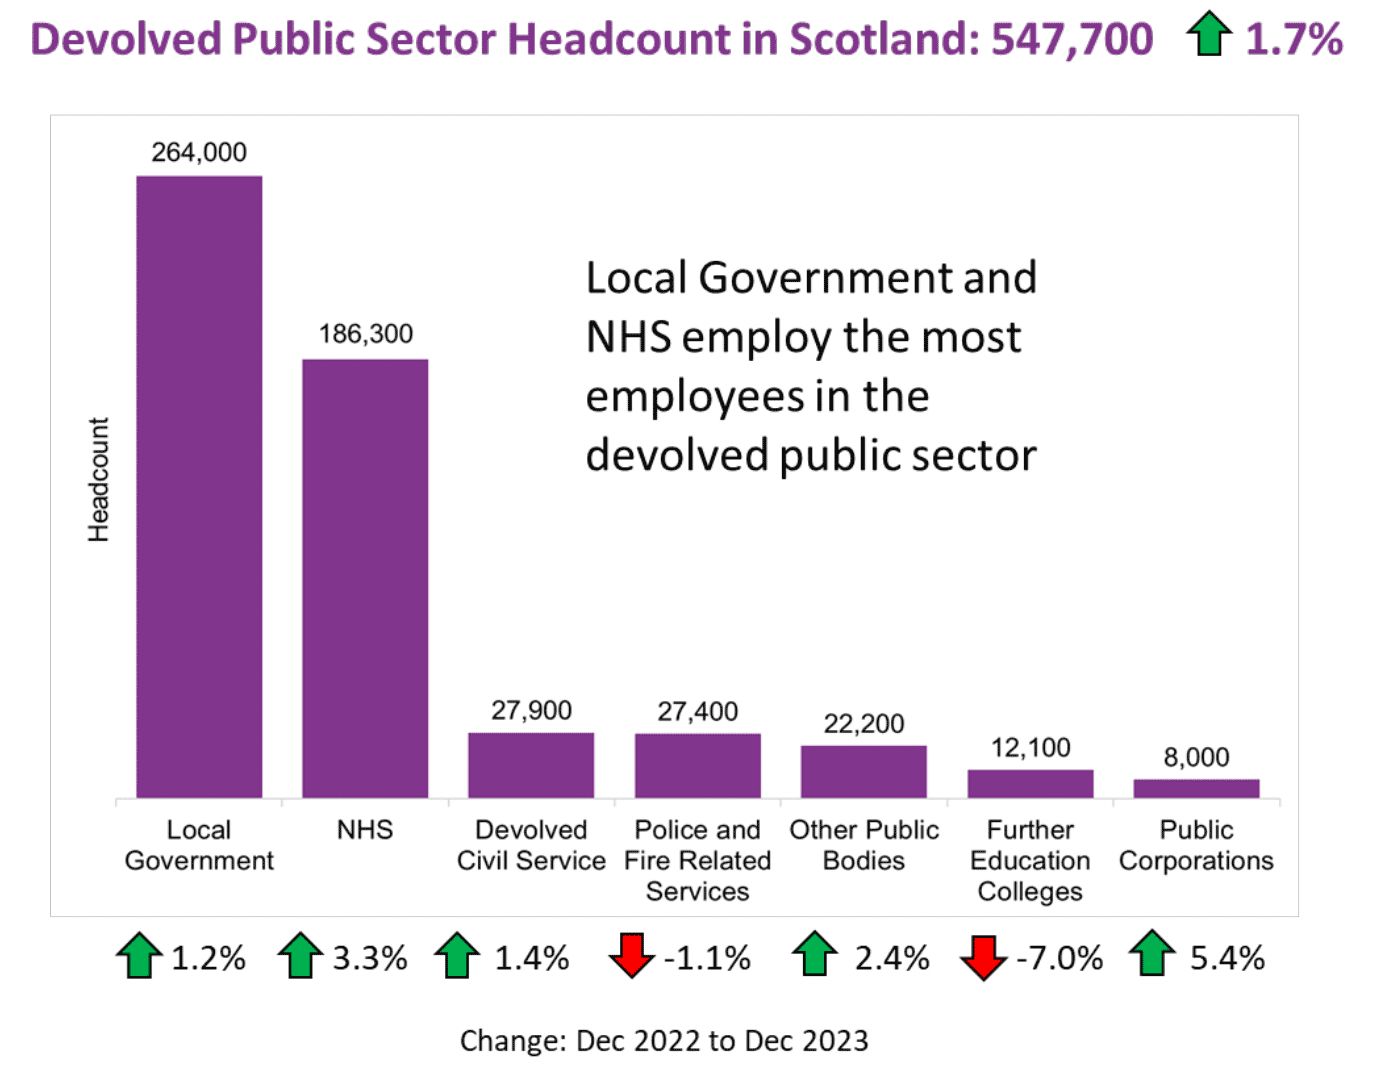
Source: Public Sector Employment Statistics Scotland 4th Quarter 2023
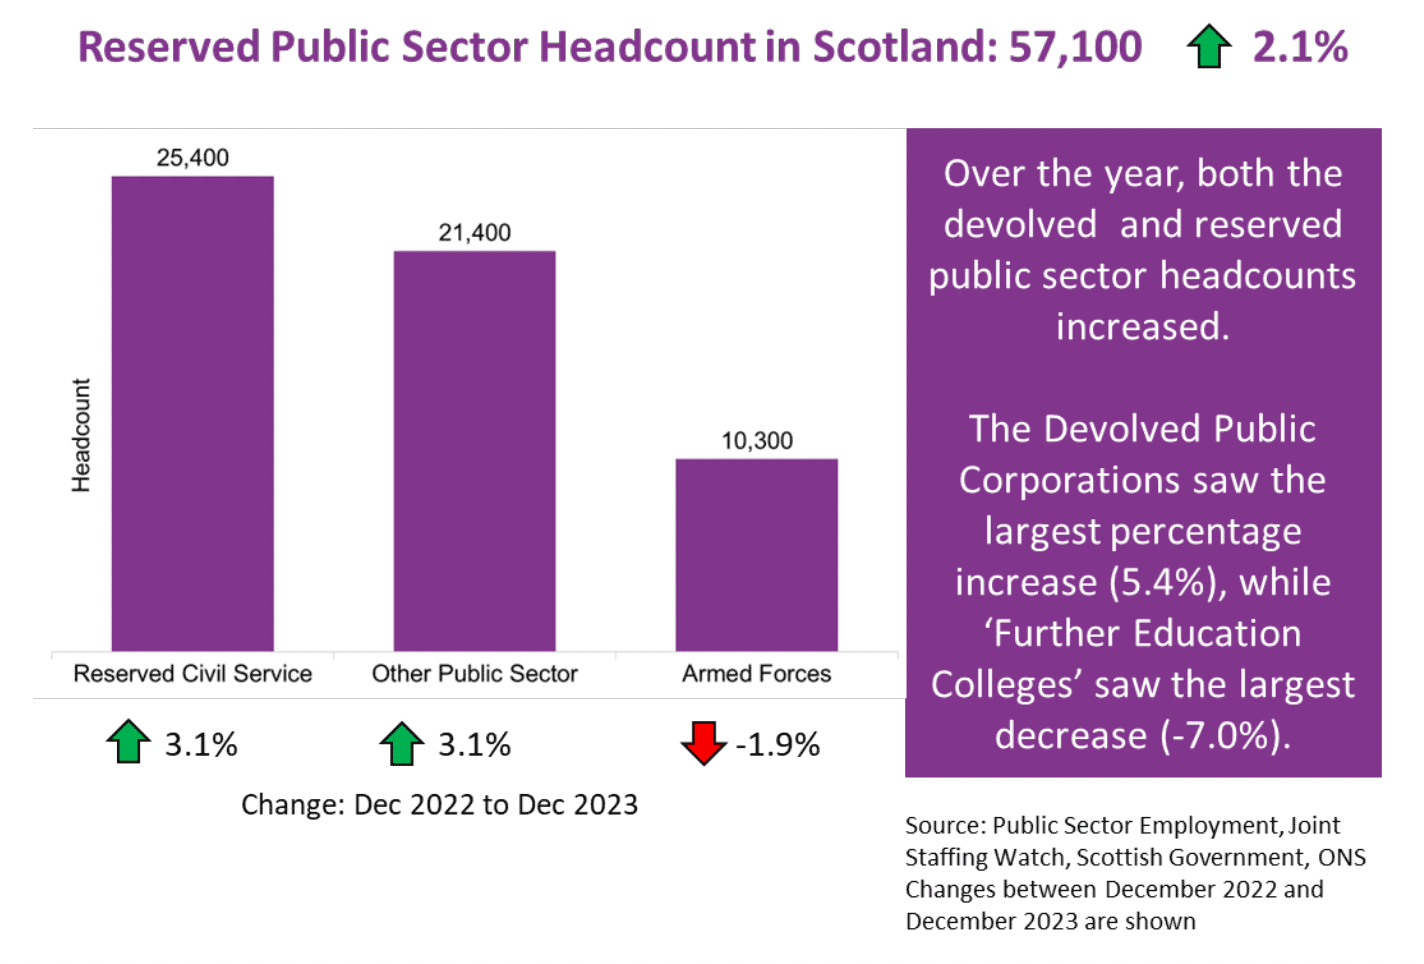
Source: Public Sector Employment Statistics Scotland 4th Quarter 2023
Regional differences in public sector employment
The public sector is an important employer across the whole of Scotland, although there is significant variation in the share of public sector employment between different local authorities as shown in Chart 5. In Scotland, Aberdeenshire has the lowest share, whilst Shetland, Orkney, Dundee and Na h-Eileanan Siar have the highest shares.
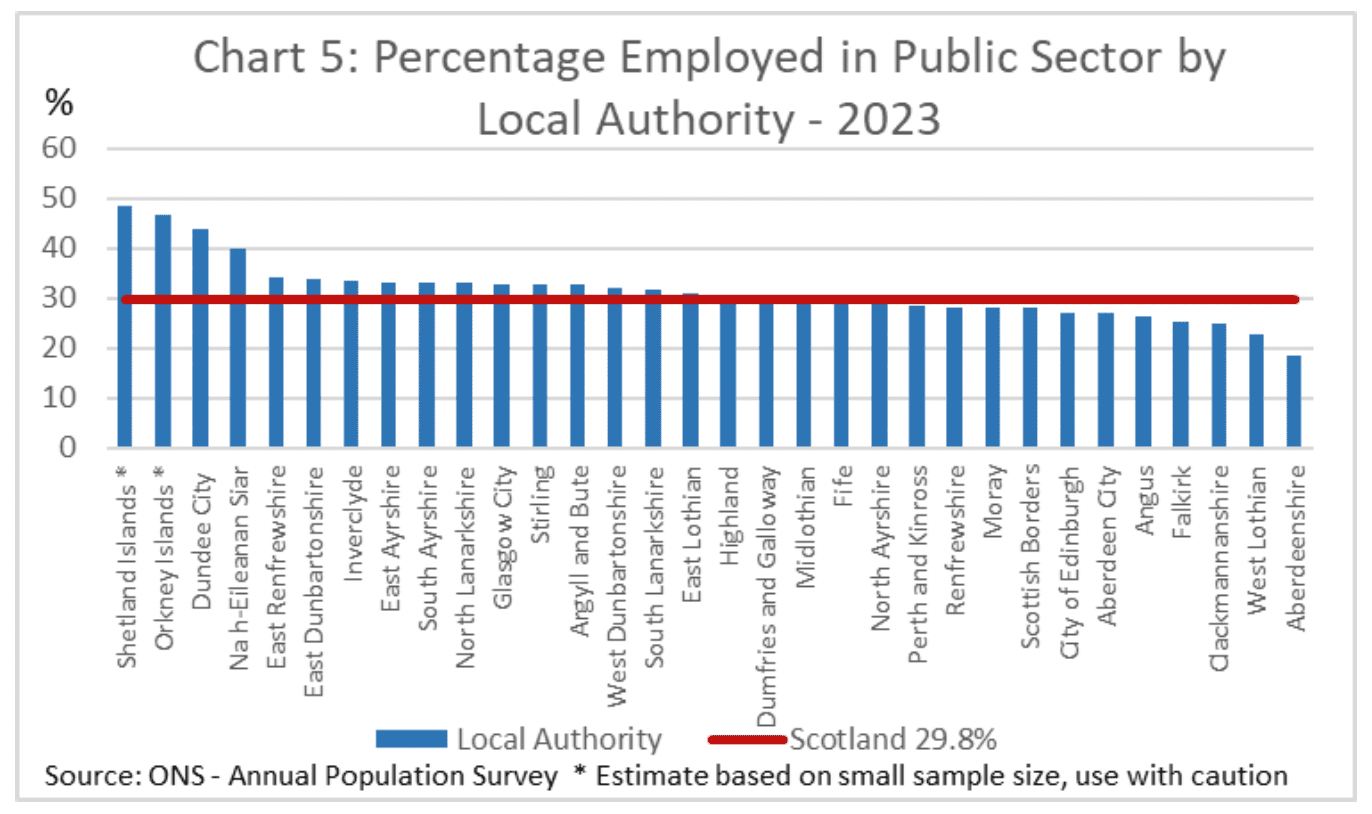
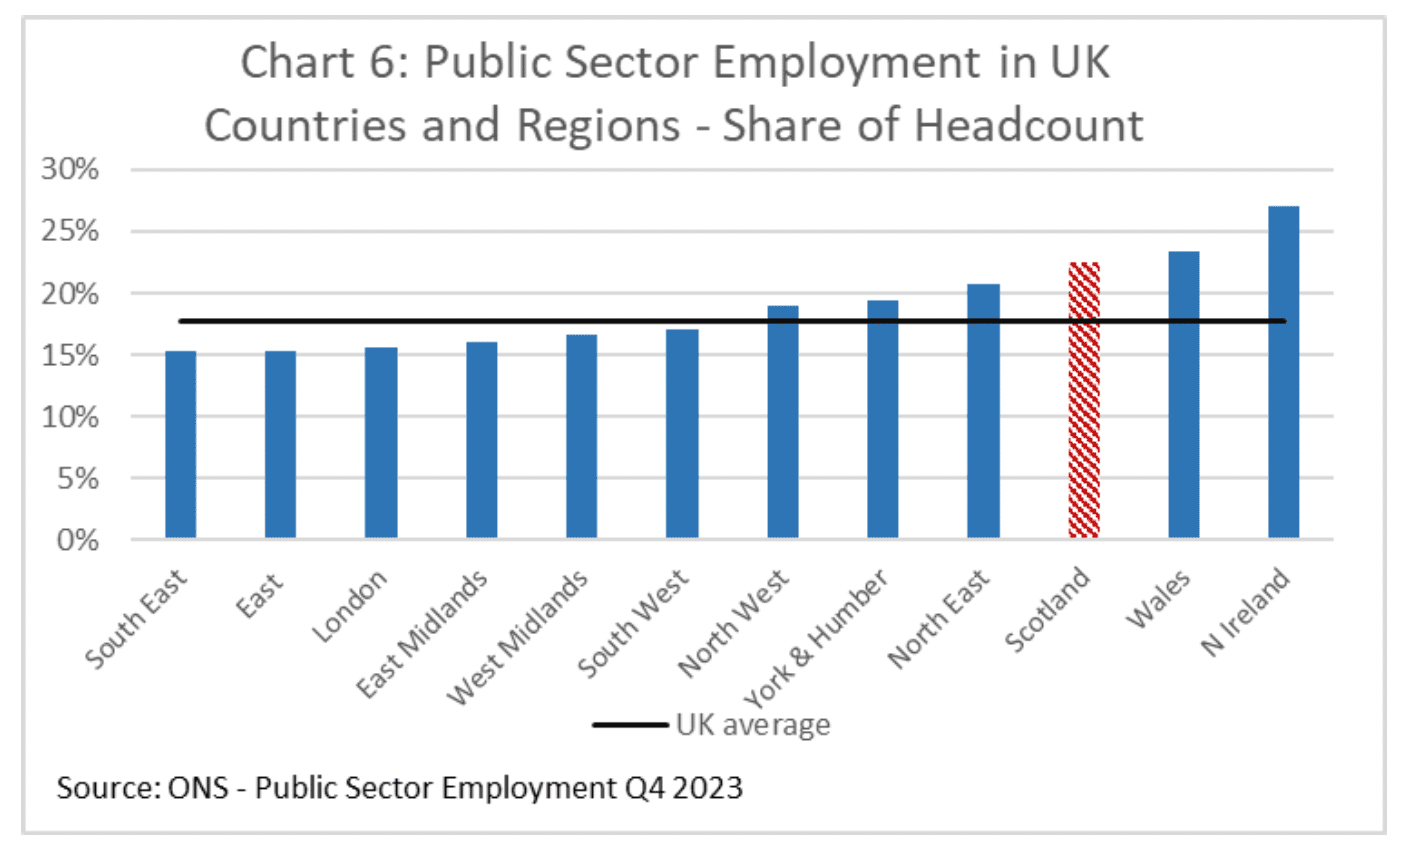
Chart 6 shows public sector employment in UK countries and regions. Looking across the UK, Scotland has a relatively high share of employment in the public sector, with only Wales and Northern Ireland having a higher share.
International differences in public sector employment
As with intra-UK comparisons, international comparisons are affected by differences in which services are delivered by the public sector in different countries. In particular, both healthcare and education are primarily delivered by the public sector in the UK.
Chart 7 compares the general government employment share in Scotland to other OECD countries. General government is the standard measure for international reporting, but excludes public corporations such as Scottish Water. This means that Scotland’s general government share is slightly lower than the overall public sector share reported above.
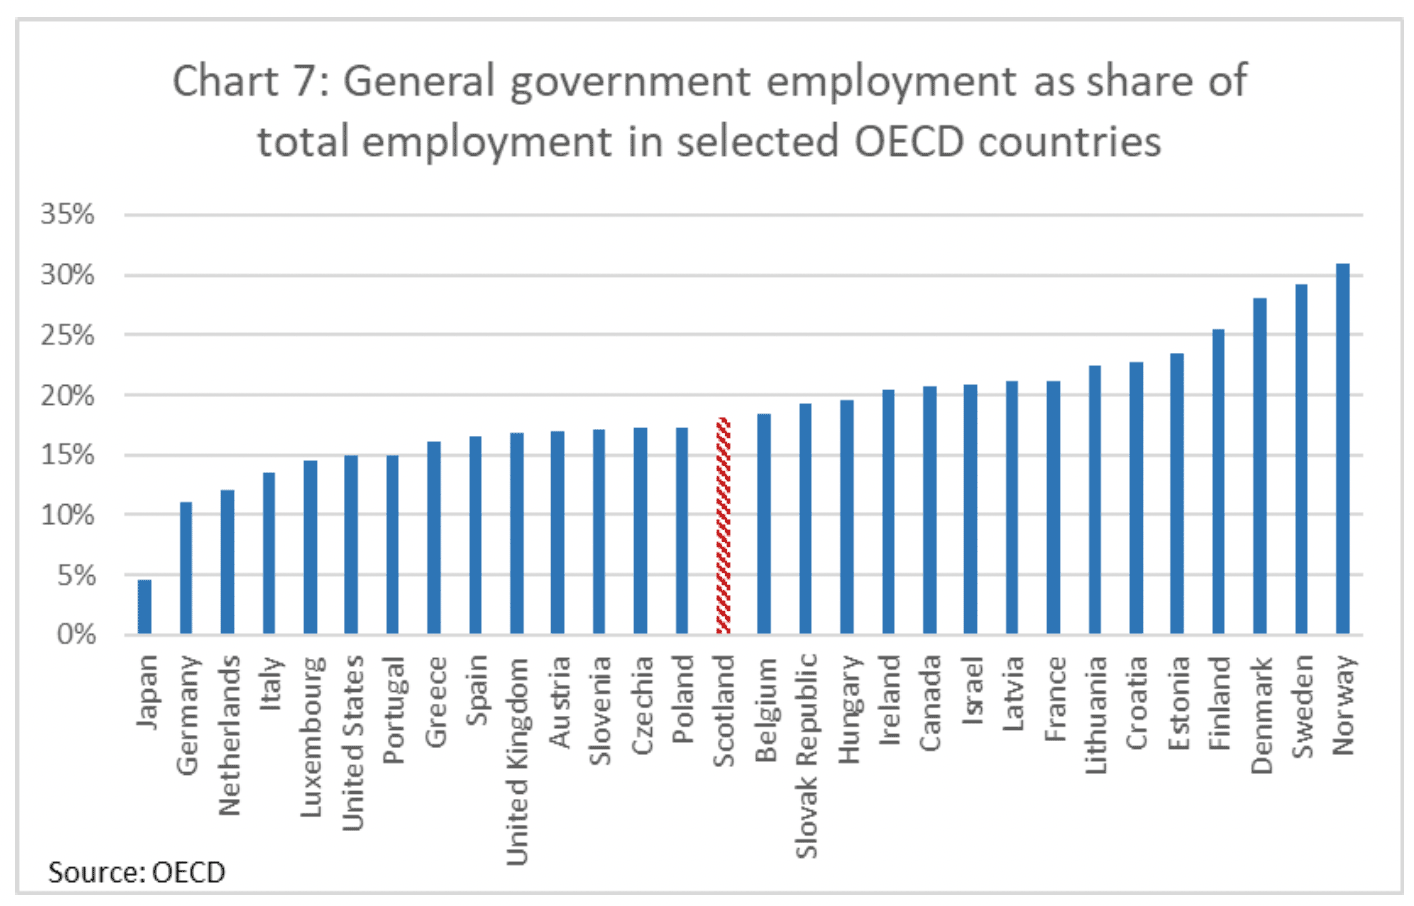
The UK has a broadly similar share of employment in general government as the US at around 15%, whilst Scotland has a similar share to Belgium at around 18%. Scandinavian countries have much higher shares of employment in public sector. However, as noted above, international comparisons need to be treated with caution, as they can be sensitive to coverage differences. For example, excluding the NHS for Scotland would bring Scottish general government employment down to around 12%.
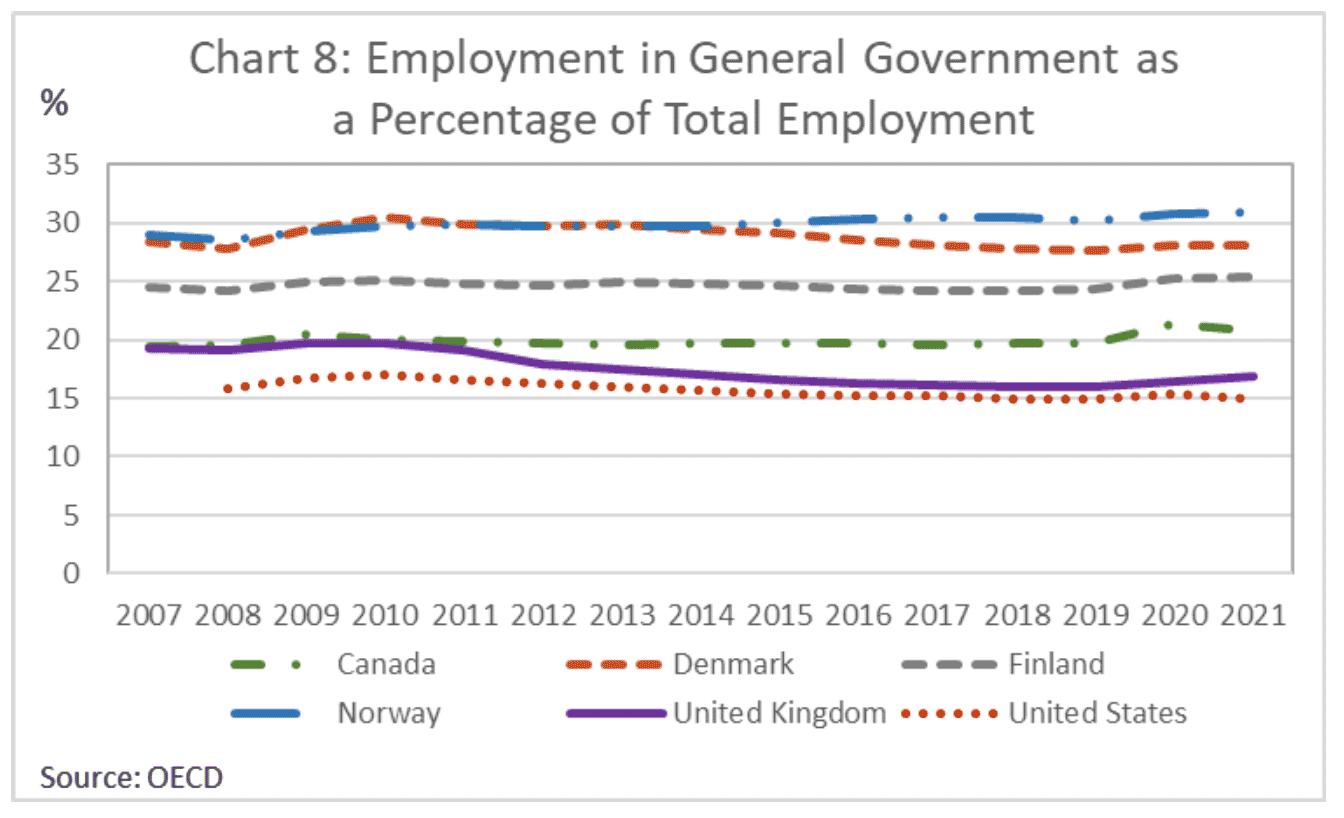
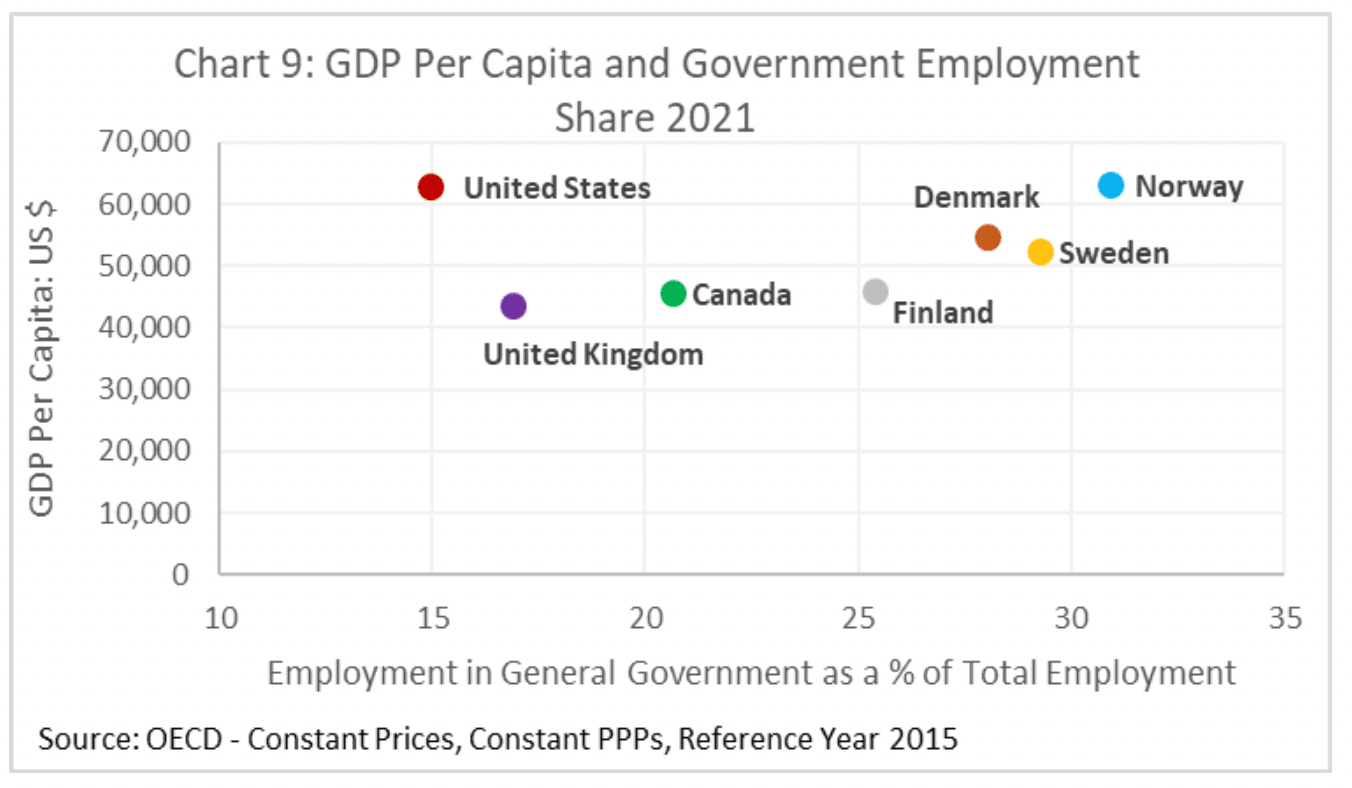
Charts 8 and 9 look in more detail at selected countries over time and at GDP per capita. There is no clear relationship between size of the public sector and economic performance across these selected countries, in terms GDP per person. As shown, the US has a relatively small public sector and relatively high GDP per person; however, Scandinavian countries have both a relatively large public sector and relatively high GDP per person. This finding is reflected in academic literature, which has no clear consensus of the relationship between the size of the public sector and economic performance. Many academics have argued that the public sector has an important role in driving innovation in the economy,[3] and the OECD has previously called for public policy to focus on improving the efficiency of public services, both in terms of tax systems and public spending.[4]
Contact
Email: OCEABusiness@gov.scot
There is a problem
Thanks for your feedback