Non-binary people's experiences in Scotland: evidence review
Presents evidence which offers useful insight into the experiences of non-binary people in Scotland. Primarily, the evidence suggests that non-binary people face discrimination in multiple sectors of society such as education, communities, work, benefits and housing.
Demographics
Demographic population statistics are important to consider as they can inform support, infrastructure and service provision for particular population groups.
Scotland’s Census 2022
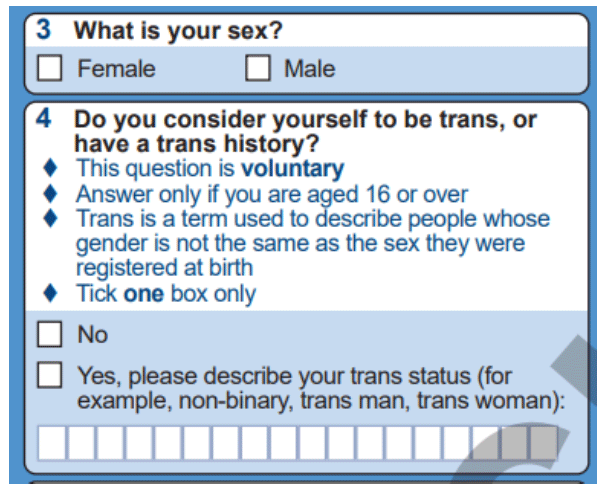
Scotland’s Census 2022 included a new question on trans status or history in 2022.
The question was, “Do you consider yourself to be trans, or have a trans history?”. People were asked to tick “No” or “Yes”. People who ticked “Yes” were asked to describe their trans status (and were given the examples of non-binary, trans man, trans woman).

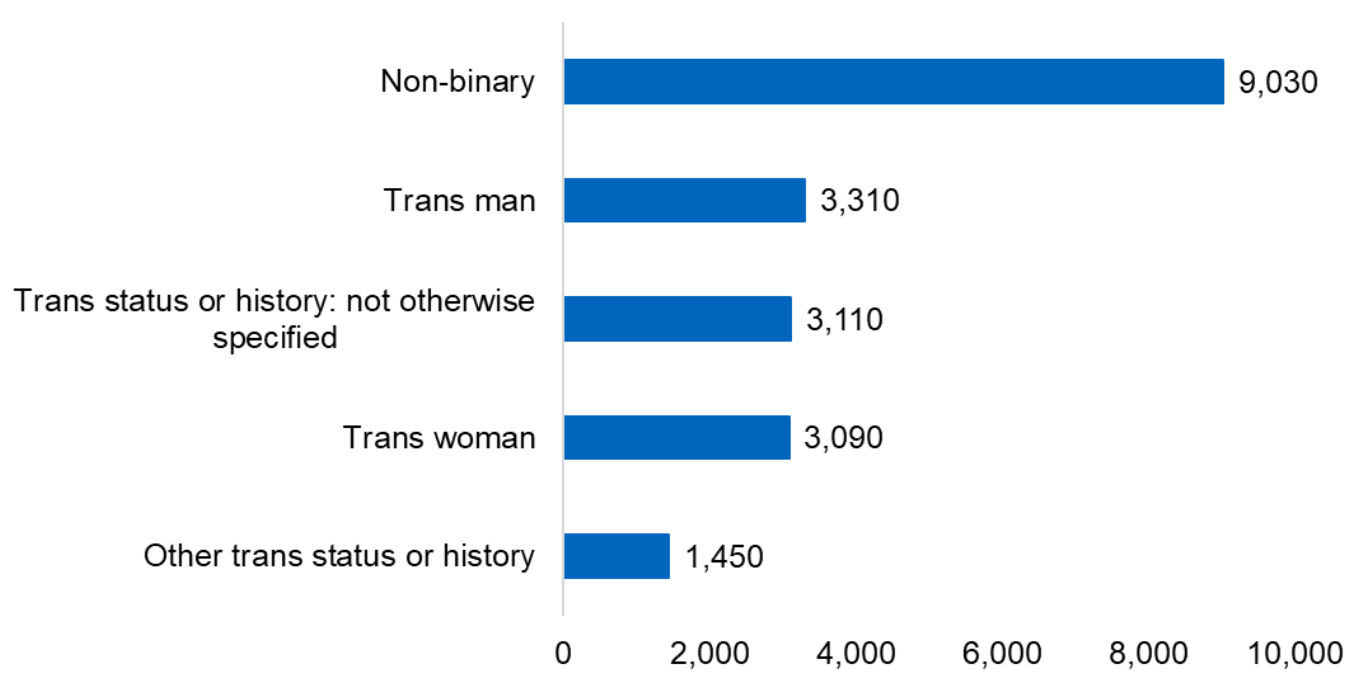
In 2022, Scotland’s Census found that 19,990 people reported being trans or having a trans history (0.44% of people aged 16 and over). Almost half (45.2%) of trans people in Scotland identify as ‘non-binary’. This is 9,030 people in total.

Data source: Scotland’s Census 2022
Please note, numbers are rounded to the nearest ten.
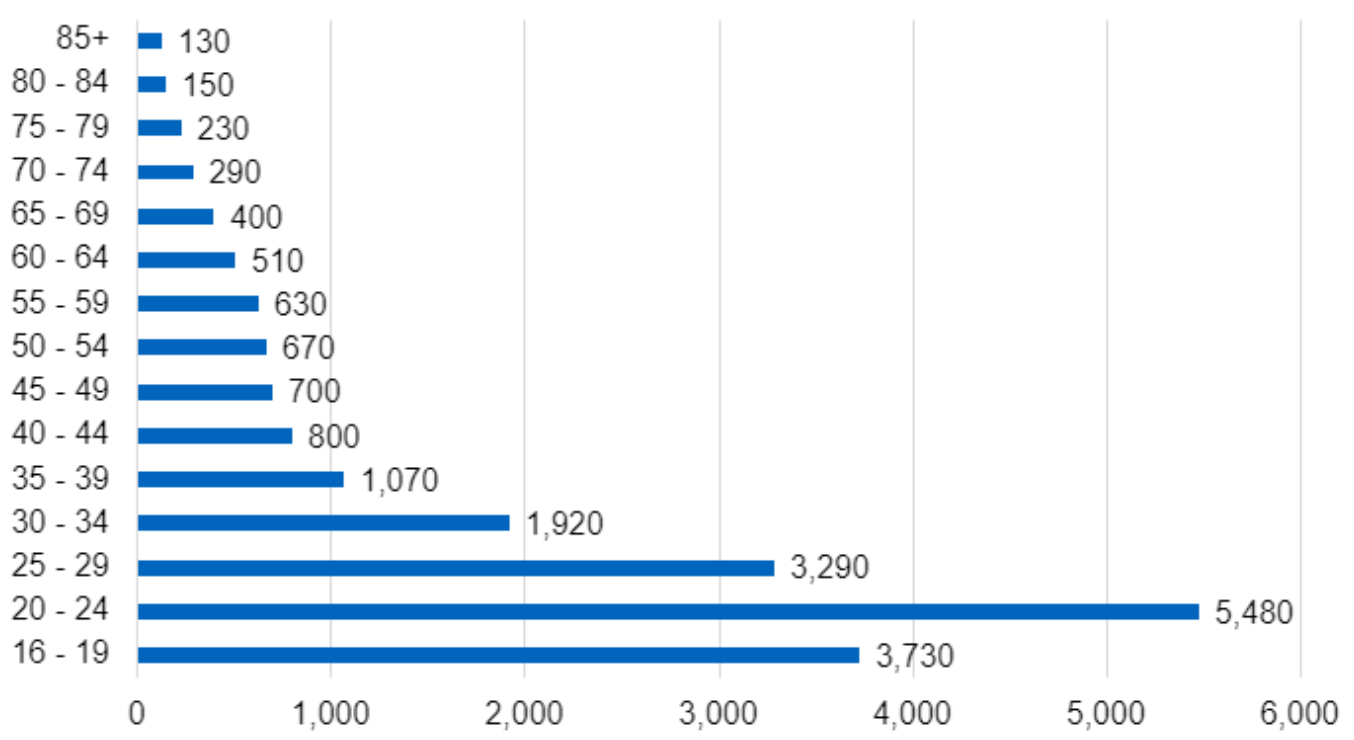
Figure 3 shows how the number of trans people varied across age groups. There were more trans people in younger age groups than in older groups. Almost half (46.1%) of trans people were aged 16 to 24. Around a quarter (26.0%) were aged 25 to 34.

Data source: Scotland’s Census 2022
Please note, numbers are rounded to the nearest ten.
For non-binary people specifically, the proportion in younger age groups is more pronounced. The Scotland’s Census 2022 data showed, just over half (52.6%) of non-binary people were aged 16 to 24, and almost a third (30.0%) were aged 25 to 34[9]. This is consistent with previous survey findings from the National LGBT Survey 2017[10]. This survey was self-selected and had a higher proportion of young people responding to the survey overall therefore is not representative of the population. Table 1 shows breakdowns of age groups for trans and nonbinary respondents in Scotland’s Census 2022 and non-binary respondents in the National LGBT Survey 2017[iii]. Age brackets presented in this table are not uniform but have been presented in this way to enable comparisons across Scotland’s Census 2022 and the National LGBT Survey 2017.
| Age | Scotland’s Census 2022: Proportion of Trans or those having a trans history across age groups (%) | Scotland’s Census 2022: Proportion of non-binary people across age groups (%) | National LGBT Survey 2017: Proportion of non-binary people across age groups (%) |
|---|---|---|---|
| 16-24 | 46.07 | 52.6 | 61.1 |
| 25-34 | 26.04 | 30.0 | 22.6 |
| 35-44 | 9.3 | 8.3 | 8.9 |
| 45-64 | 12.6 | 6.8 | 6.6 |
| 65 and over | 5.97 | 2.4 | 0.8 |
Local Authority
As outlined above, the percentage of trans people is higher in younger age groups. The spread across council areas reflects this. The four ‘City’ council areas have large student populations and relatively high numbers of young people.
As we would therefore expect, these four ‘City’ council areas have the highest percentage of trans people relative to their population (aged 16 and over)[11]. Dundee City had the highest percentage (0.91%), followed by City of Edinburgh and Glasgow City (both 0.77%), and Aberdeen City (0.58%)[12].
Comparison with the England & Wales 2021 Census by Trans Category
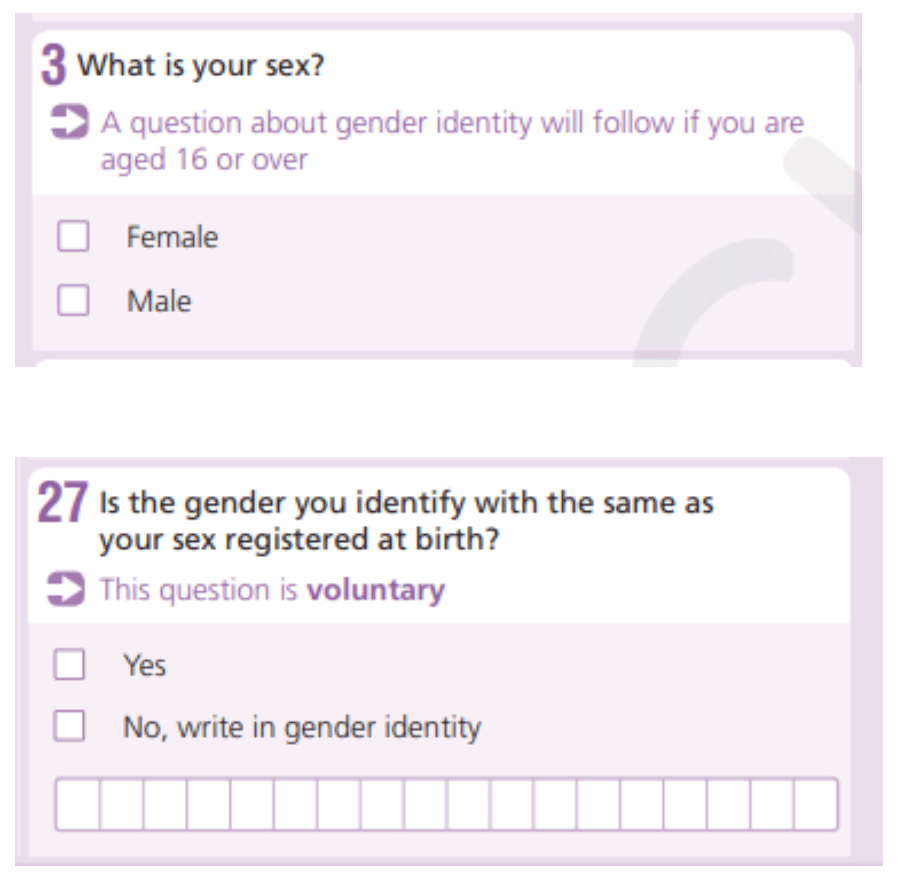
People were asked in the 2021 England and Wales Census, “Is the gender you identify with the same as your sex registered at birth?” and had the option of selecting either “Yes” or selecting “No” and writing in their gender identity[13].

The data from the England and Wales Census found that 0.5% of the population reported having a gender identity that is different from their sex registered at birth. Of those who answered that their gender identity is different to their sex registered at birth, approximately 12% used the write-in option to state that they identify as non-binary (0.06% of the population aged 16 years and over).
When comparing Scotland’s Census and the Census for England and Wales, there is a “relatively large difference”[15] in the non-binary category, where the proportion of people in Scotland is higher at 0.20%, compared with 0.06% in England & Wales. This difference may be due to the inclusion of non-binary being provided as a specific example of a trans status on the questionnaire in Scotland.
These results reflect that the way in which these questions were asked in the two censuses was different and users should be cautious when interpreting differences between Scotland and England & Wales. The Office of National Statistics and National Records of Scotland (ONS and NRS) are working together to compare the performance of the two questions and will use this to inform future developments.
Scottish Government Surveys
The recommended questions from the Scottish Government’s Office of the Chief Statistician’s ‘Sex, gender identity, trans status - data collection and publication guidance’ have been widely implemented across government surveys and data collections[16]. From 2022 onwards, it was recommended that respondents are asked about their sex and trans history and status separately. For sex, there are three response options: “Male”, “Female” and “Prefer not to say”. For trans history and status, there are two response options: “Yes” and “No”. Those who select “Yes” for the trans history and status question can record their trans status, for example ’non-binary' in a free text box.
The Scottish Survey Core Questions (SSCQ)[17] dataset aligns to these question structures and is harmonised for three surveys: the Scottish Household Survey, the Scottish Health Survey and the Scottish Crime and Justice Survey. However, the SSCQ is not currently publishing results due to the uncertainty of a small number of respondents reporting a trans history and status and concern for anonymity of respondents.
Intersectional Equality Characteristics
There is currently limited available information about non-binary people who have multiple equalities characteristics[iv] in Scotland. Some of the existing evidence reports on these intersecting equalities characteristics, however these cannot be extrapolated to population level.
An older piece of research, Equality Network’s “Minority Ethnic LGBT People in Scotland” [18] report highlights a lack of research considering the specific intersection of ethnicity and gender identity. The researchers found that people who are LGBT and from a minority ethnic background may often feel apart from, rather than a part of, both their LGBT and ethnic communities which can lead to feelings of isolation, low esteem as well as confusion over identity. Some individuals can also be in a position where they feel that they do not belong to either the LGBT community or their minority ethnic community and are forced to express one part of their identity at the expense of the other. More insight is required about the ways in which intersections between ethnicity and gender identities impact non-binary people in Scotland.
The Scottish Trans[19] study highlighted another important intersectional aspect of their respondents’ identities. The majority of participants (67%) in the study considered themselves to be disabled or to have a long-term health condition. Physical health issues were mentioned by 39% of the respondents. Neurodivergence and mental health issues were mentioned by 8% and 17% respectively. Janssen et al[20], also found that autistic people have an increased gender variance rate, of over seven times that of the general population, meaning they are more likely to identify as trans, including non-binary. The most recent report from LGBT Youth Scotland highlighted that one in five neurodivergent participants of the survey have left university, college, or school due to homophobia, biphobia or transphobia[21]. More research about the relationship between neurodivergence and non-binary gender identity is required, particularly around discrimination and to understand more about the ways in which services specifically designed to support mental health and neurodivergence, do so in an intersectional way.
This evidence provides some insight into intersecting equalities characteristics for non-binary people in Scotland, however the data presented is not representative of the population. It is useful to know about intersecting characteristics as it can give a depth of understanding about non-binary people’s experiences.
Contact
There is a problem
Thanks for your feedback