Atlantic salmon from large Scottish east coast rivers - genetic stock identification: report
A report which investigates the potential to sample the genetic constitution of Atlantic salmon to work out which rivers they came from and whether it was possible to distinguish fish from among the large east coast rivers of Scotland.
Methods
Sample collection
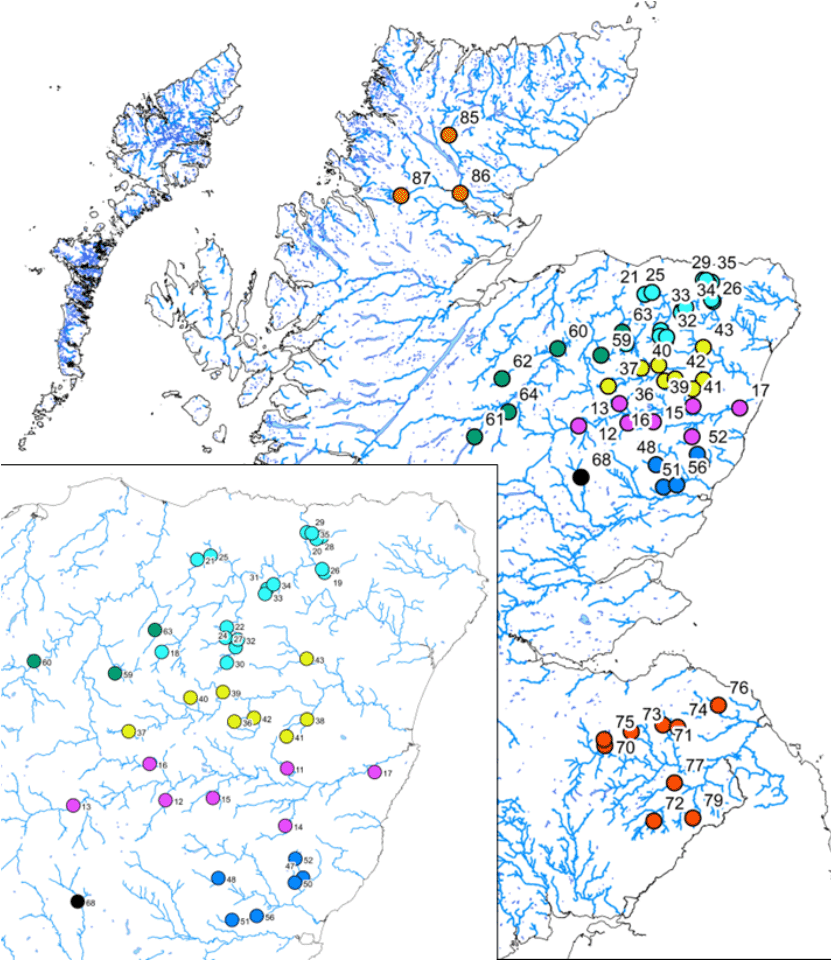
Under the National Electrofishing Programme for Scotland (NEPS) programme, genetic data were derived from 1,040 juvenile salmon electrofished in 2018 and 2019 from 52 point locations covering six rivers along the NE coast of Scotland (Spey - SAC, Deveron, Don, Dee - SAC, North Esk and Tweed - SAC), as well as a single site from the River Tay (SAC) and three sites from the Oykel/Cassley/Shin river system (SAC) (Fig. 1); the latter being considered the genetic outgroup. A tail fin clip was taken from anaesthetized fish, the fish released alive and the clips were stored in 99% ethanol.
Samples were combined at geographically close sites which had low numbers of samples. This resulted in a final sample size of 1040 fish, screened at 40 sites.

Genetic analysis
Microsatellites with a scoring percentage below 50% were removed from further analysis. Similarly, individuals with a scoring percentage below 50% post loci-removal were also removed. Lastly, full sibs in samples were identified by COLONY2 (Jones & Wang, 2010) using the pedigree likelihood approach, assuming biparental polygamy and no inbreeding. Only a single member from each full sib family identified was retained in order to avoid inflating genetic differences among samples through family effects (Hansen et al., 1997).
Genalex (Peakall and Smouse, 2006) was used to calculate the various diversity and differentiation parameters, such as site-specific observed (Ho) and expected (He) heterozygosity, and pairwise estimates of FST and DA (Nei et al., 1983). Hardy–Weinberg (HW) proportions and Linkage Disequilibrium (LD) were tested using the GENEPOP package (Rousset, 2008) in R (R Core Team, 2015) and a False Discovery Rate (FDR) correction (Benjamini & Hochberg, 1995) applied for multiple tests. The same package was also used to test for significance of the pairwise FST values. Allelic richness (Ar) was determined with HP-RARE (Kalinowski, 2005), standardized to a sample size of 20.
Population relatedness was assessed with STRUCTURE 2.3.4 (Pritchard et al., 2000, 2004) using the admixture model assuming correlated allele frequencies (Falush et al., 2003). STRUCTURE was run with a burn-in and run phase of 100,000 and 300,000 iterations, respectively, for five replicates for each number of clusters (K) and increasing K values until LnP(K) plateaued. The log-likelihood probability (Ln(K)) and ΔK (Evanno et al., 2005) were calculated with STRUCTURE HARVESTER (Earl & vonHoldt, 2011) to identify the smallest K that captured the main structure in the data (Pritchard et al., 2000, 2004). Individual membership coefficients were combined across replicates with CLUMPP1.1.2 (Jakobsson & Rosenberg, 2007), employing the FullSearch method with random order input (1,000 repeats) and results were visualised in DISTRUCT1.1 (Rosenberg, 2004).
Assignment analysis
All fish present in the dataset after Quality Control (QC) formed the baseline to which the assignment analysis was carried out. It was performed using the R package Rubias (Anderson, 2017) and followed the self-assignment model using a leave-one-out approach. In this approach, a single fish was taken out of the baseline at random and assigned back to it. The most likely river of origin was estimated with an associated probability. This procedure was repeated until all fish had been assigned. Assignment accuracy (i.e. how many fish assigned to a particular river/assignment unit actually originated from that river/assignment unit) was calculated.
When performing the self-assignments, a probability threshold of 0.8 was used. Thus, only fish with assignments with probabilities at or above this level were included in the analysis. Using this threshold removed fish for which it was difficult to robustly estimate river of origin, which has previously been shown to significantly increase assignment accuracy (Gilbey, et al., 2016a).
Successful assignment accuracy to individual rivers or larger assignment units was defined as at or above 80% accuracy. That is, 80% or more of the fish assigned to a river or assignment unit were actually from this unit. If this condition was met for a particular river, then this river was considered to be a single assignment unit. In cases where this condition was not met, the pattern of misassignments was examined and neighbouring rivers were combined into a larger assignment unit, based on geography. The assignment analysis, as described above, was repeated, examining the results at the newly defined assignment levels. Results were assessed against the accuracy threshold and, if needed, further geographic regions were combined. This procedure was repeated until each assignment unit fulfilled the condition of at least 80% assignment accuracy to all assignment units.
Contact
Email: ScotMER@gov.scot
There is a problem
Thanks for your feedback