Publication - Statistics
Government Expenditure and Revenue Scotland (GERS) 2023-24
Government Expenditure and Revenue Scotland (GERS) is an Accredited Official Statistics publication. It estimates the revenue raised in Scotland and the cost of public services provided for Scotland.
Summary
Introduction
- Government Expenditure and Revenue Scotland (GERS) addresses three questions about Scotland’s public sector finances under the current constitutional arrangements:
- What revenues were raised in Scotland?
- How much was spent on public services for Scotland?
- To what extent did revenues cover the costs of these public services?
- GERS is not a measure of the Scottish Government’s fiscal position, rather it is a measure of Scotland’s overall fiscal position. Further information on Scottish Government and devolved finances is provided in the FAQs and Preface.
- GERS is an Accredited Official Statistics publication. It is assessed by the Office for Statistics Regulation (OSR), the regulatory arm of the UK Statistics Authority, to ensure that it meets the standards set out in the Code of Practice for Statistics.
- The tables below provide figures for the last three years. Figures for back to 1998-99 are available online in the accompanying spreadsheets.
- Feedback from users of the publication is welcome. Comments can be emailed to economic.statistics@gov.scot.
Scotland’s Overall Fiscal Position
- GERS provides two measures of Scotland’s fiscal position, the net fiscal balance and the current budget balance.
- The net fiscal balance measures the difference between total public sector expenditure and public sector revenue. It therefore includes public sector capital investment, such as the construction of roads, hospitals, and schools, which yields benefits not just to current taxpayers but also to future taxpayers. It is shown in Table S.1 below.
- The results for this year’s publication reflect a stabilisation of the underlying public finances in Scotland and the UK, as shocks to the economy have lessened. They also reflect recent policy changes, with the introduction of Electricity Generator Levy, freezes to Scottish Income Tax thresholds, and increases to the Higher and Top Rates of Scottish Income Tax. Falling energy prices mean that revenue from the North Sea has fallen back from the peak seen in 2022-23.
- On the spending side, falling energy prices also meant inflation fell from the highs recorded during 2022-23, and as a result spending on reserved debt interest payments, partly linked to inflation, fell back slightly, although it remains significantly higher than pre-pandemic.
| £ million | |||
|---|---|---|---|
| 2021-22 | 2022-23 | 2023-24 | |
| Scotland | -23,861 | -18,029 | -22,684 |
| Scotland - Excluding North Sea | -26,275 | -25,971 | -26,642 |
| As % of GDP | |||
| Scotland | -12.3% | -8.4% | -10.4% |
| Scotland - Excluding North Sea | -15.1% | -13.6% | -13.2% |
| UK | -5.4% | -5.0% | -4.5% |
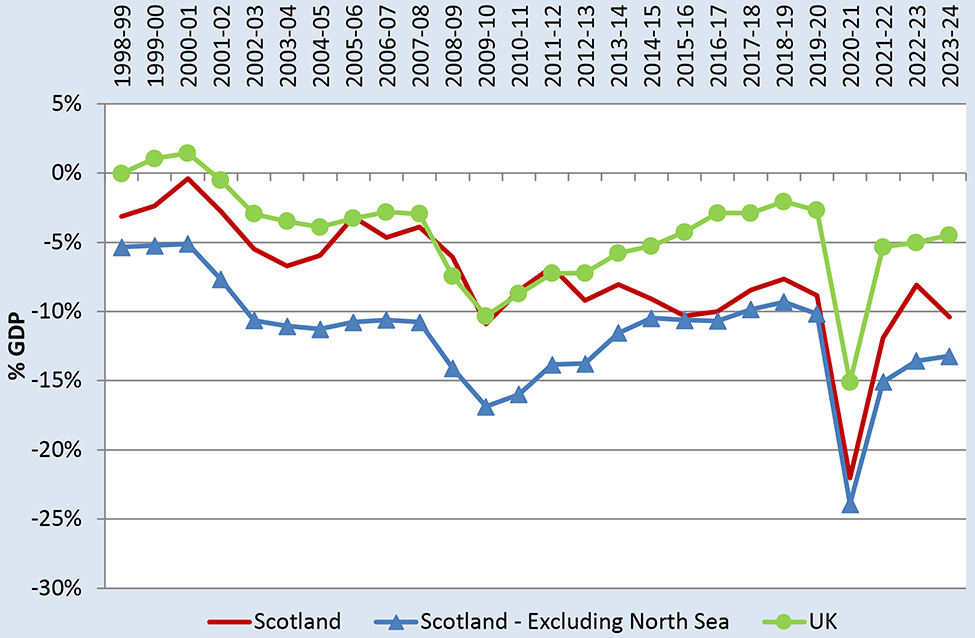
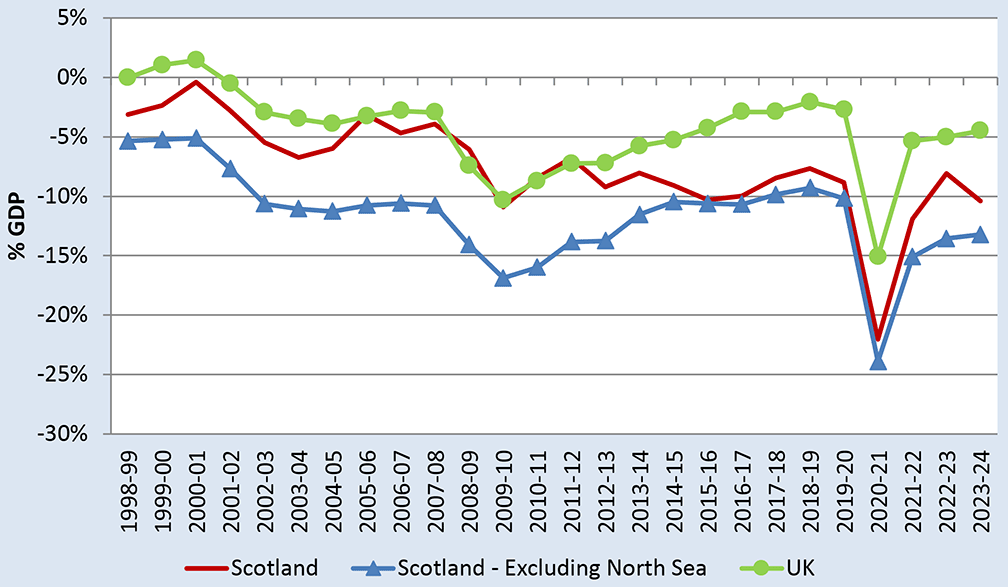
- In 2023-24, Scotland’s net fiscal balance as a share of GDP was -10.4%, compared to -8.4% in 2022-23. This is a deterioration of 2.0 percentage points for Scotland, whilst the UK deficit improved by 0.5 percentage points.
- This difference is primarily explained by North Sea revenue. Scottish North Sea revenue fell by £4.0 billion in 2023-24 to £4.0 billion. Excluding North Sea revenue, the net fiscal balance for Scotland improved by 0.3 percentage points. This reflects strong growth in receipts, discussed below.
- The current budget balance shows the difference between revenue and current expenditure only. It therefore excludes public sector capital investment. It measures the degree to which taxpayers meet the cost of paying for public services, excluding capital investment. It is shown in Table S.2 below.
- The current budget balance for Scotland tends to move in line with the net fiscal balance figure but is typically around 2 to 3 percentage points smaller as a share of GDP. In 2023-24, the deficit on the Scottish current budget balance decreased by 1.9 percentage points.
| £ million | ||||
|---|---|---|---|---|
| 2021-22 | 2022-23 | 2023-4 | ||
| Scotland | -18,364 | -13,457 | -17,193 | |
| Scotland - Excluding North Sea | -20,778 | -21,399 | -21,151 | |
| As % of GDP | ||||
| Scotland | -9.5% | -6.3% | -7.9% | |
| Scotland - Excluding North Sea | -11.9% | -11.2% | -10.5% | |
| UK | -3.1% | -3.2% | -1.9% | |
Scotland’s revenue
- Table S.3 shows two measures of Scotland’s public sector revenue: (i) all Scottish revenue, and (ii) excluding North Sea revenue.
- Scotland’s revenue in 2023-24 grew by £1.7 billion to £88.5 billion. This was an increase of 1.9% from 2022-23. This reflects growth in onshore receipts being partially offset by falling oil and gas revenue. Scottish revenue was 8.1% of the UK total, similar to its population share.
- Scotland’s share of UK non-North Sea revenue was 7.8% in 2023-24, slightly higher than in 2022-23. Onshore revenue grew by 7.2%, with in particular strong growth in income tax and corporation tax, which grew by 12% and 29% respectively. The growth in income tax reflects a range of factors, including relatively strong earnings growth in Scotland during 2023-24, freezes to thresholds for Scottish Income Tax, and increases in the Higher and Top Rates of Scottish Income Tax. Onshore corporation tax revenue was supported by the introduction of the Electricity Generator Levy, a charge on exceptional receipts from producing wholesale electricity, which contributed £238 million in 2023-24. As a share of GDP, non-North Sea revenue rose to 42.0%, its highest level recorded in GERS.
| £ million | |||
|---|---|---|---|
| 2021-22 | 2022-23 | 2023-4 | |
| Scotland | 73,050 | 86,878 | 88,546 |
| Scotland - Excluding North Sea | 70,636 | 78,936 | 84,588 |
| As % of UK total revenue | |||
| Scotland | 7.9% | 8.4% | 8.1% |
| Scotland - Excluding North Sea | 7.7% | 7.7% | 7.8% |
| As % of GDP | |||
| Scotland | 37.7% | 40.5% | 40.6% |
| Scotland - Excluding North Sea | 40.6% | 41.2% | 42.0% |
| UK | 39.0% | 40.3% | 40.2% |
- Table S.4 below shows estimates of revenue per person for Scotland and the UK. In the latest year, revenue per person was £60 higher than the UK average. The difference between revenue per person in Scotland and the UK is variable and depends largely on North Sea revenue. In 2021-22, when North Sea revenue was lower, revenue per person was £361 lower than the UK average.
- Excluding North Sea revenue, revenue per person in Scotland was lower than the UK average by £594 in 2023-24.
| £ per person | |||
|---|---|---|---|
| 2021-22 | 2022-23 | 2023-24 | |
| Scotland | |||
| Including North Sea revenue | 13,350 | 15,948 | 16,254 |
| Excluding North Sea revenue | 12,909 | 14,490 | 15,527 |
| UK | |||
| Including North Sea revenue | 13,711 | 15,227 | 16,194 |
| Excluding North Sea revenue | 13,671 | 15,080 | 16,121 |
| Difference (Scotland minus UK) | |||
| Including North Sea revenue | -361 | 721 | 60 |
| Excluding North Sea revenue | -762 | -590 | -594 |
Scotland’s spending
- Table S.5 below shows estimates of public spending for Scotland. Expenditure increased to £111.2 billion in 2023-24, from £104.9 billion in 2022-23. As a share of GDP, public spending remained at historically high levels in 2023-24, at 51% of GDP, around 5 percentage points higher than prior to the pandemic.
- Overall, spending in 2023-24 grew broadly in line with the onshore economy. In both 2022-23 and 2023-24, spending as a share of onshore GDP was around 55%.
- Within overall spending, 2023-24 saw particularly strong growth in health and social protection spending. In contrast, spending on reserved public sector debt interest, some of which is linked to inflation, fell by around 10%, as inflation fell back from the highs seen during 2022-23.
| 2021-22 | 2022-23 | 2023-4 | |
|---|---|---|---|
| Scotland - £ millions | 96,911 | 104,907 | 111,230 |
| Share of UK (%) | 9.3% | 9.1% | 9.1% |
| As % of GDP | |||
| Scotland | 50.1% | 48.9% | 51.0% |
| Scotland - Excluding North Sea | 55.7% | 54.8% | 55.3% |
| UK | 44.3% | 45.3% | 44.7% |
- Table S.6 below shows estimates of expenditure per person for Scotland and the UK. Expenditure for Scotland has been consistently higher per person than the UK average over the period.
| £ per person | |||
|---|---|---|---|
| 2021-22 | 2022-23 | 2023-24 | |
| Scotland | 17,711 | 19,257 | 20,418 |
| UK | 15,591 | 17,121 | 18,001 |
| Difference (Scotland minus UK) | 2,120 | 2,136 | 2,417 |
Contact
Email: economic.statistics@gov.scot
There is a problem
Thanks for your feedback