Government Expenditure and Revenue Scotland (GERS) 2023-24
Government Expenditure and Revenue Scotland (GERS) is an Accredited Official Statistics publication. It estimates the revenue raised in Scotland and the cost of public services provided for Scotland.
Chapter 2: North Sea Revenue
Introduction
In GERS, the term North Sea is used to refer to all offshore oil and gas activity. North Sea revenue in GERS comes from four sources: petroleum revenue tax, corporation tax, licence fees, and the energy profits levy.
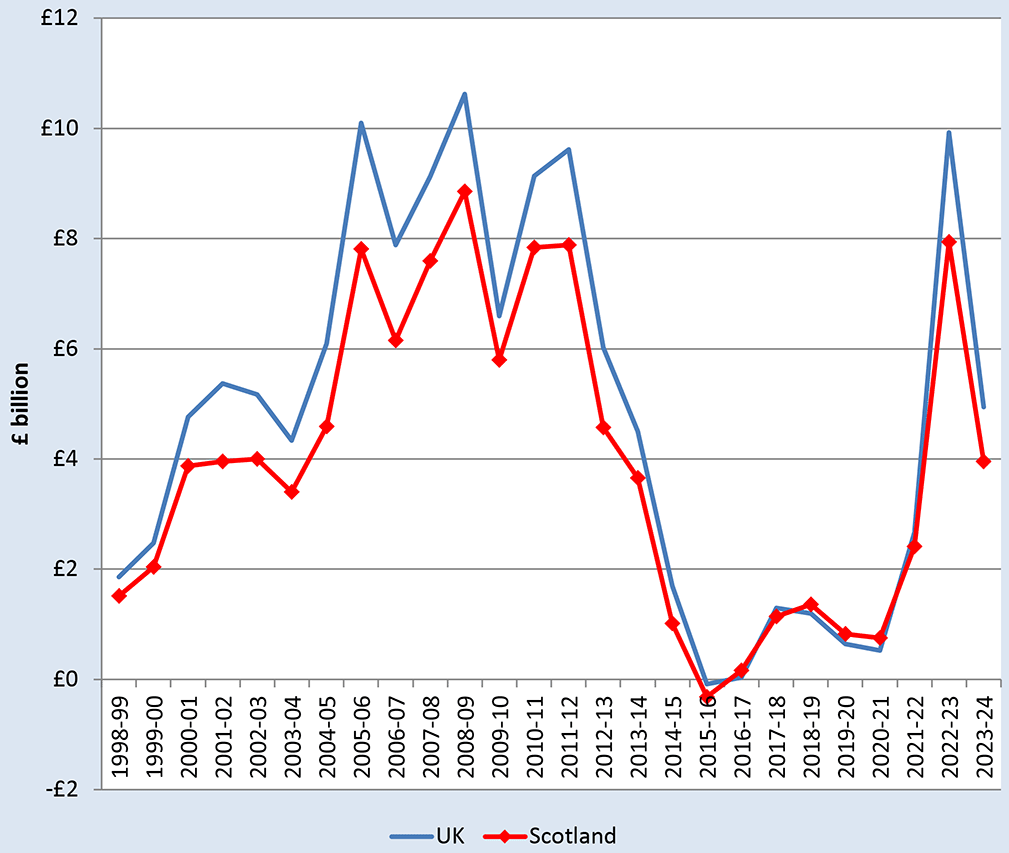
Table 2.1 shows the revenue raised from each component of North Sea revenue since 2021-22. Having been £2.7 billion in 2021-22, UK North Sea revenue increased in 2022-23, to near record highs, but has fallen back in 2023-24 to stand at £4.9 billion. This reflects the path of oil and gas prices over recent years.
| £ million | |||
|---|---|---|---|
| 2021-22 | 2022-23 | 2023-24 | |
| Licence fees | 72 | 69 | 48 |
| North Sea corporation tax | 3,142 | 5,834 | 2,731 |
| Petroleum revenue tax | -552 | -234 | -427 |
| Energy profits levy | 0 | 4,259 | 2,588 |
| Total | 2,662 | 9,928 | 4,940 |
North Sea revenue is subject to annual fluctuations and is driven by a number of factors, including the oil price, the sterling dollar exchange rate, production, operating expenditure, capital investment, and the prevailing fiscal regime.
Oil prices were broadly stable across 2023-24 as a whole and although gas prices continued to fall they remained higher than pre-pandemic levels. The oil price was $85 per barrel in April 2023 and in March 2024, although it fluctuated across the year. Gas prices began the year at 89p per therm and ended at 68p.[16] [17]
Overall North Sea production of oil and gas fell by 10% in 2023 to 70 million tons of oil equivalent.[18] The decline was similar across both oil and gas.
In 2023 total expenditure on the UK Continental Shelf increased by 7% in real terms compared to 2022, to stand at £15.4 billion. The increase was primarily due to an increase in capital expenditure and decommissioning, which increased by 20% an 23% respectively in real terms. Operating costs remained relatively stable in real terms but exploration and appraisal expenditure fell by 34%, although this is a relatively small part of overall expenditure.[19]
The UK fiscal regime in 2023-24 consisted of offshore ring fence corporation tax (RFCT) at 30%, petroleum revenue tax (PRT) at 0% and a supplementary charge (SC) of 10%, and the energy profits levy at 35%.[20] The combined rate of tax on profits is 75%.
As shown in Table 2.1, PRT receipts are negative. This reflects the fact that, although companies no longer pay PRT, they can still claim refunds on PRT paid in previous years against current trading losses and decommissioning spending. As a result, PRT receipts will only be negative in the future under the current tax regime.[21]
Scotland’s Share of North Sea Revenue
In the ONS’s Regional Accounts, the UK continental shelf is not allocated to specific geographic regions, but is considered a separate region of the UK (the extra-regio territory). As such, an assumption as to Scotland’s share of the North Sea needs to be made in GERS.
Two estimates of Scotland’s share of North Sea revenue are shown in GERS:
- An illustrative geographical share
- A population share
These are discussed below.
An Illustrative Geographical Share
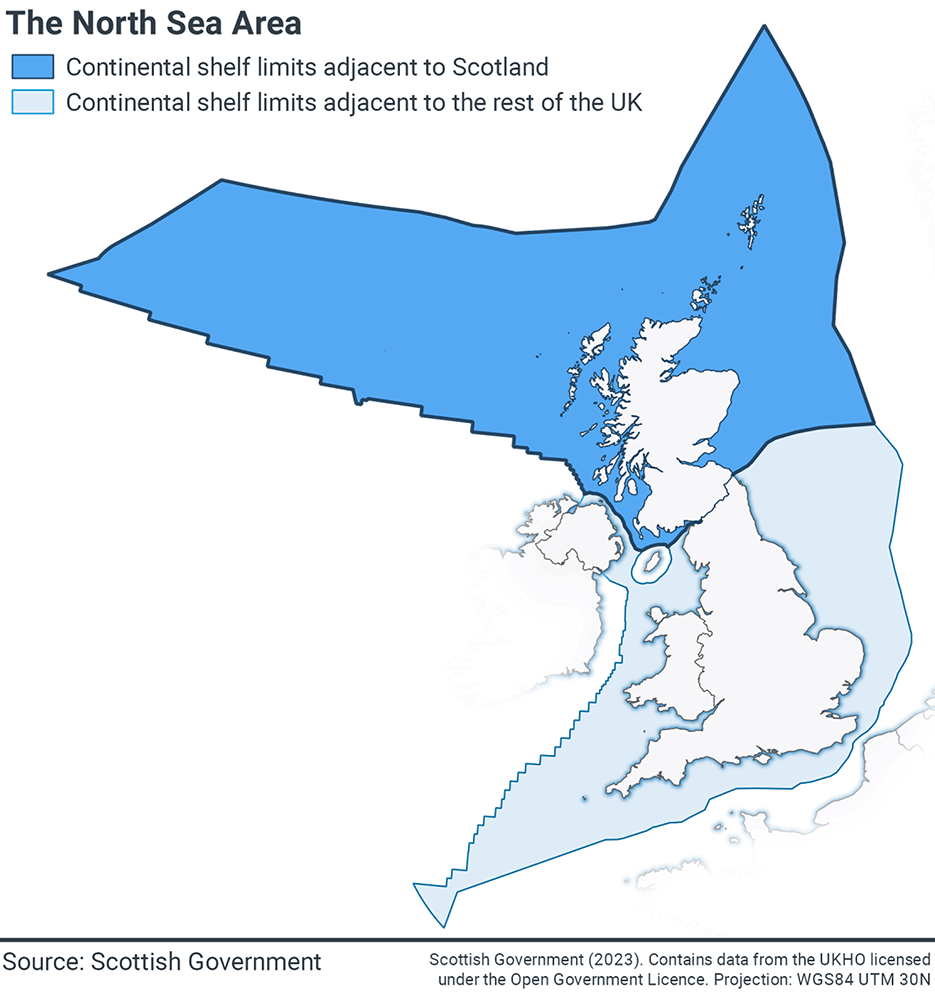
The most common approach to estimating North Sea revenue is to apportion a share of North Sea revenue to Scotland on the geographical location of oil and gas fields. In order to estimate this share, GERS uses the share reported in the ONS Country and Regional Public Sector Finances publication. The estimate is based on the median line principle as employed in 1999 to determine the boundary between Scotland and the rest of the UK for fishery demarcation purposes. Other alternatives are possible. Production, costs and revenue are allocated on a field-by-field basis to either the rest of the UK or Scotland using this boundary.
Table 2.2 shows Scotland’s illustrative geographical share of UK North Sea revenue, broken down by licence fees, corporation tax, petroleum revenue tax, and the energy profits levy. Scotland’s share of UK revenue fell in 2022-23, likely reflecting the increased profitability of gas fields relative to oil fields.
| £ million | |||
|---|---|---|---|
| 2021-22 | 2022-23 | 2023-24 | |
| UK revenue | 2,662 | 9,928 | 4,940 |
| Licence fees | 72 | 69 | 48 |
| North Sea corporation tax | 3,142 | 5,834 | 2,731 |
| Petroleum revenue tax | -552 | -234 | -427 |
| Energy Profits Levy | - | 4,259 | 2,588 |
| Scottish geographical revenue | 2,414 | 7,942 | 3,958 |
| Licence fees | 63 | 55 | 38 |
| North Sea corporation tax | 2,672 | 4,659 | 2,185 |
| Petroleum revenue tax | -321 | -184 | -336 |
| Energy Profits Levy | - | 3,412 | 2,071 |
| Scottish share of UK | 90.7% | 80.0% | 80.1% |
| Licence fees | 88.0% | 80.0% | 80.0% |
| North Sea corporation tax | 85.0% | 79.9% | 80.0% |
| Petroleum revenue tax | 58.2% | 78.8% | 78.8% |
| Energy Profits Levy | - | 80.1% | 80.0% |
Scotland’s estimated geographical share of the North Sea sector, used in this report, is highlighted in the figure below.
UK Continental Shelf and Scottish Boundary
Population Share
An alternative approach to North Sea revenue is to view it as a non-identifiable UK revenue, in which case a population share may be apportioned to Scotland. Table 2.3 provides an estimate of Scotland’s share of North Sea revenue under this approach.
| £ million | |||
|---|---|---|---|
| 2021-22 | 2022-23 | 2023-24 | |
| Total North Sea revenue | 2,662 | 9,928 | 4,940 |
| Scotland’s population share | 217 | 799 | 398 |
| Scotland’s share of North Sea revenue (%) | 8.1% | 8.1% | 8.1% |
Contact
Email: economic.statistics@gov.scot
There is a problem
Thanks for your feedback