Gypsy/Traveller Sites in Scotland
The report presents findings from a study collating data on Gypsy/Traveller sites in Scotland.
3 Public Gypsy/Traveller sites in Scotland
3.1 This section provides an overview of current public sites for Gypsy/Travellers provided by Councils and Registered Social Landlords (RSLs) across Scotland. Findings are based on data returns from local authorities and RSLs, and include comparison with previous data collection exercises where relevant. These include a data collection exercise by the Scottish Housing Regulator in early 2018[4], the 2011 Census, and reports of the Twice-Yearly Count of Gypsy/Travellers up to July 2009 (the last Count).[5]
Overview of provision
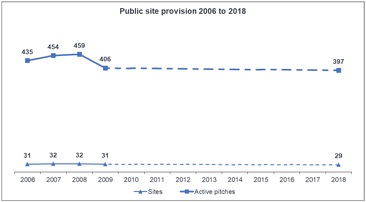
3.2 Data returns identify a total of 29 public Gypsy/Traveller sites across Scotland. This represents a small reduction in site provision since 2009, where 31 active sites were recorded.
3.3 A total of 397 active pitches are provided across the 29 sites. This equates to
an average of 13.7 pitches per site, although public sites vary considerably in size from 4 to 21 pitches.
3.4 The current supply of active pitches represents a reduction in public site provision of 62 pitches over the last ten years (a fall of -14% since 2008), although the supply of active pitches is largely unchanged since the 2009 Count. This change reflects a mix of changes in Gypsy/Traveller provision at a local authority level.
Figure 1: Public Gypsy/Traveller site provision 2006 to 2018

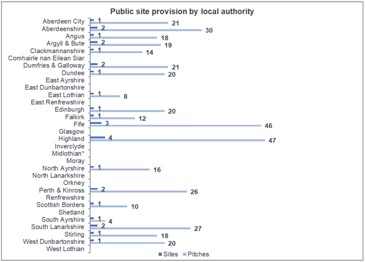
3.5 A total of 20 local authorities/RSLs provide one or more public Gypsy/Traveller sites; the remaining 12 local authority areas do not have any public Gypsy/Traveller site provision.[6] Fife, Highland and Aberdeenshire report the largest public site provision, together accounting for nearly a third (31%) of all public site pitches across Scotland.
3.6 Data returns indicate a small number of changes in public site provision since the Scottish Housing Regulator (SHR) report in March 2018, although the overall number of sites remains at 29. The main changes of note are:
- Aberdeenshire. An additional transit site at Aikey Brae has become operational since the SHR report, providing 10 pitches let on a temporary basis.
- Argyll & Bute. One public site at Torlochan is currently closed.
- North Ayrshire. The public site at Houdston has been out of operation since sustaining significant storm damage in 2015, with displaced residents having been accommodated on a temporary site. Work is currently ongoing to convert the temporary site to permanent provision.
3.7 The reduction in public site pitches since the 2008 Twice Yearly Count (a net loss of 62 pitches) also reflects several longer-term changes in provision. The most notable has been a reduction in supply across North Lanarkshire (of -20 pitches), West Lothian (-15), East Dunbartonshire (-15), East Lothian (-12), Argyll & Bute (-11) and Glasgow (-9 pitches).
Figure 2: Overview of public Gypsy/Traveller site provision

Figure 3: Overview of public Gypsy/Traveller site provision
| Number of |
Total active pitches |
Avg pitches per site |
|
|---|---|---|---|
| SCOTLAND |
29 |
397 |
13.7 |
| Aberdeen City |
1 |
21 |
21.0 |
| Aberdeenshire |
2 |
30 |
15.0 |
| Angus |
1 |
18 |
18.0 |
| Argyll & Bute |
2 |
19 |
9.5 |
| Clackmannanshire |
1 |
14 |
14.0 |
| Comhairle nan Eilean Siar |
0 |
0 |
0 |
| Dumfries & Galloway |
2 |
21 |
10.5 |
| Dundee |
1 |
20 |
20.0 |
| East Ayrshire |
0 |
0 |
0 |
| East Dunbartonshire |
0 |
0 |
0 |
| East Lothian |
1 |
8 |
8.0 |
| East Renfrewshire |
0 |
0 |
0 |
| Edinburgh |
1 |
20 |
20.0 |
| Falkirk |
1 |
12 |
12.0 |
| Fife |
3 |
46 |
15.3 |
| Glasgow |
0 |
0 |
0 |
| Highland |
4 |
47 |
11.8 |
| Inverclyde |
0 |
0 |
0 |
| Midlothian* |
0* |
0* |
0* |
| Moray |
0 |
0 |
0 |
| North Ayrshire |
1 |
16 |
16.0 |
| North Lanarkshire |
0 |
0 |
0 |
| Orkney |
0 |
0 |
0 |
| Perth & Kinross |
2 |
26 |
13.0 |
| Renfrewshire |
0 |
0 |
0 |
| Scottish Borders |
1 |
10 |
10.0 |
| Shetland |
0 |
0 |
0 |
| South Ayrshire |
1 |
4 |
4.0 |
| South Lanarkshire |
2 |
27 |
13.5 |
| Stirling |
1 |
18 |
18.0 |
| West Dunbartonshire |
1 |
20 |
20.0 |
| West Lothian |
0 |
0 |
0 |
* The public site in East Lothian is a shared service with Midlothian Council.
3.8 Map 1 over the page shows the 29 currently active public Gypsy/Traveller sites in Scotland.
Permanent and temporary pitch provision
3.9 Permanent pitches account for a large majority of current provision; 373 are currently let or are available to let, which is equivalent to 88% of all pitches (and 94% of active pitches). A total of 24 pitches are occupied or available for temporary use across Aberdeen City, Aberdeenshire and Scottish Borders, equivalent to 6% of all pitches across Scotland. However, several other landlords noted that public site pitches can be made available for temporary occupancy where required. A total of 29 pitches are currently out of use for repair, refurbishment or other uses, equivalent to 7% of all public site pitches.
Figure 4: Public site permanent, temporary and inactive pitches
| Total pitches |
Active pitches |
Pitches out of use |
||
|---|---|---|---|---|
| Permanent |
Temporary |
|||
| SCOTLAND |
426 |
373 (88%) |
24 (6%) |
29 (7%) |
| Aberdeen City |
21 |
17 |
4 |
0 |
| Aberdeenshire |
30 |
20 |
10 |
0 |
| Angus |
18 |
18 |
0 |
0 |
| Argyll & Bute |
22 |
19 |
0 |
3 |
| Clackmannanshire |
16 |
14 |
0 |
2 |
| Comhairle nan Eilean Siar |
0 |
0 |
0 |
0 |
| Dumfries & Galloway |
29 |
21 |
0 |
8 |
| Dundee |
21 |
20 |
0 |
1 |
| East Ayrshire |
0 |
0 |
0 |
0 |
| East Dunbartonshire |
0 |
0 |
0 |
0 |
| East Lothian |
12 |
8 |
0 |
4 |
| East Renfrewshire |
0 |
0 |
0 |
0 |
| Edinburgh |
20 |
20 |
0 |
0 |
| Falkirk |
15 |
12 |
0 |
3 |
| Fife |
50 |
46 |
0 |
4 |
| Glasgow |
0 |
0 |
0 |
0 |
| Highland |
47 |
47 |
0 |
0 |
| Inverclyde |
0 |
0 |
0 |
0 |
| Midlothian* |
0* |
0 |
0 |
0 |
| Moray |
0 |
0 |
0 |
0 |
| North Ayrshire |
16 |
16 |
0 |
0 |
| North Lanarkshire |
0 |
0 |
0 |
0 |
| Orkney |
0 |
0 |
0 |
0 |
| Perth & Kinross |
26 |
26 |
0 |
0 |
| Renfrewshire |
0 |
0 |
0 |
0 |
| Scottish Borders |
10 |
0 |
10 |
0 |
| Shetland |
0 |
0 |
0 |
0 |
| South Ayrshire |
8 |
4 |
0 |
4 |
| South Lanarkshire |
27 |
27 |
0 |
0 |
| Stirling |
18 |
18 |
0 |
0 |
| West Dunbartonshire |
20 |
20 |
0 |
0 |
| West Lothian |
0 |
0 |
0 |
0 |
* The public site in East Lothian is a shared service with Midlothian Council.
Site occupancy
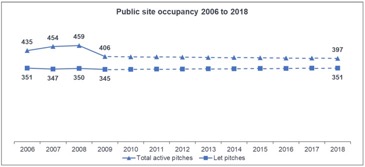
3.10 Landlords report a total of 351 pitches as currently let. This compares to 259 Gypsy/ Traveller households identified by the 2011 Census as living in caravan or mobile accommodation, suggesting the 2011 Census may have under-counted Gypsy/Travellers living on public sites. Occupied pitches do not necessarily equate to households, with historical data from the Twice-Yearly Count indicating numbers of Gypsy/Traveller households on public sites equates to between 0.8 and 0.9 per occupied pitch. This suggests that the 2011 Census may have under-counted households on public Gypsy/Traveller sites by between 20 and 60 households (8-18% of the total).
3.11 The 351 let pitches is equivalent to an average occupancy rate of 88%. Levels of site occupancy vary significantly across local authority areas; 16 of the 29 sites report 100% occupancy, while 5 sites report occupancy of less than 70% (and 2 sites of less than 50% occupancy). Sites with lower occupancy include those across Aberdeenshire, Dundee, East/Midlothian and Fife.
3.12 Public site occupancy levels also appear to have increased over time. The 88% occupancy is slightly higher than that reported in the last Twice-Yearly Count (85% at 2009) and compares to occupancy rates of 75-80% between 2006 and 2008.
Figure 5: Public site occupancy 2006 to 2018

Figure 6: Public site pitch occupancy
| Total active pitches |
Let pitches |
Occupancy |
|
|---|---|---|---|
| SCOTLAND |
397 |
351 |
88% |
| Aberdeen City |
21 |
21 |
100% |
| Aberdeenshire |
30 |
16 |
53% |
| Angus |
18 |
18 |
100% |
| Argyll & Bute |
19 |
18 |
95% |
| Clackmannanshire |
14 |
12 |
86% |
| Comhairle nan Eilean Siar |
0 |
0 |
0 |
| Dumfries & Galloway |
21 |
14 |
67% |
| Dundee |
20 |
13 |
65% |
| East Ayrshire |
0 |
0 |
0 |
| East Dunbartonshire |
0 |
0 |
0 |
| East Lothian |
8 |
5 |
63% |
| East Renfrewshire |
0 |
0 |
0 |
| Edinburgh |
20 |
18 |
90% |
| Falkirk |
12 |
11 |
92% |
| Fife |
46 |
40 |
87% |
| Glasgow |
0 |
0 |
0 |
| Highland |
47 |
47 |
100% |
| Inverclyde |
0 |
0 |
0 |
| Midlothian* |
0* |
0 |
0 |
| Moray |
0 |
0 |
0 |
| North Ayrshire |
16 |
16 |
100% |
| North Lanarkshire |
0 |
0 |
0 |
| Orkney |
0 |
0 |
0 |
| Perth & Kinross |
26 |
26 |
100% |
| Renfrewshire |
0 |
0 |
0 |
| Scottish Borders |
10 |
7 |
70% |
| Shetland |
0 |
0 |
0 |
| South Ayrshire |
4 |
4 |
100% |
| South Lanarkshire |
27 |
27 |
100% |
| Stirling |
18 |
18 |
100% |
| West Dunbartonshire |
20 |
20 |
100% |
| West Lothian |
0 |
0 |
0 |
* The public site in East Lothian is a shared service with Midlothian Council.
3.13 Data returns indicate that a large majority of public site tenants have occupied their pitches for six months or more; 83%, including 61% with tenancies of two years or more. A total of 60 tenancies started within the last 6 months, equivalent to 17% of all let pitches (and 15% of all active pitches).
Figure 7: Public site length of tenancy
| Total let pitches |
Length of tenancy |
|||
|---|---|---|---|---|
| 0-6 months |
6-24 months |
2+ years |
||
| SCOTLAND |
351 |
60 (17%) |
76 (22%) |
215 (61%) |
| Aberdeen City |
21 |
4 |
1 |
16 |
| Aberdeenshire |
16 |
16 |
0 |
0 |
| Angus |
18 |
0 |
1 |
17 |
| Argyll & Bute |
18 |
3 |
4 |
11 |
| Clackmannanshire |
12 |
0 |
2 |
10 |
| Comhairle nan Eilean Siar |
0 |
0 |
0 |
0 |
| Dumfries & Galloway |
14 |
4 |
2 |
8 |
| Dundee |
13 |
3 |
9 |
1 |
| East Ayrshire |
0 |
0 |
0 |
0 |
| East Dunbartonshire |
0 |
0 |
0 |
0 |
| East Lothian |
5 |
1 |
0 |
4 |
| East Renfrewshire |
0 |
0 |
0 |
0 |
| Edinburgh |
18 |
0 |
5 |
13 |
| Falkirk |
11 |
1 |
7 |
3 |
| Fife |
40 |
2 |
12 |
26 |
| Glasgow |
0 |
0 |
0 |
0 |
| Highland |
47 |
5 |
13 |
29 |
| Inverclyde |
0 |
0 |
0 |
0 |
| Midlothian* |
0* |
0 |
0 |
0 |
| Moray |
0 |
0 |
0 |
0 |
| North Ayrshire |
16 |
2 |
7 |
7 |
| North Lanarkshire |
0 |
0 |
0 |
0 |
| Orkney |
0 |
0 |
0 |
0 |
| Perth & Kinross |
26 |
2 |
2 |
22 |
| Renfrewshire |
0 |
0 |
0 |
0 |
| Scottish Borders |
7 |
7 |
0 |
0 |
| Shetland |
0 |
0 |
0 |
0 |
| South Ayrshire |
4 |
0 |
0 |
4 |
| South Lanarkshire |
27 |
2 |
2 |
23 |
| Stirling |
18 |
8 |
6 |
4 |
| West Dunbartonshire |
20 |
0 |
3 |
17 |
| West Lothian |
0 |
0 |
0 |
0 |
* The public site in East Lothian is a shared service with Midlothian Council.
Waiting list demand
3.14 Of the 19 landlords providing public Gypsy/Traveller sites, 12 reported having current waiting list applicants and/or had to turn away Gypsy/Travellers within the last year who were looking for site accommodation. A total of 90 households are currently registered on public site waiting lists, including 44 having joined a waiting list in the last year. A further 9 households had been unable to access a site pitch in the last year but did not join a waiting list.
3.15 This level of waiting list demand compares to a total of 88 public site pitches being let within the last year. This suggests it would be theoretically possible for most current waiting list demand to be occupied by public sites within a year. However there appears to be some mismatch between waiting list demand and supply of pitches. For example, several local authority areas with current waiting list demand report a very limited supply of pitches within the last year (most notably Angus, Edinburgh and South Lanarkshire). It should also be noted that anecdotal feedback from landlords indicates that the expression of waiting list demand can be influenced by a range of factors, including occupancy rates – for example, households may not approach landlords if they are aware that vacancies are unlikely to arise.
Figure 8: Public site waiting list demand (local authority areas with sites)
| Current waiting list |
Time on list |
Turned away in last year |
||
|---|---|---|---|---|
| Up to 12 months |
More than 12 months |
|||
| SCOTLAND |
90 |
44 |
46 |
9 |
| Aberdeen City |
7 |
7 |
0 |
2 |
| Aberdeenshire |
0 |
0 |
0 |
0 |
| Angus |
10 |
0 |
10 |
0 |
| Argyll & Bute |
3 |
2 |
1 |
0 |
| Clackmannanshire |
0 |
0 |
0 |
0 |
| Dumfries & Galloway |
6 |
6 |
0 |
2 |
| Dundee |
0 |
0 |
0 |
0 |
| East Lothian |
0 |
0 |
0 |
1 |
| Edinburgh |
7 |
7 |
0 |
0 |
| Falkirk |
0 |
0 |
0 |
0 |
| Fife |
16 |
5 |
11 |
0 |
| Highland |
0 |
0 |
0 |
0 |
| North Ayrshire |
7 |
4 |
3 |
1 |
| Perth & Kinross |
10 |
4 |
6 |
0 |
| Scottish Borders |
3 |
3 |
0 |
3 |
| South Ayrshire |
0 |
0 |
0 |
0 |
| South Lanarkshire |
19 |
5 |
14 |
0 |
| Stirling |
0 |
0 |
0 |
0 |
| West Dunbartonshire |
2 |
1 |
1 |
0 |
Contact
Email: Chief.Planner@gov.scot
There is a problem
Thanks for your feedback