Health and Care Experience Survey 2023/24: National Results
This report shows the results of the Health and Care Experience Survey 2023/24. The survey asked about peoples’ experiences of accessing and using their General Practice and other local healthcare services; receiving care, support and help with everyday living; and caring responsibilities.
Experience of General Practice
Contacting the General Practice
The survey asked participants when they had last contacted the General Practice named on the survey letter.
In 2023/24, 82% of respondents had contacted the named General Practice in the last twelve months. This is a higher percentage than in in the 2021/22 survey (77%), but slightly lower percentage than in 2019/20 (86%).
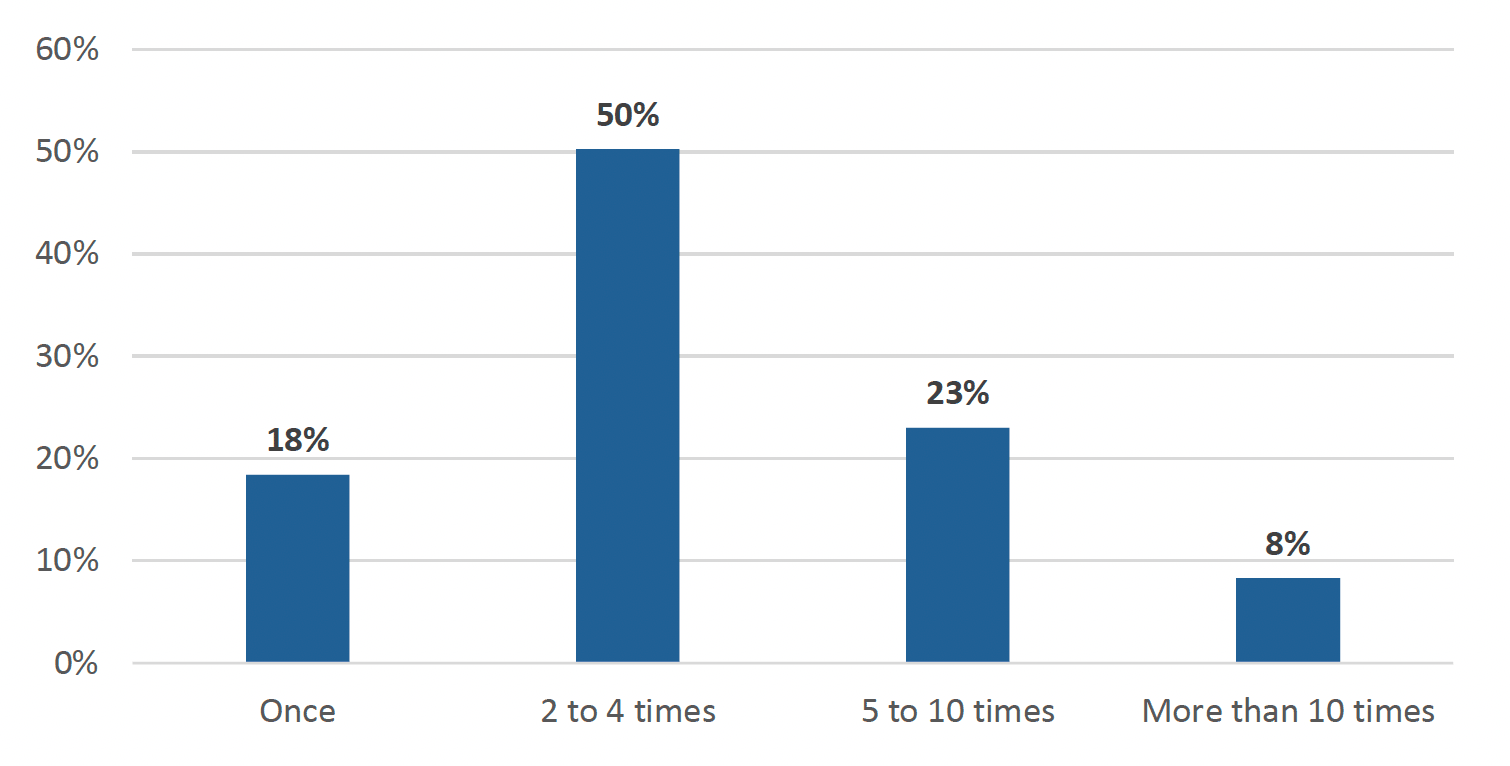
Of those who contacted their General Practice in the last twelve months, half contacted them between 2 and 4 times. These proportions were similar in 2019/20 and 2021/22.
Ease of contact
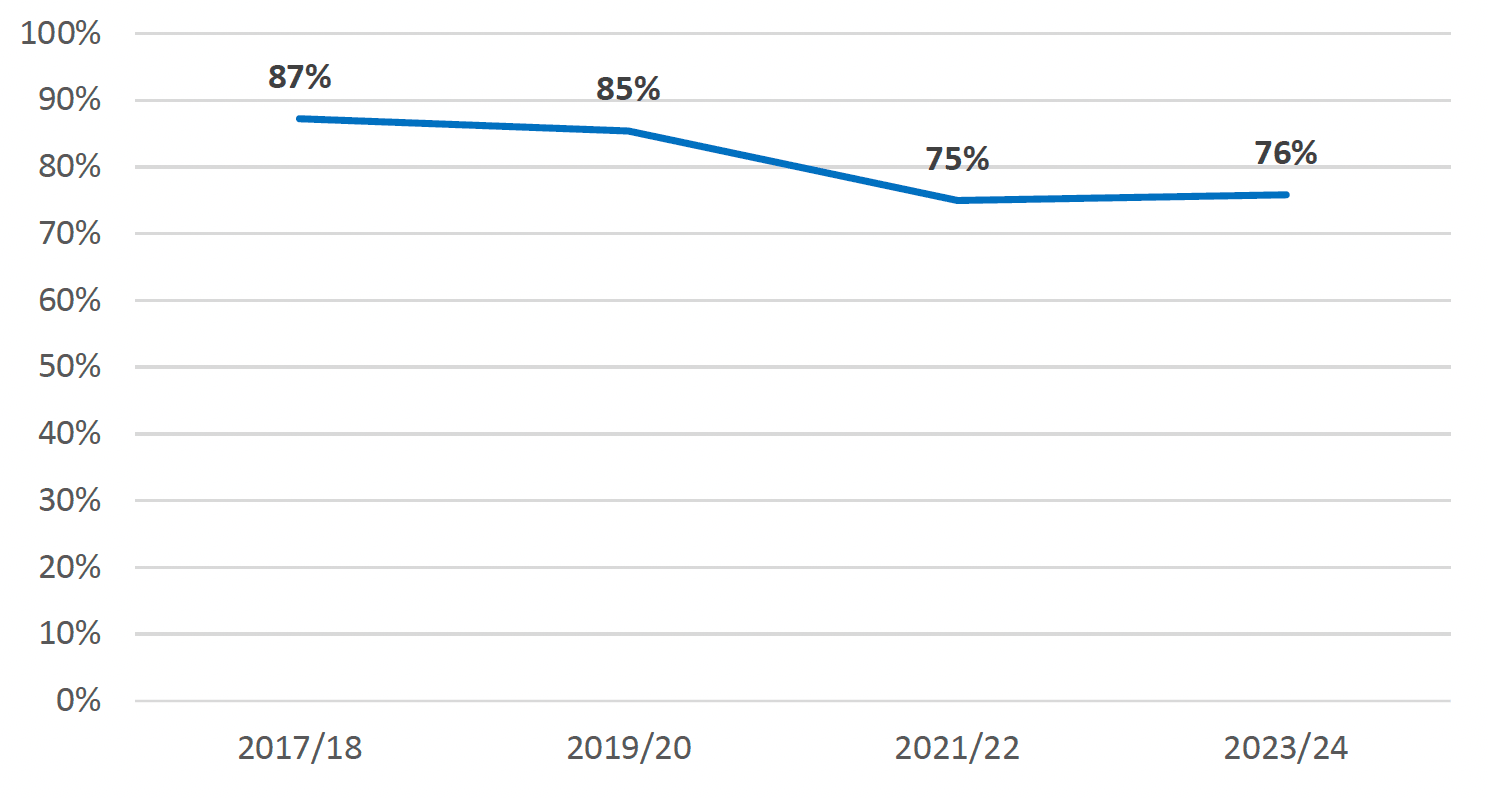
- 76% of people found contacting their General Practice in the way they wanted fairly or very easy. This is similar to 2021/22 (75%), but lower than in 2019/20 (85%).
The proportion of people finding it easy or very easy to contact their General Practice in the way they wanted has declined since 2017/18.
Experience of appointments
Advance booking
Half of respondents (50%) reported they are able to book appointments at their General Practice three or more working days in advance. This is similar to the 2021/22 survey (48%), but lower than in 2019/20 (64%).
Mode and choice of appointment
We asked what form the last appointment people got from their General Practice took. Of those who were offered an appointment:
- 62% received face-to-face appointments at the General Practice. This is a large increase from 2021/22 (37%), but it is lower than in 2019/20 (87%).
- 34% received phone call appointments. This is a decrease from 2021/22 (57%), but it is a higher proportion compared with 2019/20 (11%).
- Other types of appointments (3% in total) included home visits, videocalls, email or instant message consultations. This is lower than in 2021/22 (6%), but higher than in 2019/20 (2%).
The majority of appointments were face-to-face in 2023/24 and 2019/20, while most appointments were phone calls in 2021/22.
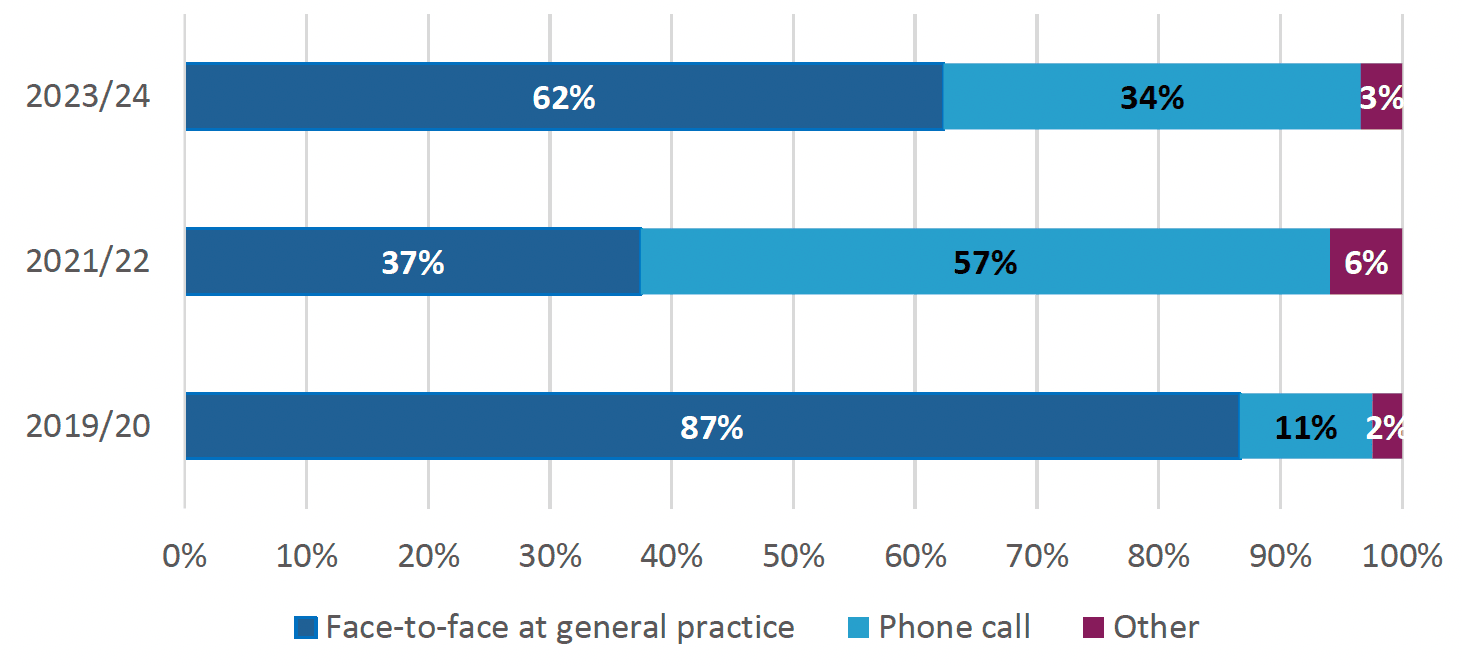
Note: ‘Other’ includes: home visits, videocalls, via email or instant message, and other ways.
Of the people offered an appointment:
- 81% were satisfied with the appointment and accepted it.
- 18% were not satisfied with the appointment but accepted it.
- 1% were not satisfied and did not take the appointment.
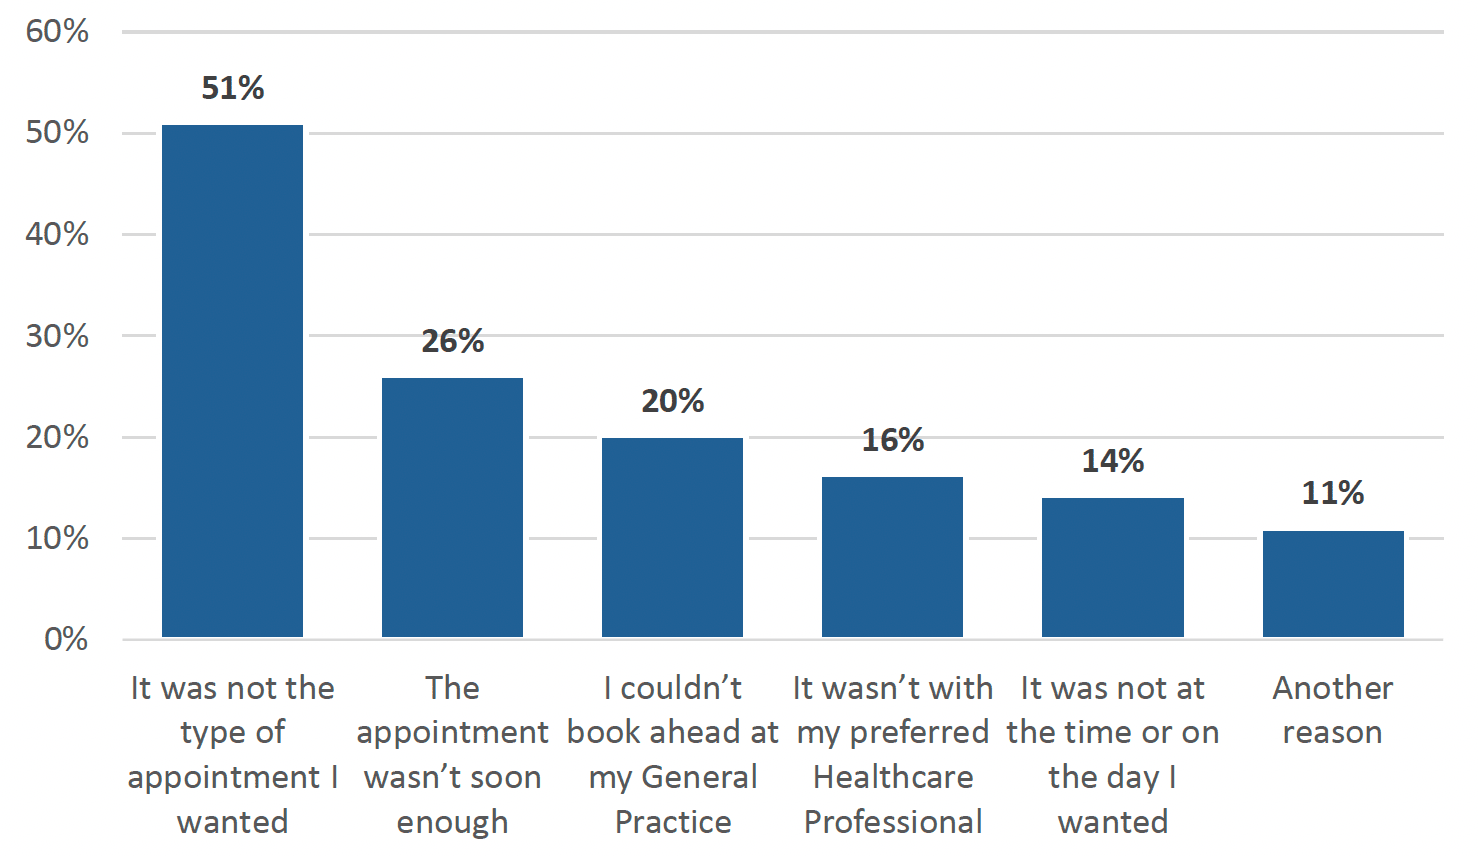
Type of appointment was the main reason for people not being satisfied with the offered appointment.
Note: People could tick one or more of the options above.
Opening hours
- Over four out of five people (82%) are happy with the opening hours of their General Practice. This question was temporarily removed from the survey in 2021/22 and the level of satisfaction is unchanged from 2019/20.
Urgent consultations
People were asked how long they waited the last time they needed to see or speak to a doctor or a nurse from their General Practice quite urgently.
- 84% were able to see or speak to a doctor or a nurse from their General Practice within 2 working days. This is slightly lower than the results from 2021/22 (85%) and 2019/20 (86%).
- 16% waited more than 2 working days to see or speak to a doctor or nurse. This is slightly higher than the results from 2021/22 (15%) and 2019/20 (14%).
When asked about the reasons for waiting longer than 2 days:
- 70% said they were not offered a chance to see or speak to anyone within two days.
- 16% responded that the person they wanted to see was not available in the next 2 days.
- 5% said that the times available in the next 2 days were not convenient.
- 10% gave another reason.
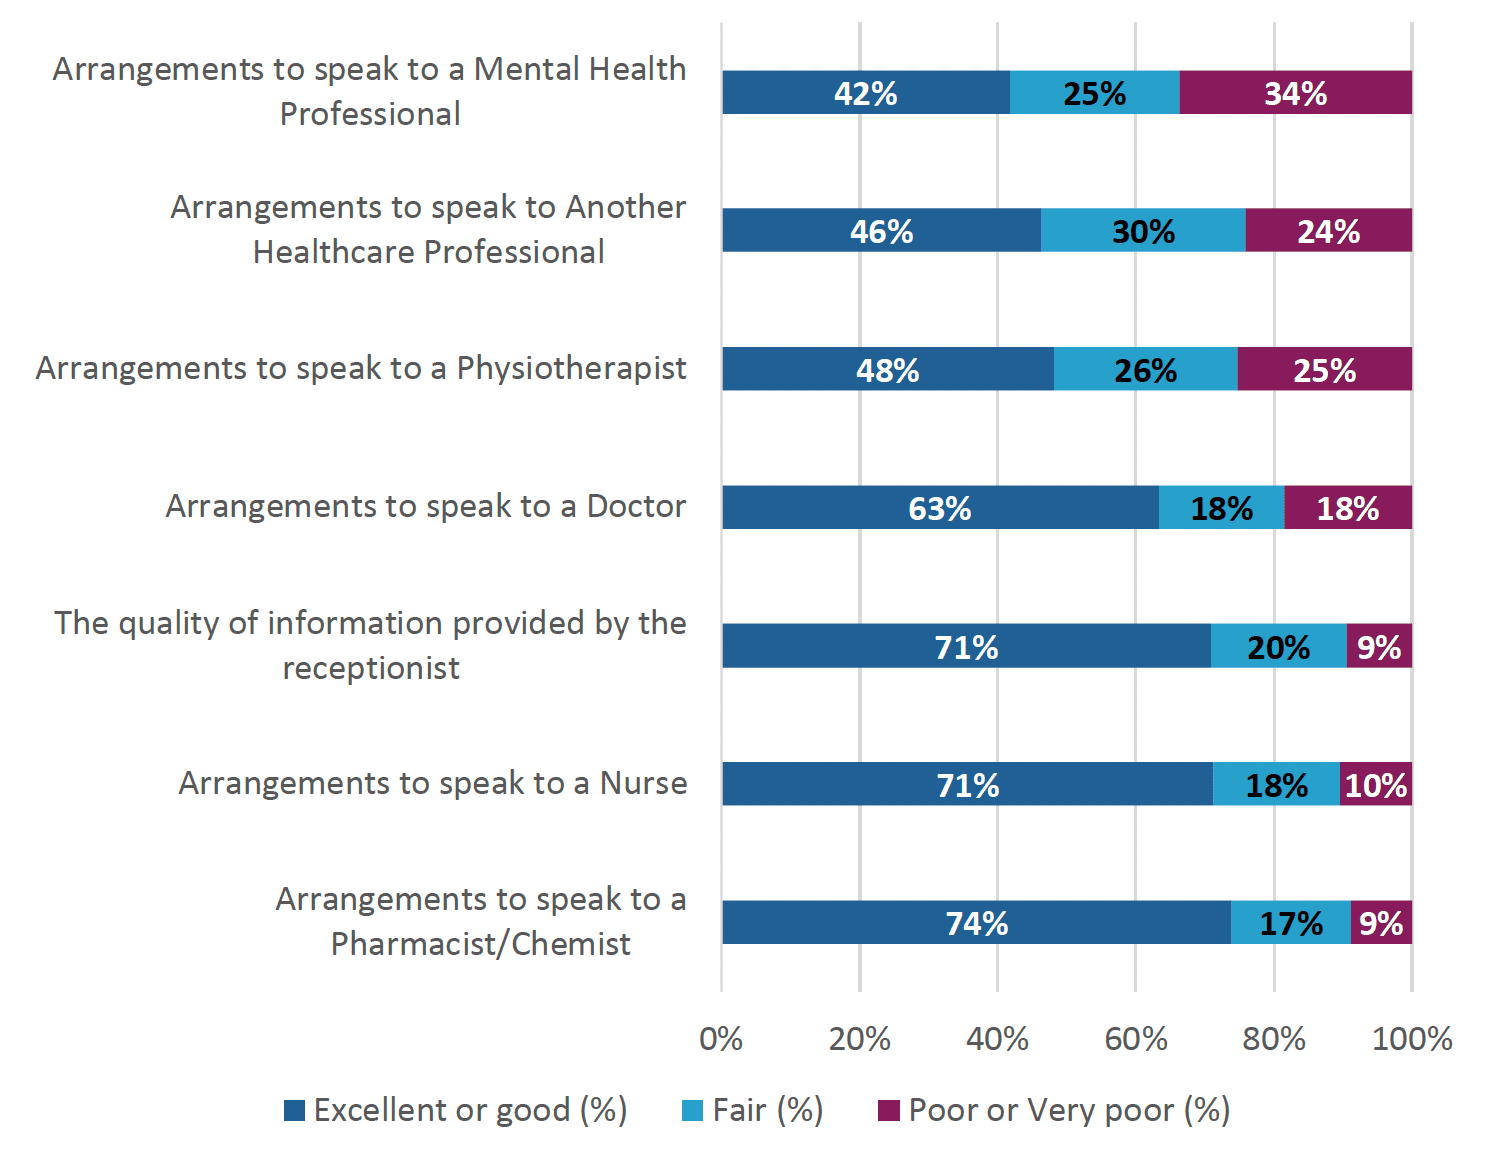
Receptionist and arrangements for getting to speak to a healthcare professional
71% of people rated the quality of information provided by the receptionist as good or excellent. This is higher than in 2021/22 (67%) and lower than the figure in 2019/20 (76%).
Survey participants were asked to rate the arrangements for getting to speak to a few different healthcare professionals.
34% of respondents rated the arrangements to speak to a mental health professional as poor or very poor.
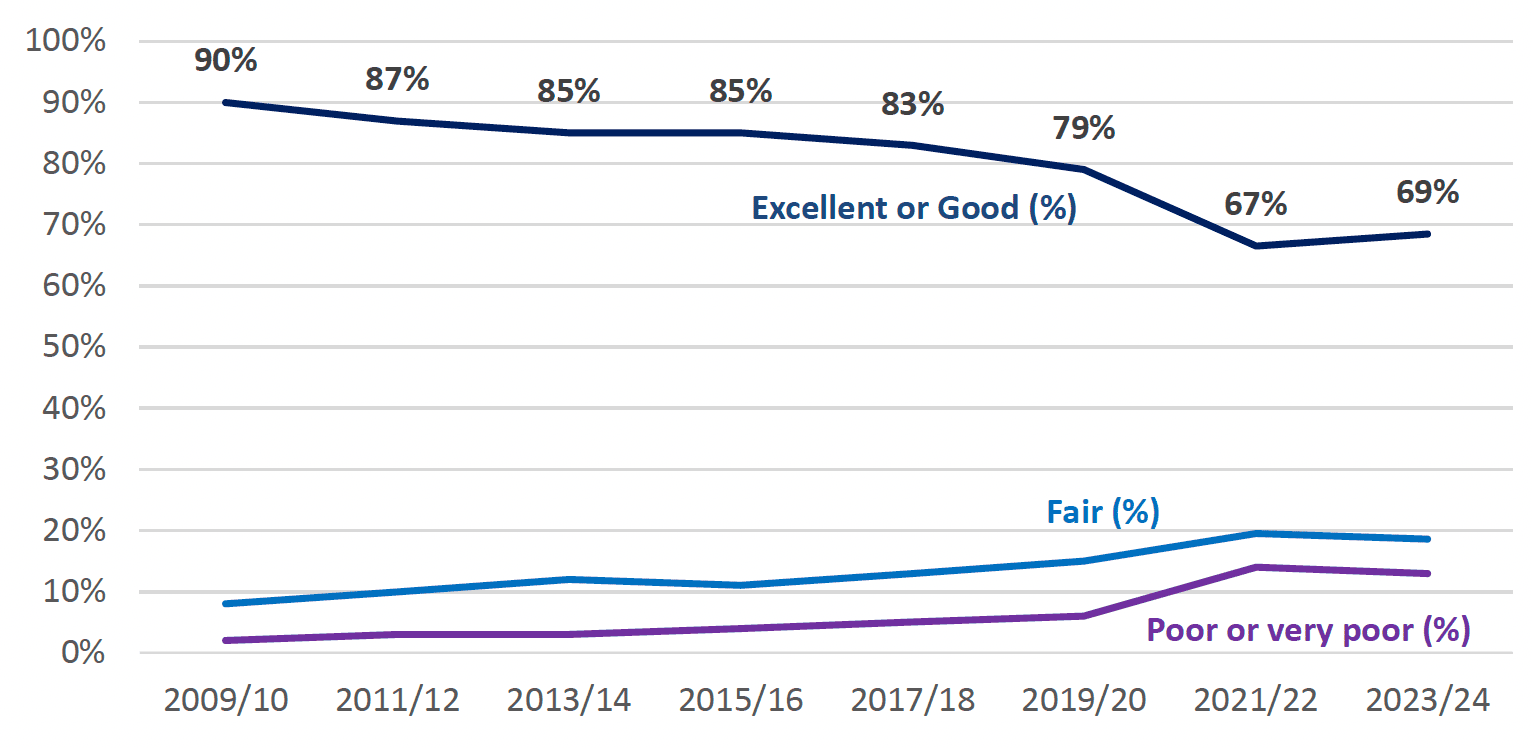
Overall care
69% of people rated the overall care provided by their General Practice as excellent or good, 19% as fair, and 13% rated it as poor or very poor.
The proportion of people rating the overall care from their General Practice as excellent or good increased in 2023/24, but it is still below 2019/20 levels.
Contact
Email: patientexperience@gov.scot
There is a problem
Thanks for your feedback