Health and Care Experience Survey 2023/24: National Results
This report shows the results of the Health and Care Experience Survey 2023/24. The survey asked about peoples’ experiences of accessing and using their General Practice and other local healthcare services; receiving care, support and help with everyday living; and caring responsibilities.
Treatment or Advice from your General Practice
Treatment or Advice received
Survey participants were asked about the last time that they received treatment or advice at their General Practice.
The most common reason for receiving treatment or advice was for another physical health problem (58%). 4% of respondents did not receive treatment or advice.
The majority of consultations were for another physical health problem.
| Treatment or Advice received | Weighted percentages (%) | Number of respondents |
|---|---|---|
| An injury or accident | 8% | 6,548 |
| Another physical health problem | 58% | 51,589 |
| A mental health problem | 10% | 6,378 |
| A routine appointment | 19% | 19,199 |
| Something else | 15% | 12,794 |
| No treatment/advice received | 4% | 3,348 |
Note: Respondents could tick more than one options and therefore the percentages do not sum to 100.
Healthcare Professional
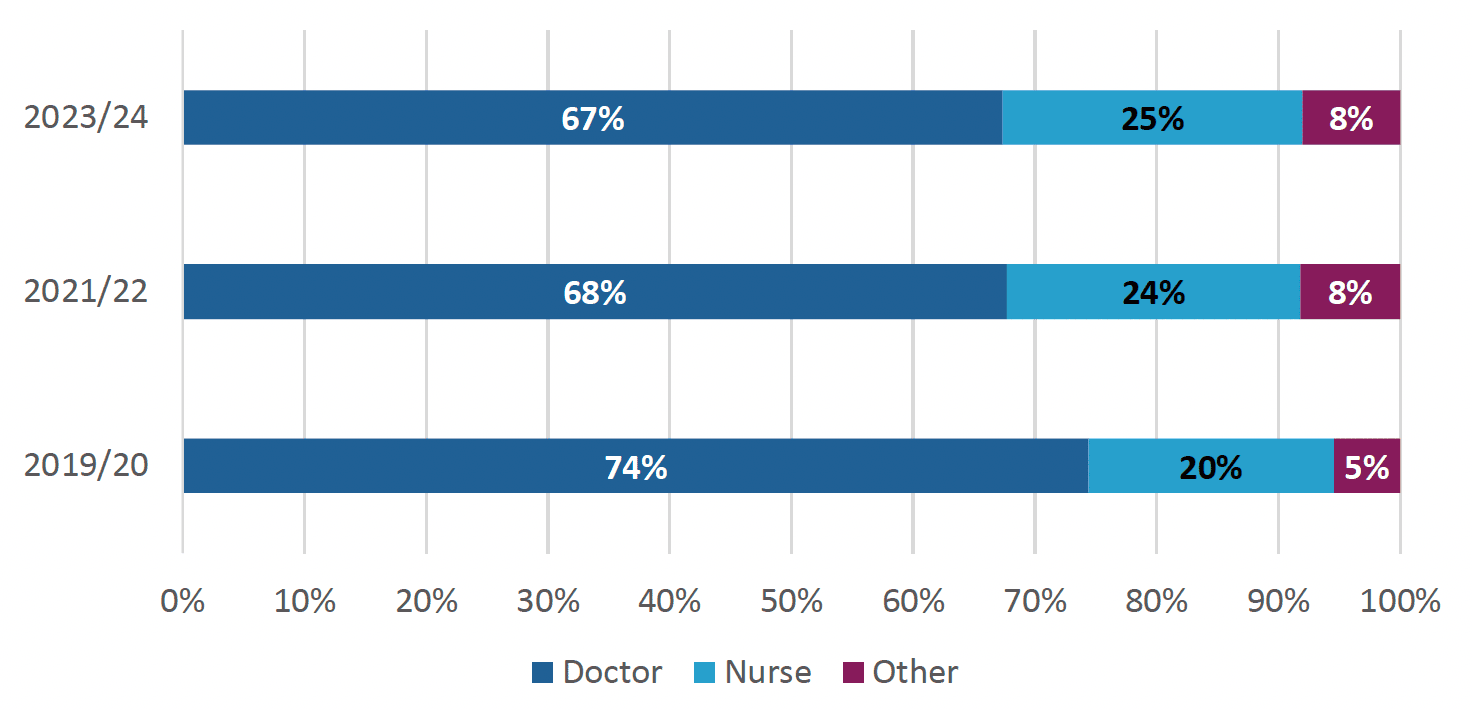
Referring to the same consultation, participants were asked who they received most of their treatment or advice from.
The proportion of consultations in 2023/24 where doctors gave most of the treatment or advice has decreased since 2019/20, but is relatively stable compared to 2021/22.
Person-centred care
Person-centred care is about ensuring the people who use NHS services are at the centre of care. It ensures that care is personalised, co-ordinated and enabling so that people can make choices, manage their own health, and live independent lives, where possible.
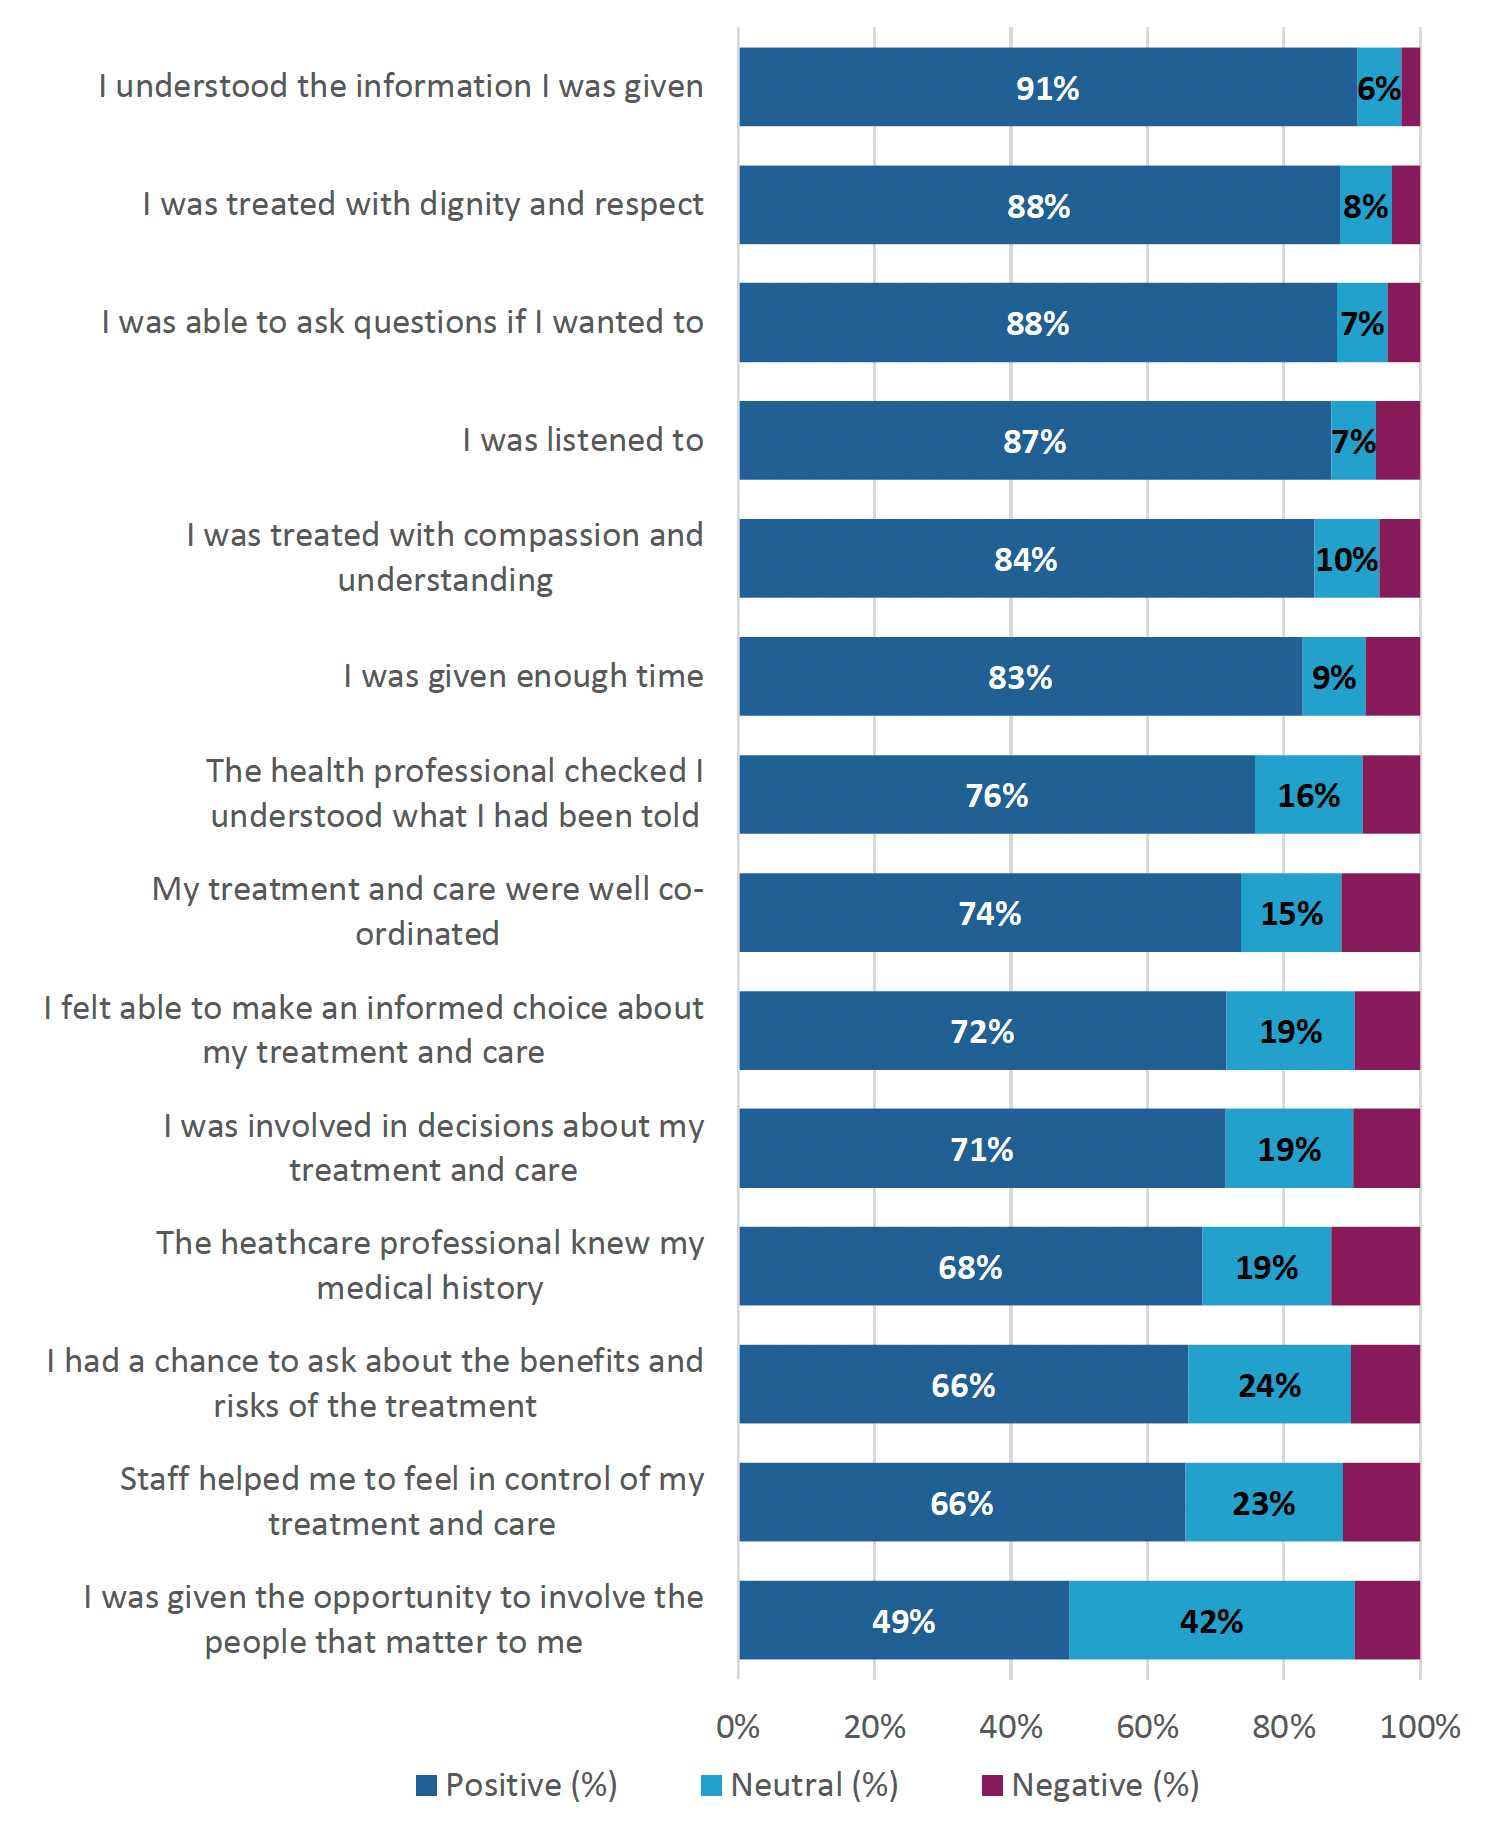
Participants were asked whether they agreed with fourteen statements relating to their experience, that describe principles of person-centred care, referring to last time they received treatment or advice at their General Practice. They could choose an option on a 5-point scale ranging from strongly agree to strongly disagree. We classify responses as ‘positive’ where the respondents agree or strongly agree with the statement, neutral where they neither agree nor disagree, and as negative where respondents disagree or strongly disagree.
- The most positively rated statements were: ‘I understood the information I was given’ (91%), ‘I was treated with dignity and respect’ (88%), and ‘I was able to ask questions if I wanted to’ (88%).
- The most negatively rated statements were: ‘The healthcare professional knew my medical history’ (13%), ‘My treatment and care were well coordinated’ (11%), and ‘Staff helped me to feel in control of my treatment and care’ (11%).
Among the person-centred statements, the most positively rated statement was: ‘I understood the information I was given’, and the most negatively rated statement was: ‘The healthcare professional knew my medical history’.
Effect of Treatment or Advice
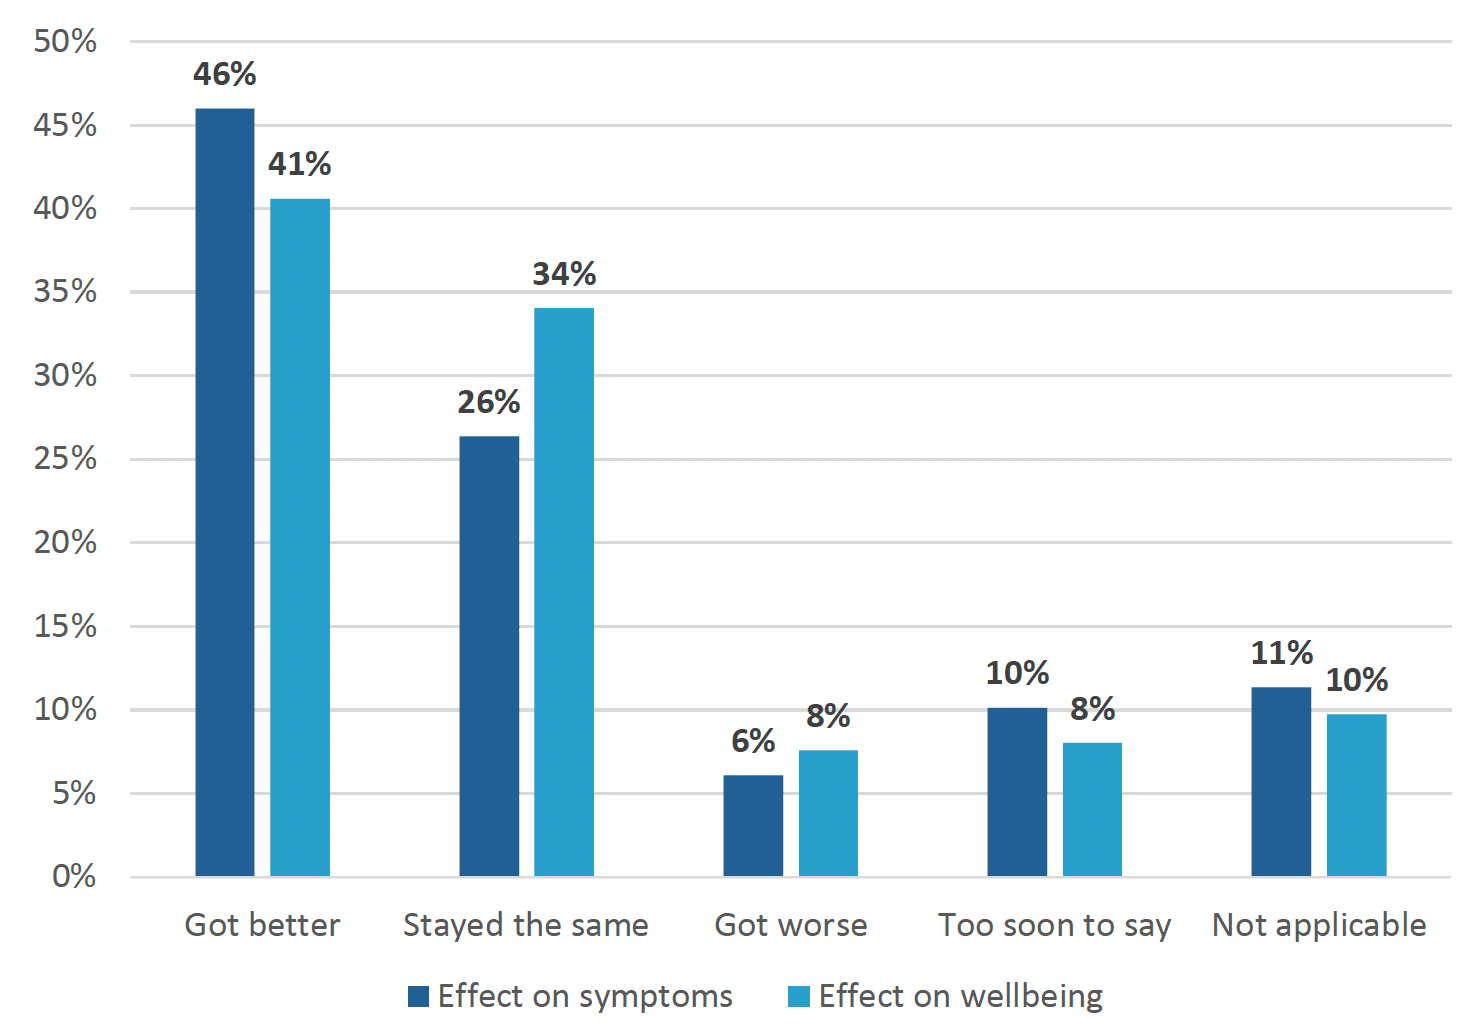
People were asked to describe the effect that the treatment or advice received from a General Practice had on both the symptoms they were experiencing and their overall wellbeing.
- 46% of respondents reported that their symptoms got better, and 41% reported that their overall wellbeing got better.
- 6% of people reported that their symptoms got worse, and 8% of people reported that their overall wellbeing got worse.
Treatment / advice tend to have more positive effects on symptoms than on overall wellbeing.
Contact
Email: patientexperience@gov.scot
There is a problem
Thanks for your feedback