Health and Care Experience Survey 2023/24: National Results
This report shows the results of the Health and Care Experience Survey 2023/24. The survey asked about peoples’ experiences of accessing and using their General Practice and other local healthcare services; receiving care, support and help with everyday living; and caring responsibilities.
Out of Hours Healthcare
Out of Hours healthcare: Contacts
In the last 12 months, 20% of people contacted an NHS service when they wanted to see a healthcare professional, but their General Practice was closed. This is an increase from 15% in 2021/22.
These people, who received Out of Hours healthcare, were asked to think about the last time they tried to get treatment when their General Practice was closed, and describe what they did. They could tick one or more options.
The majority of people phoned NHS 24 the last time they tried to get treatment when their General Practice was closed.
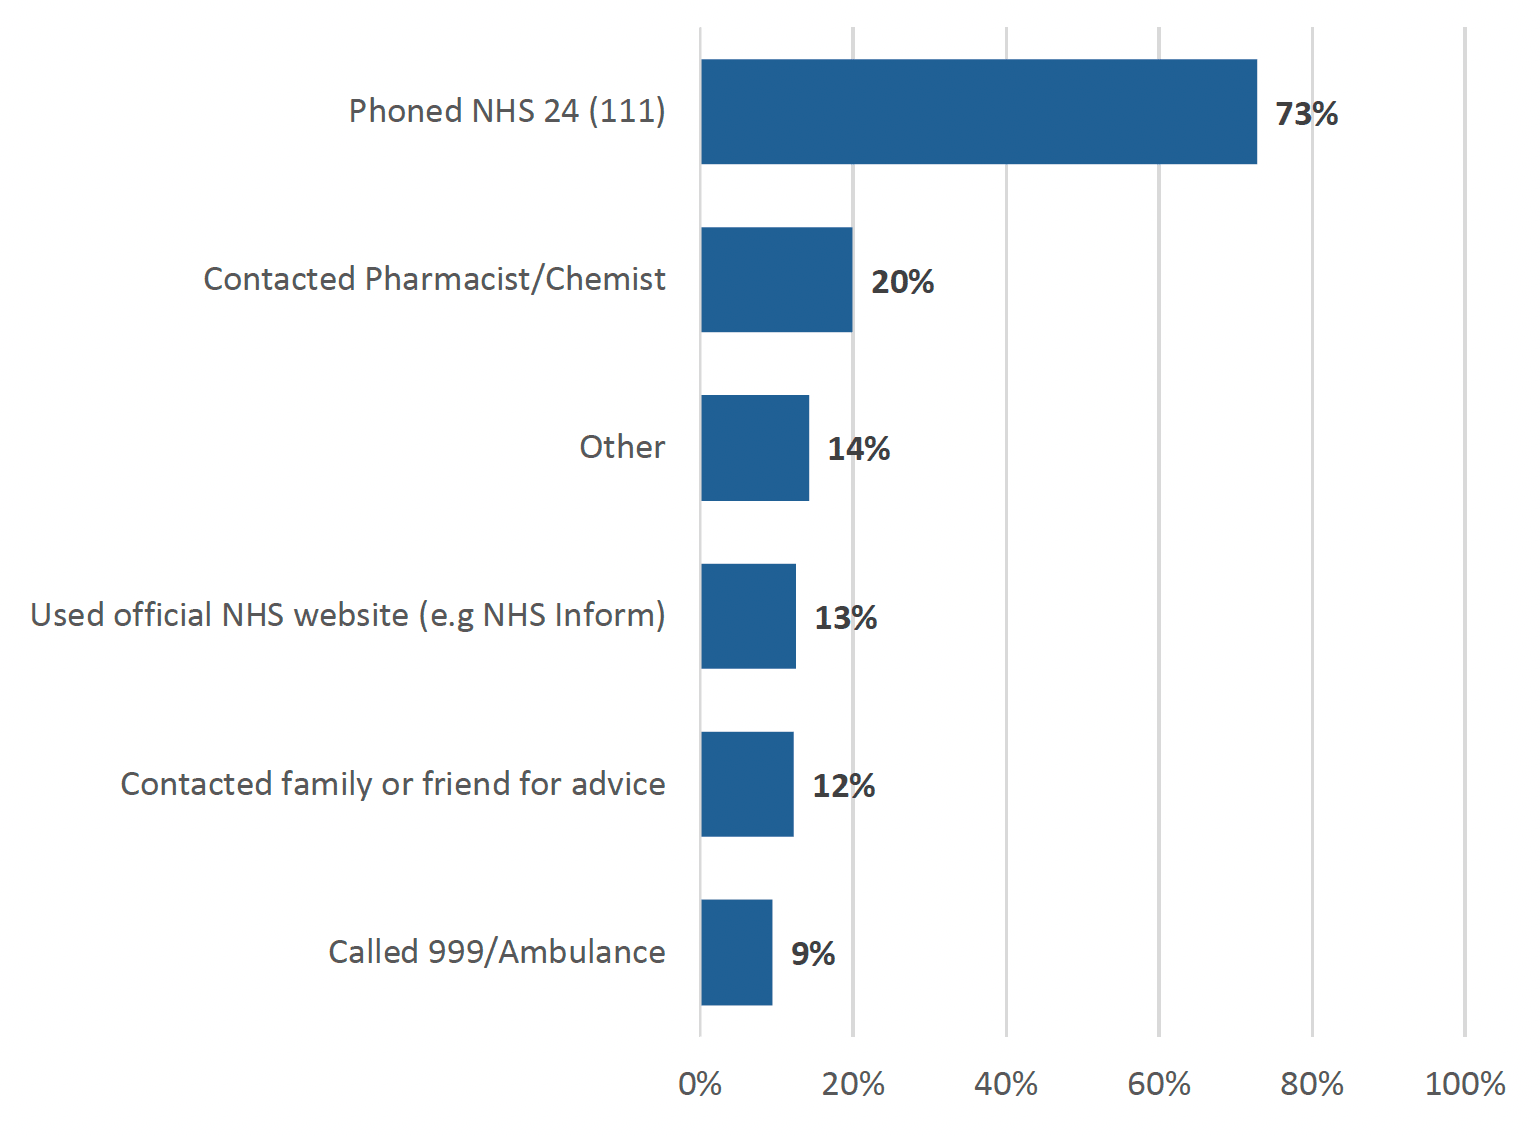
Note: Respondents could tick more than one options and therefore the total of percentages does not add to 100.
Healthcare Professional, Mode of the Consultation and Treatment / Advice Received
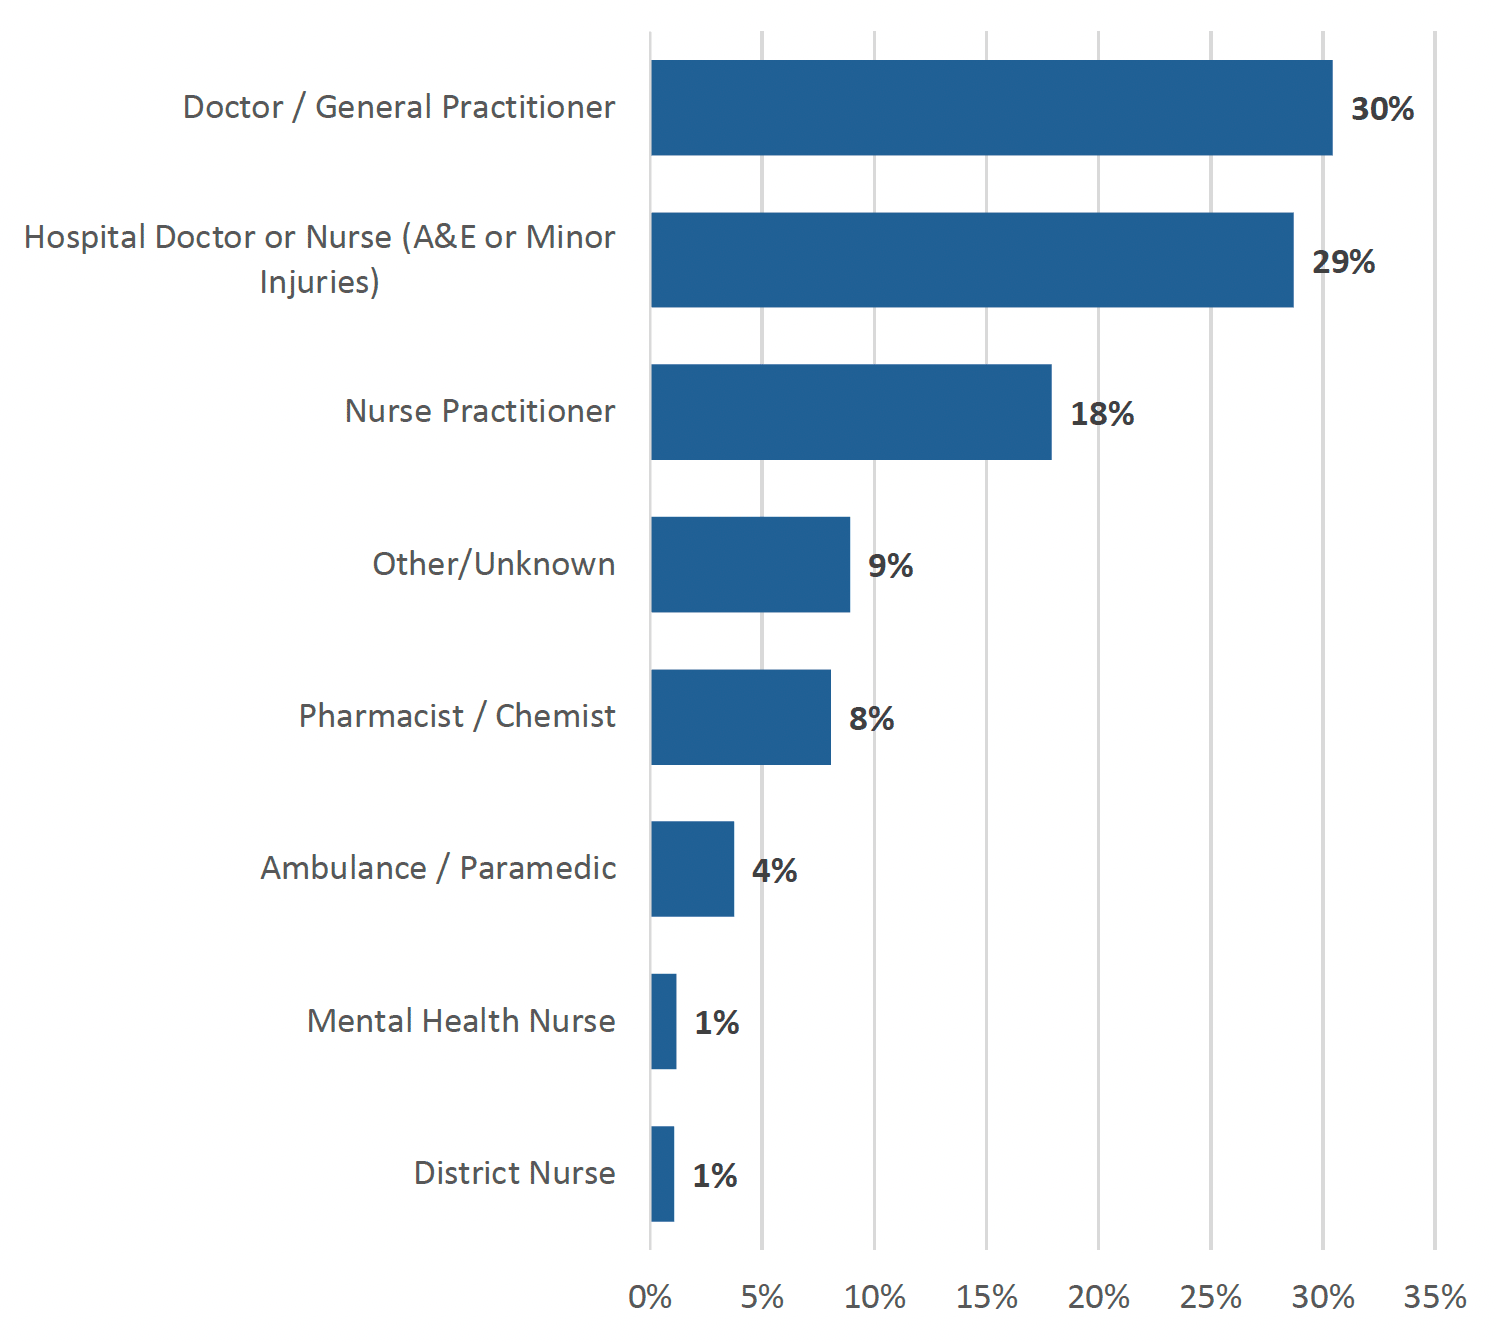
The majority of people received most of their treatment / advice either from Doctor / General Practitioners (30%) or from a Hospital Doctor or Nurse (A&E or Minor Injuries, 29%).
Mode of consultation
- Out of Hours consultations were predominantly either at hospital / location (50%), or over the telephone (44%).
- A minority of people were seen at their home / homely setting (5%), or received treatment or advice using a video call like Near me or Zoom (1%).
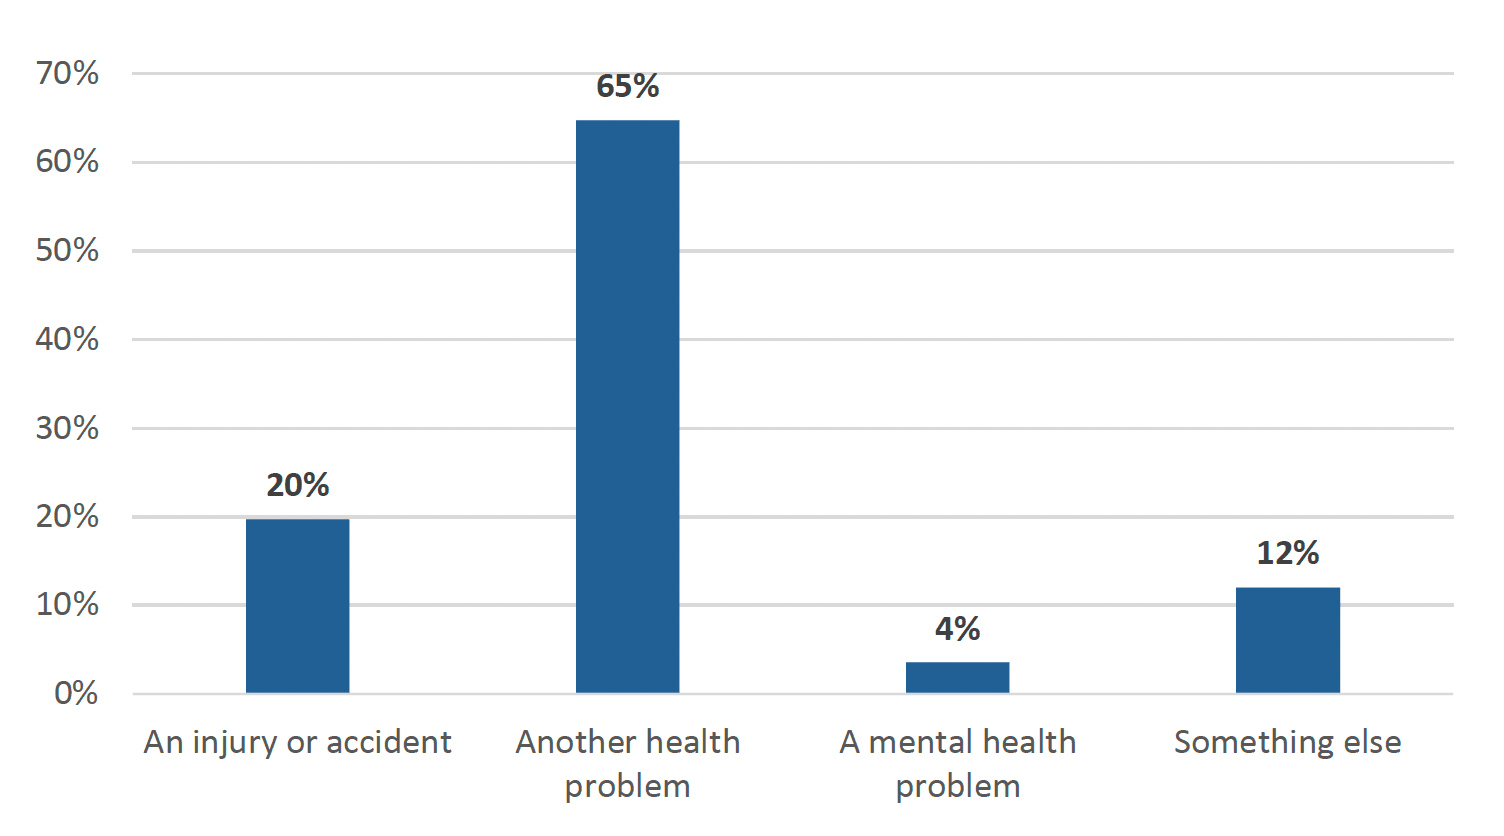
Of all Out of Hours consultations, 20% of consultations were for an injury or accident, and 65% for another health problem.
Care experience: Person-centred care and overall experience
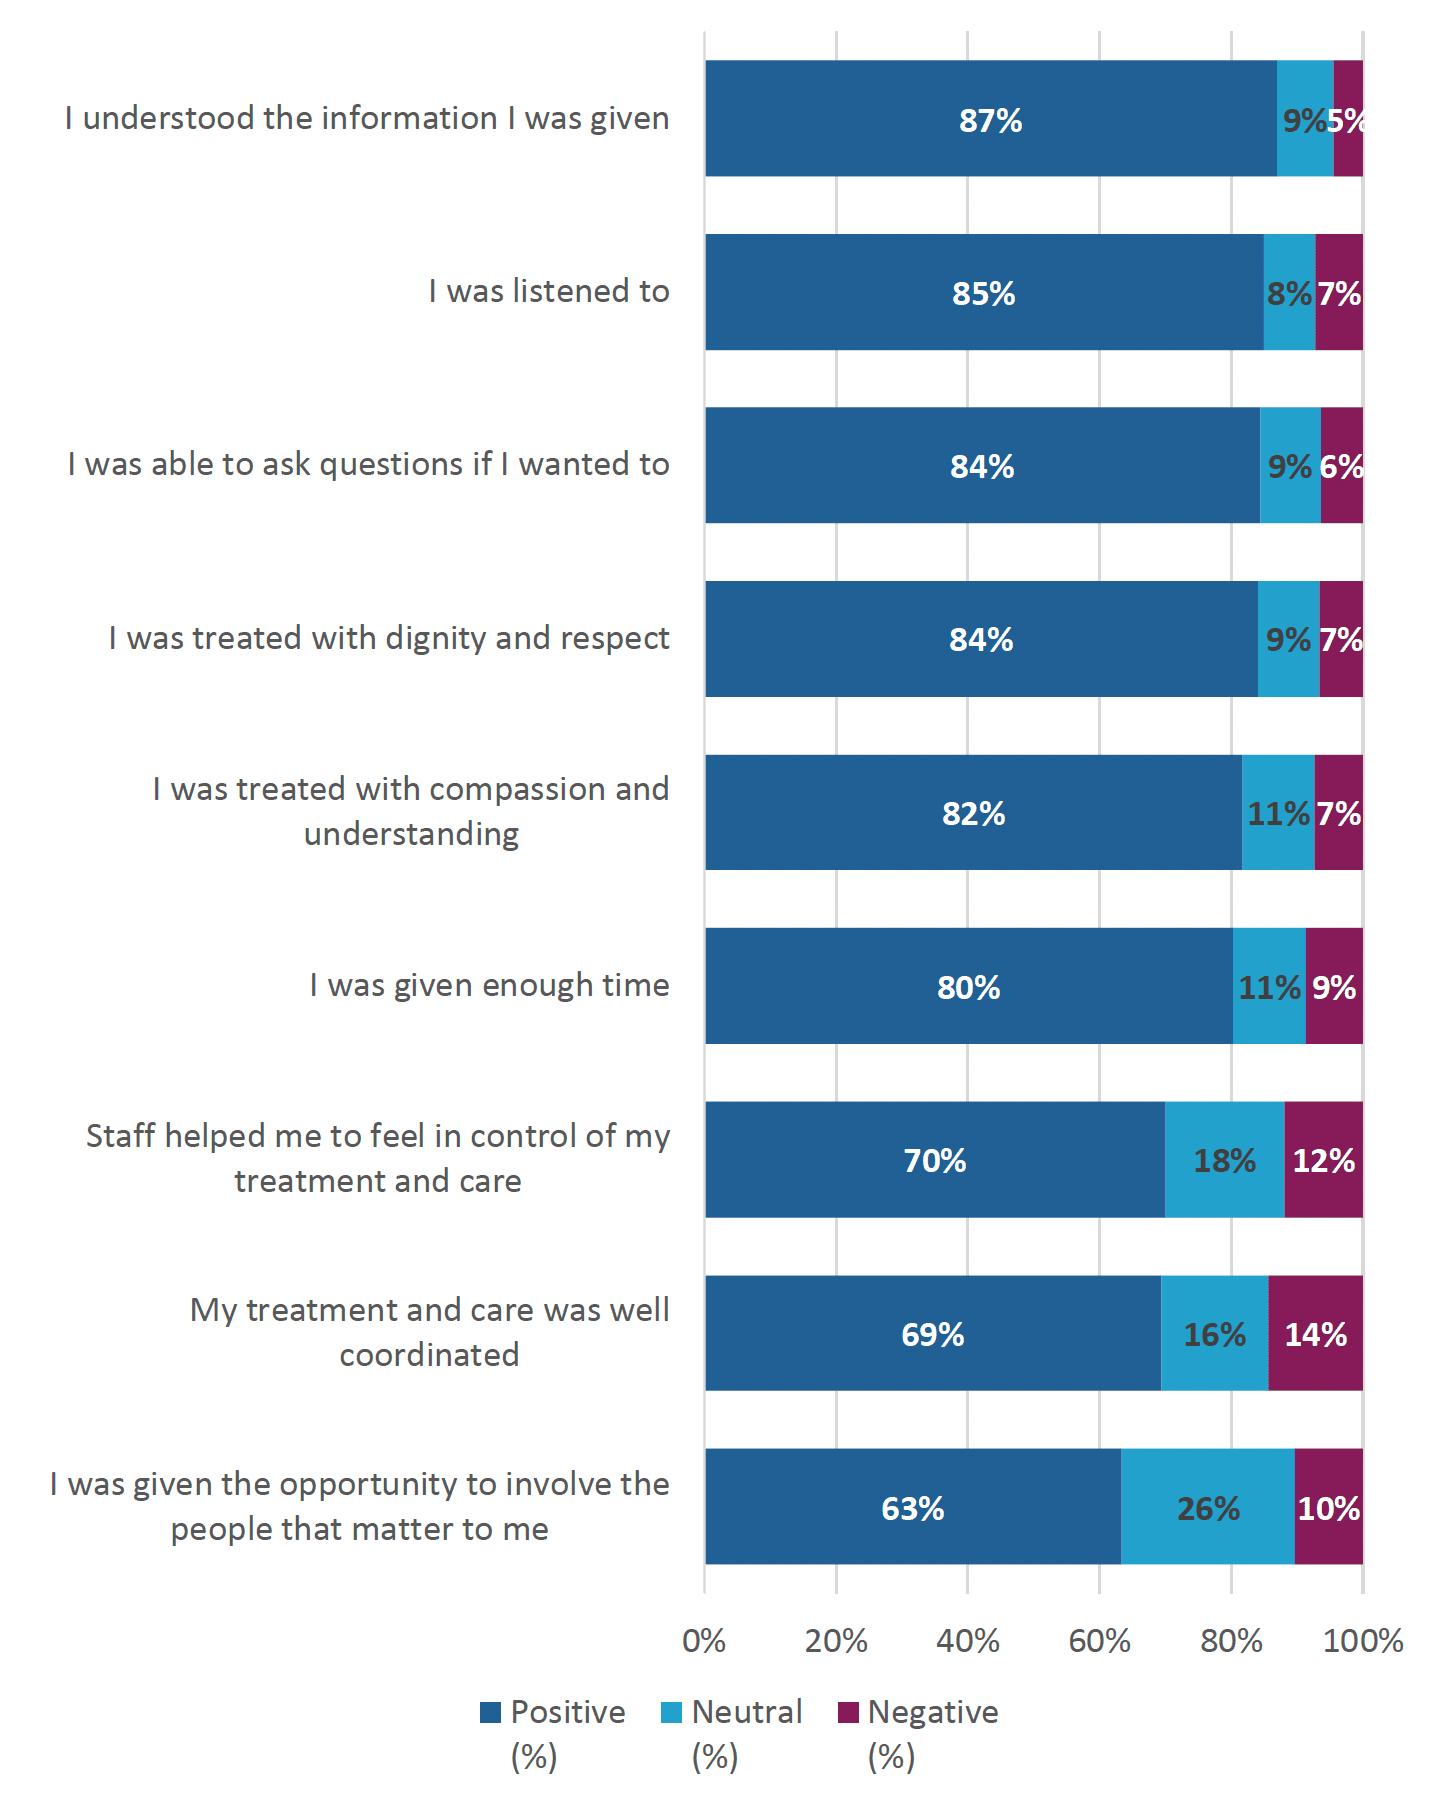
Participants were asked whether they agreed with nine statements, relating to their experience, that describe principles of person-centred care, referring to the last time they received Out of Hours care.
As in the previous section on person-centred care, we classify responses where the respondents agree or strongly disagree with the statement as ‘positive’, where they neither agree nor disagree as neutral, and responses where they disagree or strongly disagree as negative.
- The most positively rated statements were: ‘I understood the information I was given’ (87%), ‘I was listened to’ (85%), ‘I was able to ask questions if I wanted to’ (84%), and ‘I was treated with dignity and respect’ (84%).
- The most negatively rated statements were: ‘My treatment and care was well coordinated’ (14%), ‘Staff helped me to feel in control of my treatment and care’ (12%), and ‘I was given the opportunity to involve the people that matter to me’ (10%).
The most positively rated person-centred statement was: ‘I understood the information given to me’, and the most negatively rated statement was: ‘My treatment and care was well coordinated’.
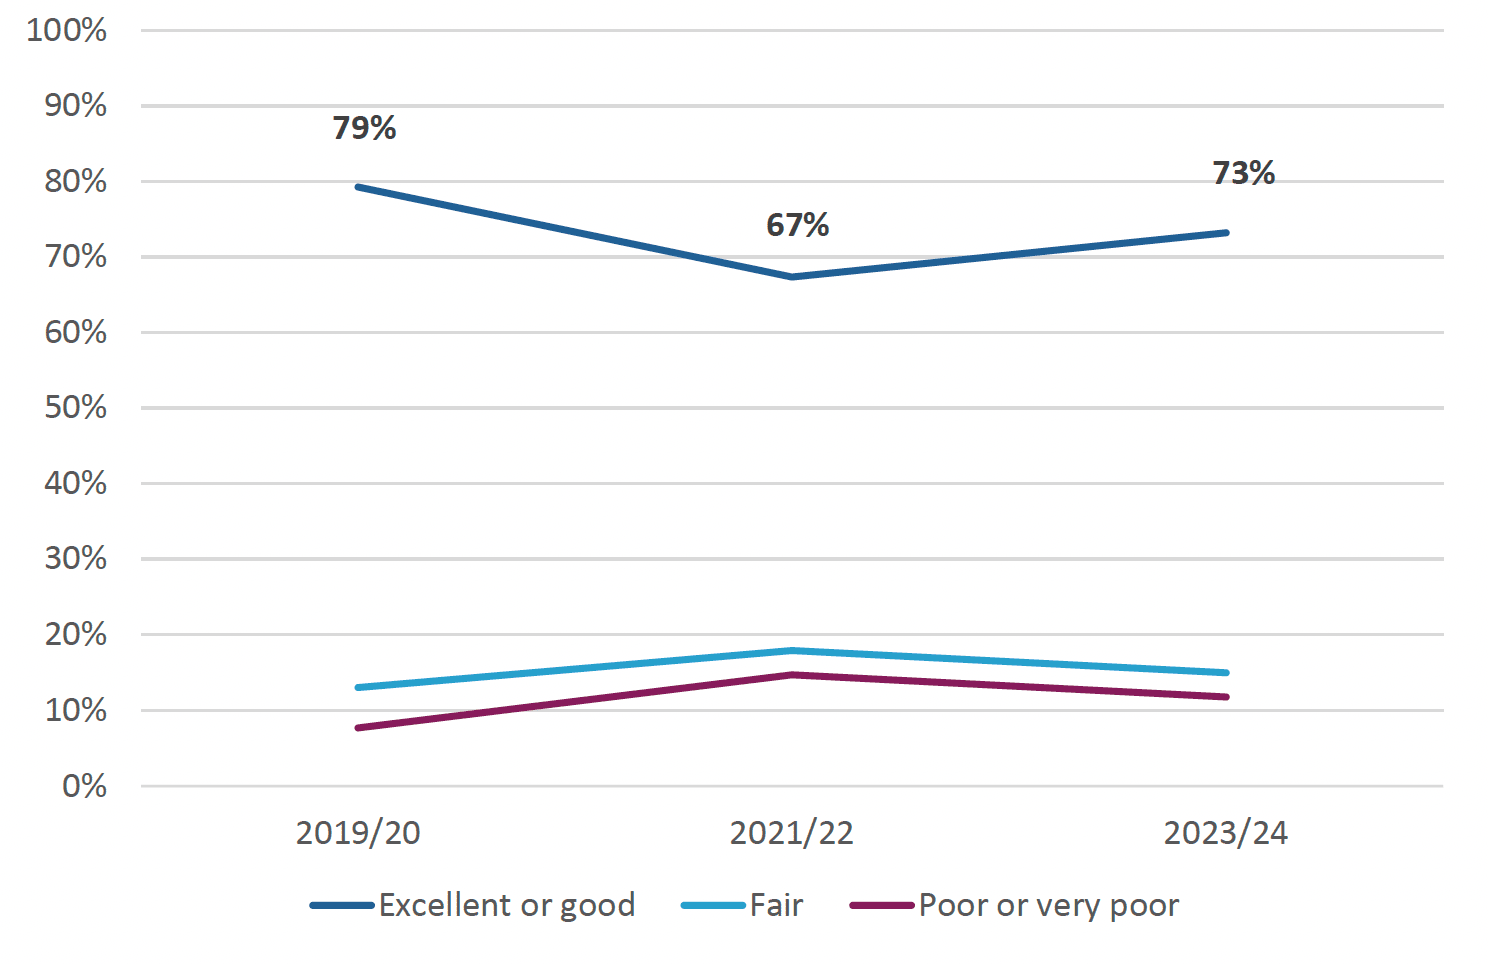
Survey recipients were asked ‘Overall, how would you rate the care you experienced from this service?’.
The proportion of people rating overall care from Out of Hours healthcare as excellent or good increased compared with 2021/22, but it is lower than in 2019/20.
Contact
Email: patientexperience@gov.scot
There is a problem
Thanks for your feedback