Health and Care Experience Survey 2023/24: National Results
This report shows the results of the Health and Care Experience Survey 2023/24. The survey asked about peoples’ experiences of accessing and using their General Practice and other local healthcare services; receiving care, support and help with everyday living; and caring responsibilities.
Care, Support and Help with Everyday Living
In this chapter, we report the survey results on care, support and help with everyday living, including help that people get from any organisations, friends or family.
Use of Care Services
12% of respondents received help or support with everyday living, 4% did not have help, but felt they needed it, and 84% did not need help.
| Weighted responses (%) | Number of respondents | |
|---|---|---|
| Yes, help for me with personal tasks | 7% | 8,953 |
| Yes, help for me with household tasks | 7% | 9,159 |
| Yes, help for me for activities outside my home, e.g. learning, working, socialising | 5% | 5,121 |
| Yes, help for me with adaptations, and/or equipment for my home | 4% | 5,700 |
| Yes, an alarm service (e.g. an electronic device I wear) that can get me help | 2% | 3,146 |
| Yes, emotional/community/peer support | 5% | 5,315 |
| No, not had any help but I feel that I needed it | 4% | 3,785 |
| No, I didn't need any help | 84% | 83,276 |
Note: Respondents could tick more than one option and therefore the total of percentages does not add to 100.
In 2023/24, the question asking whether someone receives help and support for everyday living changed. It no longer asks about help with caring responsibilities, as it did in previous rounds of the survey. This change was made because during questionnaire testing, some respondents were unsure as to whether to answer the questions in this chapter in relation to their experiences of support in their caring role, or in relation to the services that the person they care for receive.
A new response option on emotional / community / peer support has been added to reflect the importance that many people receiving care place on this. Consequently, the results for this chapter are not comparable with the results from previous rounds of the survey.
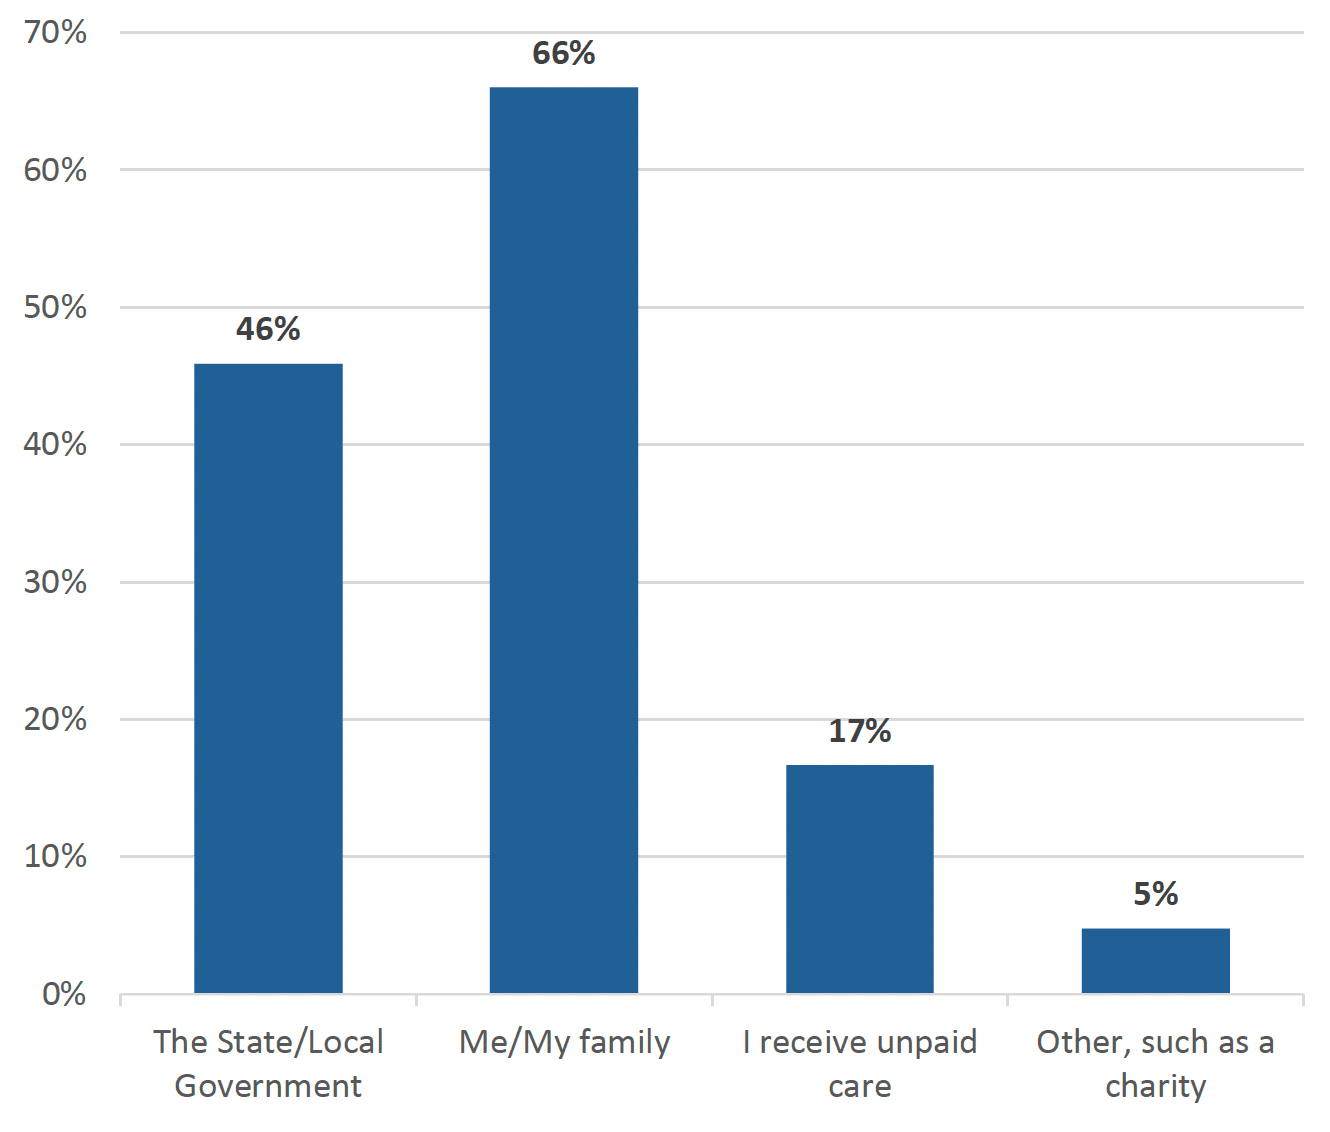
Survey recipients who had indicated that they had received some type of help and care services for everyday living were asked: ‘Who funds your help or support with everyday living?’. It is possible to receive help or support with everyday living from a variety of different sources and respondents were able to tick more than one response option.
66% of respondents stated that their help and support for everyday living is funded by themselves or their family.

Note: Respondents were able to tick more than one response related to the help they received and therefore percentages do not add to 100.
In terms of how help and support was arranged:
- 22% were offered a choice, and got their preference.
- 2% were offered a choice, but did not get their preference.
- 30% were not offered any choices in how their care was arranged.
- 13% did not want a choice.
- 32% could not remember or did not know whether they had a choice in how their help and care was arranged.
Experiences of Care Services
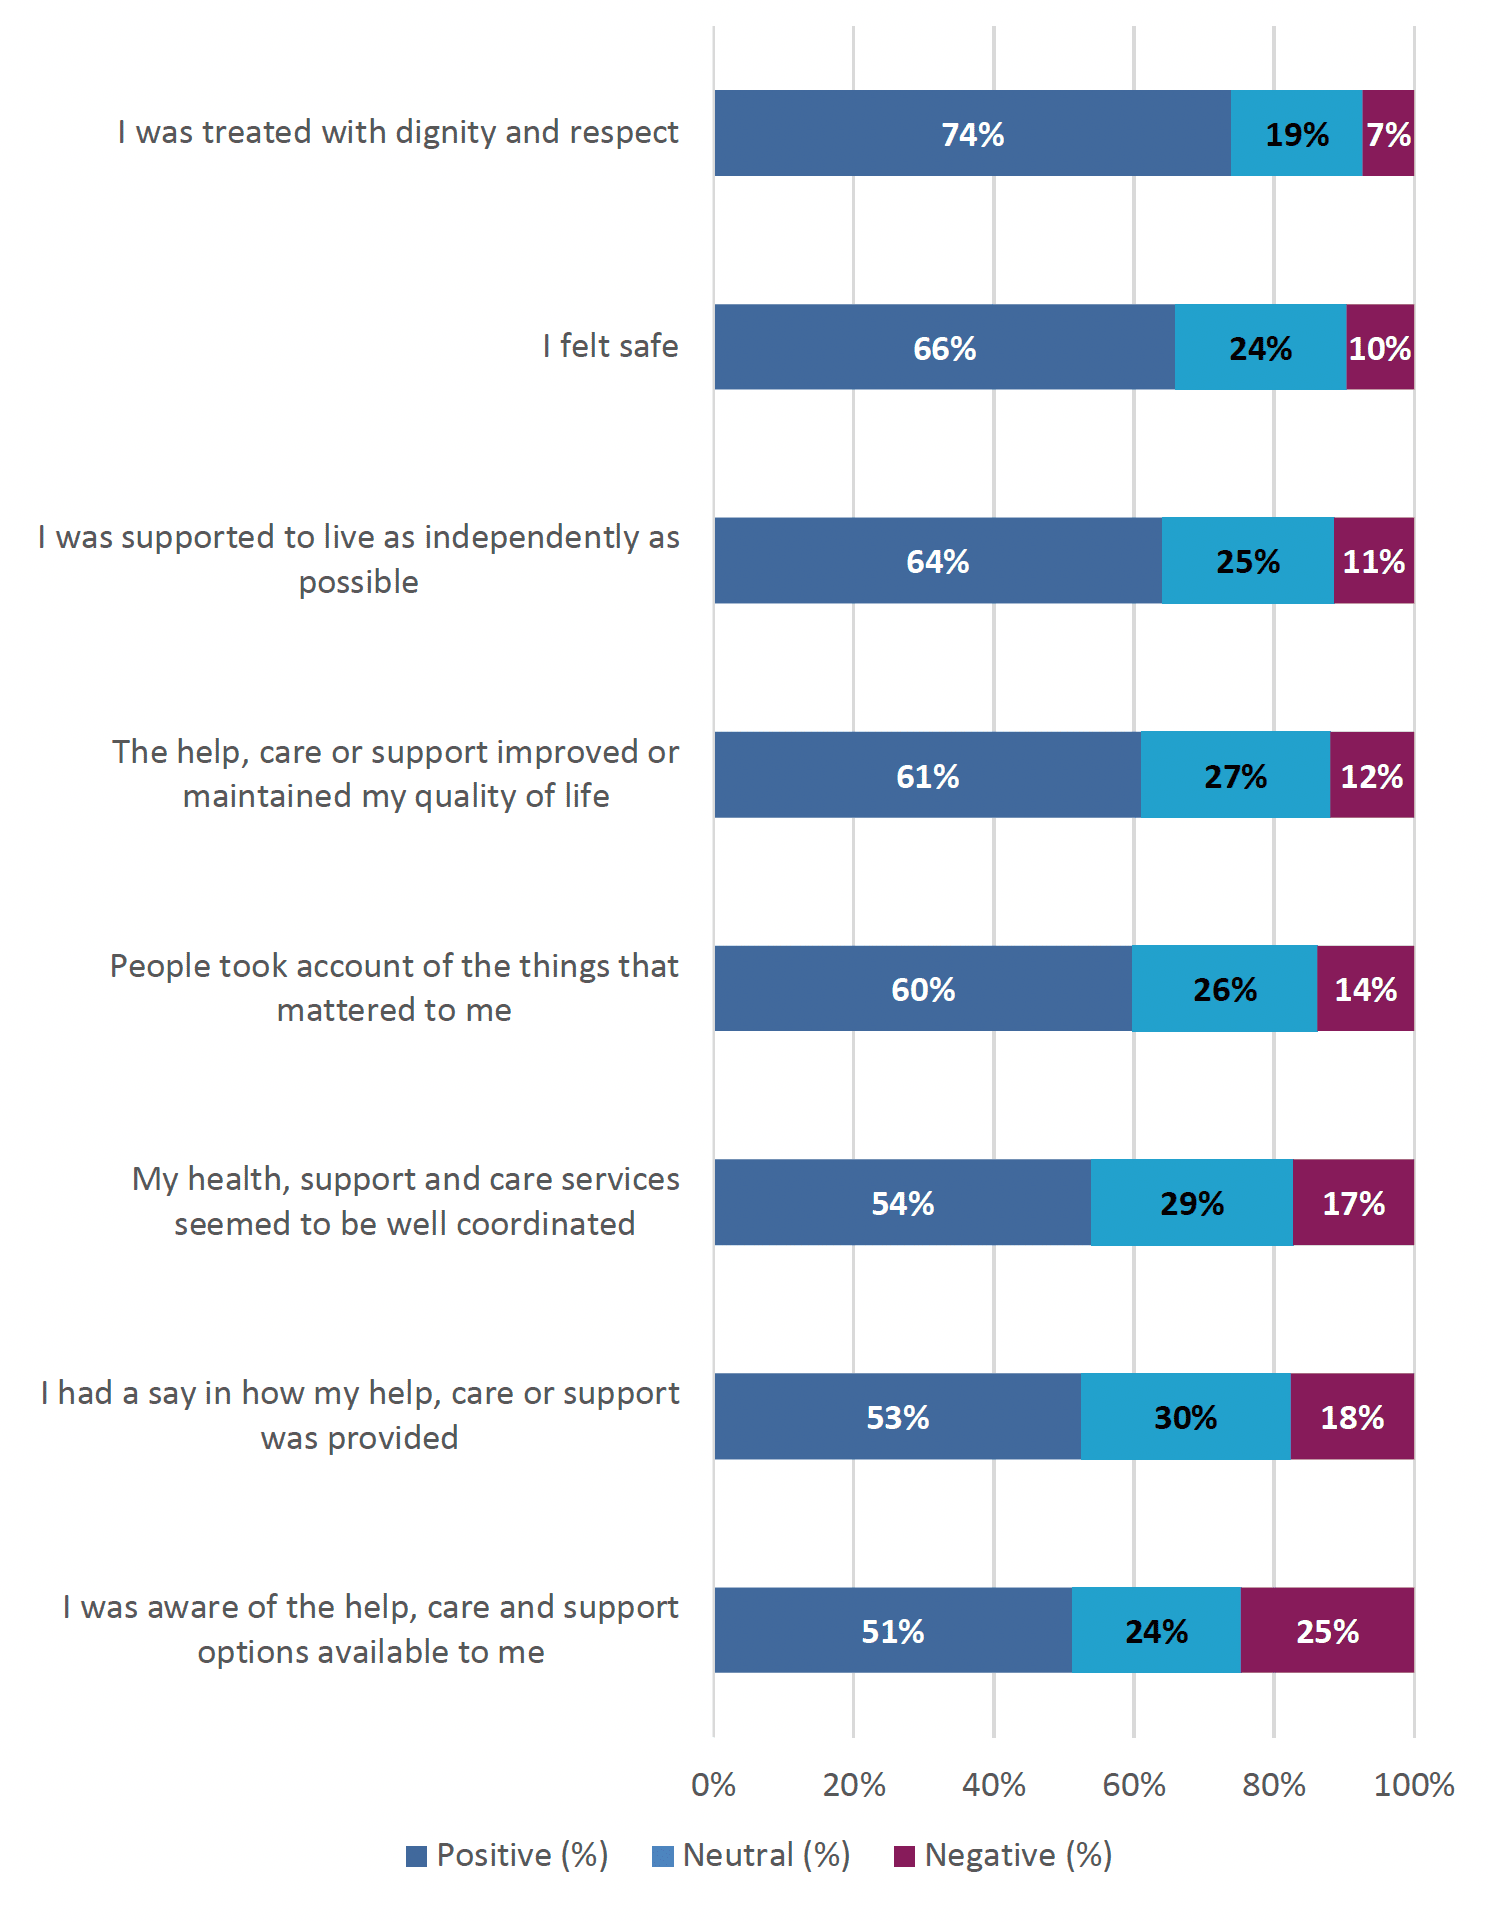
People receiving care, support and help with everyday living were asked whether they agreed with eight statements relating to their experience. These statements describe principles of person-centred care. As in previous sections, we classify responses where they agree or strongly agree with the statement as ‘positive’, responses where they neither agree nor disagree as ‘neutral’, and responses where they disagree or strongly disagree as ‘negative’.
- The most positively rated statement was: ‘I was treated with dignity and respect’ (74%), and the least positively rated statement was: ‘I was aware of the help, care and support options available to me’ (51%).
The results of the person-centred care statements are shown in Figure 16 below.
74% of people receiving care agreed that ‘I was treated with dignity and respect’.

Respondents who have received help or support for everyday living were asked to give their care a rating from Excellent to Very Poor. Respondents were asked to exclude any help and support received from friends and family in their rating.
- 63% rated their help, care or support services as good or excellent.
- 21% rated it as fair.
- 16% rated it as poor or very poor.
Unmet and Under-met Need
Those who receive help and care services for everyday living, or who responded that they didn’t receive help but felt they needed it, were asked:
‘If you are not receiving all the help and care services for everyday living that you feel you need, which options describe your situation? Please tick all that apply’.
The most common reason provided for why people felt that they needed more help and care services was that they weren’t sure if they were eligible for more, or any, support.
| Weighted responses (%) | Number of respondents | |
|---|---|---|
| I did not know how or where to ask for help | 23% | 2,990 |
| My current care service is not enough | 7% | 923 |
| I contacted my local authority and have not heard back | 4% | 550 |
| I have had an assessment, but care has not been provided | 6% | 725 |
| I do not qualify for services | 13% | 1,684 |
| I am waiting to be reassigned to a different provider | 2% | 225 |
| I am not sure I am eligible | 31% | 4,302 |
| Other | 10% | 1,348 |
| Not applicable | 29% | 4,378 |
Note: Respondents could tick more than one option, and therefore the total of percentages does not add to 100. All responses to the question are included, including “Not Applicable.
Contact
Email: patientexperience@gov.scot
There is a problem
Thanks for your feedback