Health and Care Experience Survey 2023/24 Technical Report
This report contains information about the methodology and background of the 2023/24 Health and Care Experience Survey.
Annex C: Confidence Intervals & Statistical Significance
Confidence intervals provide a way of quantifying sampling uncertainty. A 95% confidence interval means that, over many repeats of a survey under the same conditions, one would expect that the confidence interval would contain the true population value 95 times out of 100.
For example, given a results of 80% and a confidence interval of +/-3%, there is 95% confidence that the true result is between 77% and 83%.
A 95% confidence interval is calculated as: 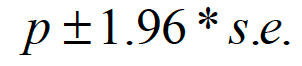
Here s.e. denotes the standard error which is calculated as: 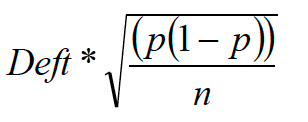
where p = point estimate (i.e. proportion who answered positively)
n = achieved sample size (i.e. number who responded)
Deft = Design Factor as detailed below
Design Factor & Design Effect
The sample for the Health and Care Experience survey was stratified by General Practice, with the aim of collecting a sufficient number of responses to be representative of the patients’ experience at each practice. This is a disproportionate stratified sampling design which can affect the standard errors that are used to calculate confidence intervals and test statistics.
One of the effects of using stratification and weighting is that this can result in standard errors for survey estimates being generally higher than the standard errors that would be derived from an unweighted simple random sample of the same size.
The Design Effect (Deff) can tell us how much information we have gained or lost by using a stratified random sample rather than a simple random sample. For example, if the design effect was equal to two, this would mean that we would need to have a survey that is twice the size of a simple random sample to obtain the same volume of information and precision of a simple random sample.
It is calculated as: 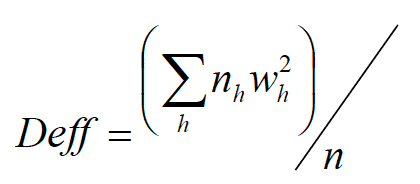
where wh = weight given to each stratum h
n = achieved sample size (i.e. number who responded)
nh = achieved sample size in each stratum h.
Calculating the Design Factor (Deft) can tell us by how much the standard error has increased or decreased compared to a simple random sample design, based on the design that has been used. It is calculated as the square root of Deff and is incorporated into the confidence interval calculations at National and NHS Board level.
Statistical Significance
A result can be described as statistically significant if it is unlikely to have occurred by random variation. Testing for statistical significance allows us to assess whether there have been significant changes in performance between two time periods or areas (e.g. between a specific Health Board and Scotland as a whole).
For each question where a comparison is possible – for example, between two different survey periods or between two areas – a test statistic is calculated to test the statistical significance of the difference between the two results.
The test statistic is calculated as: 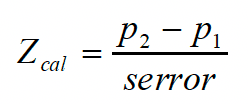
where p1 = the first point estimate or proportion
p2 = the comparable second point estimate or proportion
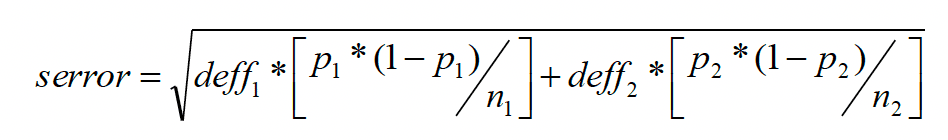
where n1 = the number of valid responses for point estimate 1
n2 = the number of valid responses for point estimate 2
deff1 = the design effect for point estimate 1
deff2 = the design effect for point estimate 2.
For point estimate 1 not to be statistically significantly different from point estimate 2 with 95% confidence, then the test statistic must be between ±1.96.
Contact
Email: patientexperience@gov.scot
There is a problem
Thanks for your feedback