Health and homelessness in Scotland: research
Study exploring the relationship between homelessness and health.
Chapter 8: Scottish Drugs Misuse Database
There were around 89,000 initial assessments at drug treatment services (hereafter referred to as SDMD assessments) over the time period 1 April 2002 to 31 March 2015 inclusive for the 1.3 million people in the study. For more information on SDMD data see Section 2.3.8.
In this chapter we discuss the study cohorts, their SDMD assessments activity and how this relates to homelessness. How this relates to deprivation and health needs is discussed in Chapter 11.
8.1 Comparative activity between the EHC and their controls
Accounting for one third of all people in the study, people in the EHC (Ever Homeless Cohort) accounted for 90% of SDMD assessments (62% male, 29% female). SDMD assessments amongst the MDC (Non-homeless 20% Most Deprived Cohort) accounted for 9% of assessments during the period (6% male, 3% female). The LDC (Non-homeless 20% Least Deprived Cohort) accounted for 1% of assessments (0.5% male, 0.2% female).
Table 8.1: Number of people, number of SDMD assessments and the ratio of the number SDMD assessments between EHC and MDC, and between EHC and LDC, by age and sex.
| Age (31st March 2015) |
Male |
Female |
||||||
|---|---|---|---|---|---|---|---|---|
| Number of people |
SDMD assessments |
EHC : MDC |
EHC : LDC |
Number of people |
SDMD assessments |
EHC : MDC |
EHC : LDC |
|
| 0 to 15 |
135,444 |
127,461 |
||||||
| 16 to 20 |
49,263 |
251 |
8.4 |
31.1 |
51,276 |
124 |
6.2 |
106.0 |
| 21 to 25 |
64,209 |
2,528 |
9.6 |
59.3 |
78,690 |
1,656 |
13.2 |
153.0 |
| 26 to 30 |
75,363 |
7,136 |
14.3 |
103.3 |
93,003 |
4,750 |
13.1 |
209.2 |
| 31 to 35 |
82,830 |
17,717 |
13.5 |
145.1 |
86,046 |
9,701 |
12.5 |
146.3 |
| 36 to 40 |
45,924 |
11,923 |
9.2 |
128.7 |
41,706 |
4,883 |
8.7 |
189.5 |
| 41 to 45 |
55,737 |
11,291 |
8.8 |
150.5 |
48,873 |
4,040 |
8.0 |
223.7 |
| 46 to 50 |
49,818 |
6,486 |
7.9 |
136.2 |
43,563 |
2,254 |
6.8 |
77.7 |
| 51 to 55 |
37,746 |
2,393 |
7.3 |
104.4 |
31,578 |
716 |
5.8 |
|
| 56 to 60 |
25,017 |
805 |
7.6 |
19,017 |
193 |
7.5 |
||
| 61 to 65 |
15,765 |
243 |
14.2 |
11,436 |
70 |
|||
| 66 or over |
21,591 |
101 |
8.8 |
16,203 |
18 |
|||
| Total |
658,707 |
60,875 |
10.3 |
124.9 |
648,852 |
28,406 |
10.1 |
154.7 |
Note: Cells relating to fewer than 10 SDMD cases have been left blank as the uncertainty around these ratios would be high.
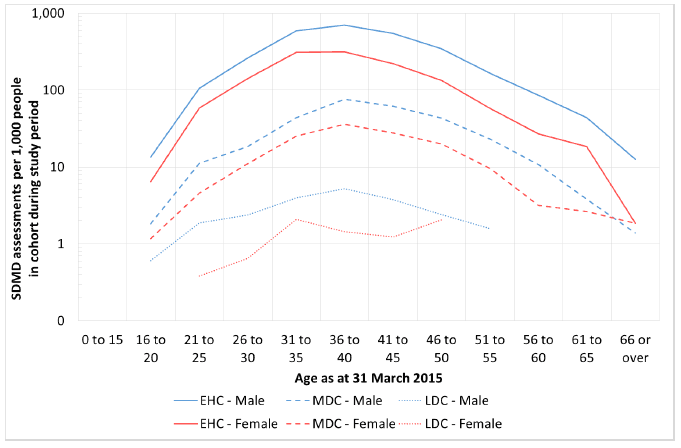
In order to see how SDMD assessments compare in the different cohorts, ratios of SDMD assessments were constructed for each age band and sex ( Table 8.1).
The EHC have much more SDMD activity
In total, the EHC has ten times more SDMD assessments compared with MDC (10.3 times for males, 10.1 for females) and over 100 times more SDMD assessments compared with LDC (125 times for males, 155 times for females).
For each age and sex breakdown, the EHC have more SDMD activity
Compared to the controls in the MDC or LDC, the ratio of SDMD assessments is always greater than one (minimum ratio is: 5.8, female EHC : MDC at 51–55 years).
The EHC age profile is roughly similar to those of the MDC and male LDC
The distribution by age is roughly similar for the EHC as for the MDC and for the male LDC. However, the EHC peaks at slightly younger age (Figure 8.1).
Figure 8.1: Total number of SDMD assessments by age, sex and cohort, standardized per 1,000 people. (Note the y-axis has a logarithmic scale).
8.2 Number of SDMD assessments per person
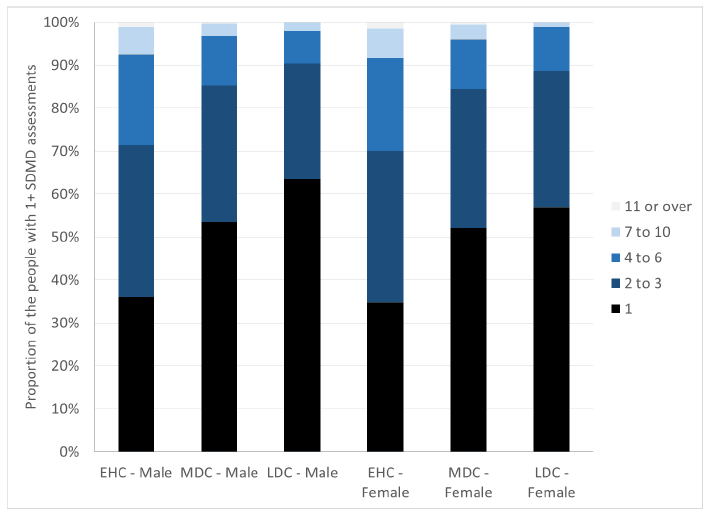
The previous section found that, on average, people in the EHC had more SDMD assessments than their controls. This section explores whether this is due to a higher proportion of the EHC having SDMD assessments, or a higher proportion of the EHC who had SDMD assessments having multiple SDMD assessments, or both ( Figures 8.2 and 8.3). The following points apply for both sexes:
More of the EHC had at least one SDMD assessments
A higher proportion of the EHC (8.8% males, 4.0% females) had at least one SDMD assessment than the MDC (1.2% males, 0.5% females) and LDC (0.11% males, 0.04% females) over the study period.
More of the EHC had many SDMD assessments
A higher proportion of the EHC people who had at least one SDMD assessment had seven or more SDMD assessments (7.5% males, 8.4% females) than the MDC (3.2% males, 4.0% females) and LDC (2.0% males, 1.1% females) over the study period.
Figure 8.2: Proportion of people in the study who have at least one SDMD assessment during the study period by cohort and sex.
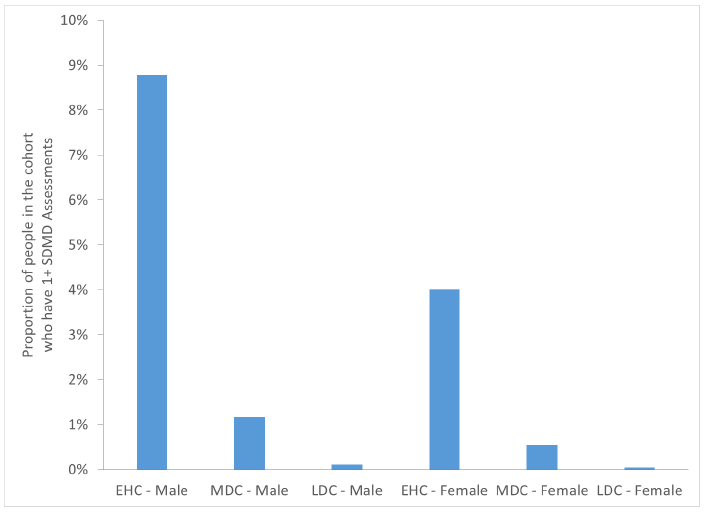
Figure 8.3: Proportion of people who have at least 1 SDMD assessment during the study period by cohort, sex and how many SDMD assessments they had.
8.3 Illicit Drugs
The SDMD records up to eight illicit drugs for each assessment. This section considers the ten most commonly recorded main illicit drugs ( Table 8.10). The following apply for both sexes:
The majority of SDMD cases among the cohorts had heroin as the main illicit drug.
The ratios of the EHC to the controls for crack cocaine, methadone , diazepam, and cannabis are also particularly high.
Table 8.10: Count of the ten most commonly recorded main illicit drugs in SDMD assessment (number) and the ratios of these across the cohorts.
| Age (31st March 2015) |
Male |
Female |
||||
|---|---|---|---|---|---|---|
| SDMD assessments |
EHC : MDC |
EHC : LDC |
SDMD assessments |
EHC : MDC |
EHC : LDC |
|
| Heroin |
31,092 |
12.3 |
154.5 |
14,586 |
12.8 |
168.2 |
| Missing |
13,009 |
10.7 |
155.7 |
6,532 |
9.4 |
139.6 |
| Cannabis unspecified |
5,916 |
8.1 |
70.3 |
1,991 |
6.7 |
85.8 |
| Diazepam |
3,795 |
9.7 |
214.1 |
1,743 |
9.7 |
|
| Cocaine unspecified |
1,596 |
4.8 |
33.1 |
440 |
6.0 |
|
| Methadone unspecified |
882 |
8.3 |
605 |
9.4 |
||
| Dihydrocodeine |
861 |
6.5 |
579 |
5.5 |
||
| Alcohol unspecified |
689 |
6.3 |
247 |
7.3 |
||
| Amphetamines unspecified |
425 |
4.0 |
320 |
5.9 |
||
| Crack cocaine |
289 |
17.9 |
178 |
16.8 |
||
| Benzodiazepines unspecified |
242 |
10.0 |
100 |
8.1 |
||
| Total - top 10 only |
58,796 |
10.4 |
128.4 |
27,321 |
10.3 |
154.8 |
| All SDMD Assessments |
60,875 |
10.3 |
124.9 |
28,406 |
10.1 |
154.7 |
8.4 SDMD Assessments Relative to the Date of First Homelessness Assessment by Once and Repeat
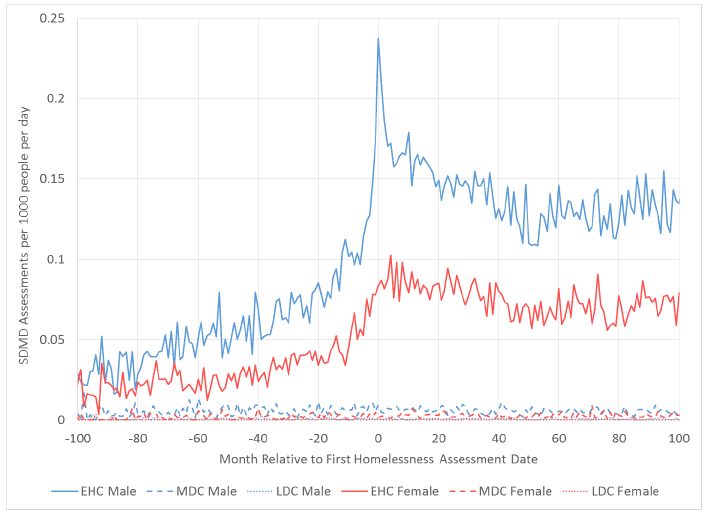
In Section 8.1 it was shown that the EHC had more SDMD assessments than both control cohorts. In order to explore the relationship between homelessness and SDMD activity, this section compares the timing of SDMD assessments with the date of first homelessness assessment. As in previous chapters this is done separately for Once-only EHC ( Figure 8.4) and Repeat EHC ( Figure 8.5). Detail on this method is described in full in Section 2.10.
However in this chapter there were very few cases among the LDC. Therefore using the numbers from the LDC as a denominator for the temporal plots would be problematic. Instead, the number of people present in the dataset at each day (relative to the homelessness assessment date) during the period that the SDMD dataset covered was calculated. This was then used as the denominator. The numerators were unchanged from the previous method. This could be thought of as comparing the actual activity, to hypothetical activity if all people in the study had one unit of activity each day. In this way the y-axis now shows the number of SDMD assessments per person per day. Hereafter these are referred to as rates.
SDMD assessment rates for Repeat EHC are higher than for Once-only EHC. The following points apply for both sexes:
SDMD assessment rate increases up to the peak earlier for Repeat EHC
From three years for males (1.5 years for females) prior to, to a few months before, the date of first homelessness assessment, Once-only EHC rates increase. This is a notably shorter time than the increase for the repeat EHC. The increase among the Repeat EHC starts eight years prior to first homelessness assessment for males (four years for females). Perhaps the people who go on to have multiple homelessness episodes are more likely to be those who have an underlying drug-related condition.
There is a peak for Once-only EHC and for male Repeat EHC
For males there is a peak around the date of homelessness assessment. For both the Once-only and Repeat EHC this increases by around 2.3 times from the previous values. For females there is a smaller peak for the Once-only EHC, with an increase of around 50%. For the female Repeat EHC the rate undergoes a level-shift increase around this time, but does not drop back again immediately following this.
The ratio falls back to pre-homelessness levels only for once-only EHC
For the once-only EHC, by around two years following the assessment date the ratio has reduced to around the level it was at two years prior to the assessment date.
This contrasts with the repeat EHC ratio, which remains above the ratio value immediately prior to the peak, for the remainder of the period.
Figure 8.4: Number of SDMD assessments per month (relative to assessment date) for people with one homelessness assessment divided by the number of those people present in the study at that time for each cohort by sex.
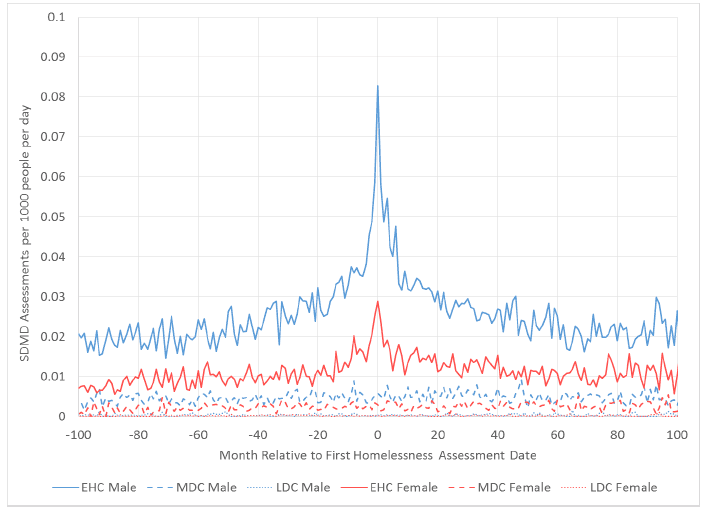
Figure 8.5: Number of SDMD assessments per month (relative to assessment date) for people with repeat homelessness assessments divided by the number of those people present in the study at that time for each cohort by sex.
8.5 Summary
The EHC have many more SDMD assessments than the control cohorts (10 times more than MDC, 100 times more than LDC). This is true for each age and sex breakdown. The age profile of number of SDMD assessments by age is similar between the EHC, MDC, and LDC. More of the EHC have at least one SDMD assessment, and among those who do have assessments, the EHC have a greater number of multiple SDMD assessments.
The majority of SDMD cases among the cohorts had heroin as the main illicit drug. The ratios of the EHC to the controls for crack cocaine, methadone , diazepam, and cannabis are also particularly high.
It is clear that there is evidence to support each of the four research questions:
- A gradually worsening condition prior to the date of first assessment that results in excess SDMD assessments, prior to homelessness occurring. The SDMD assessment rate increases up to the peak for both Once-only and Repeat EHC, yet occurs earlier for Repeat EHC.
- For some people the (first) homelessness episode is associated with some crisis with a health activity component, as observed by an SDMD assessment peak around that time for both Once-only and Repeat EHC.
- The larger ratios after the first assessment date for those who have multiple homelessness episodes could be due to: further crises around the time of those later episodes, or long-term effects of the earlier underlying worsening situation, crises or homelessness itself.
- Lastly, people who go on to become homeless appear to have more SDMD assessments, even several years prior to their first homeless assessment.
Contact
There is a problem
Thanks for your feedback