Homelessness in Scotland: update to 30 September 2021
This statistics bulletin provides information on homelessness in Scotland in the 6 month period from 1 April 2021 to 30 September 2021, alongside historical data.
The Extent of Homelessness in Scotland
Key Points
Compared to the same periods in 2020, there were:
Increases in homelessness applications and households assessed as homeless.
These are still lower than pre-pandemic.
- 17,447 applications (+2%)
- 14,161 assessed as homeless (+3%)
Decreases in open homelessness cases and households in temporary accommodation
- 26,001 open cases (-4%)
- 13,192 in temporary accommodation (-7%)
Applications, assessments and households in temporary accommodation
| Apr -Sep | Change | |||
|---|---|---|---|---|
| 2020 | 2021 | Number | Percentage | |
| Applications | 17,169 | 17,447 | 278 | 2% |
| Assessed as homeless | 13,813 | 14,161 | 348 | 3% |
| Open cases as at 30 September | 27,036 | 26,001 | -1,035 | -4% |
| Households in temporary accommodation as at 30 September | 14,151 | 13,192 | -959 | -7% |
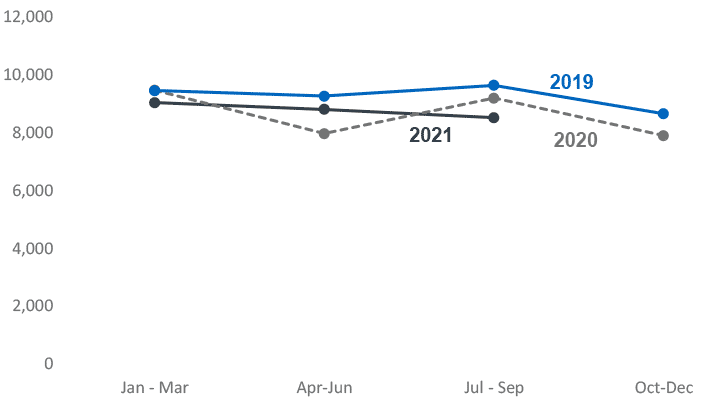
Over the 6 month period 1 April to 30 September 2021, there has been an increase in the number of homelessness applications and households assessed as homeless compared to 2020. However, these figures remain lower than they were pre-pandemic; this is demonstrated for applications in Chart 1.

Conversely, decreases have been experienced for open homelessness cases and households in temporary accommodation. There has been a notable increase in the number of homelessness cases closed over this period compared to 2020 which can help explain these decreases. The increase in closed cases may be due to COVID-19 restrictions being lifted, meaning there was increased capacity for households to be moved into settled accommodation.
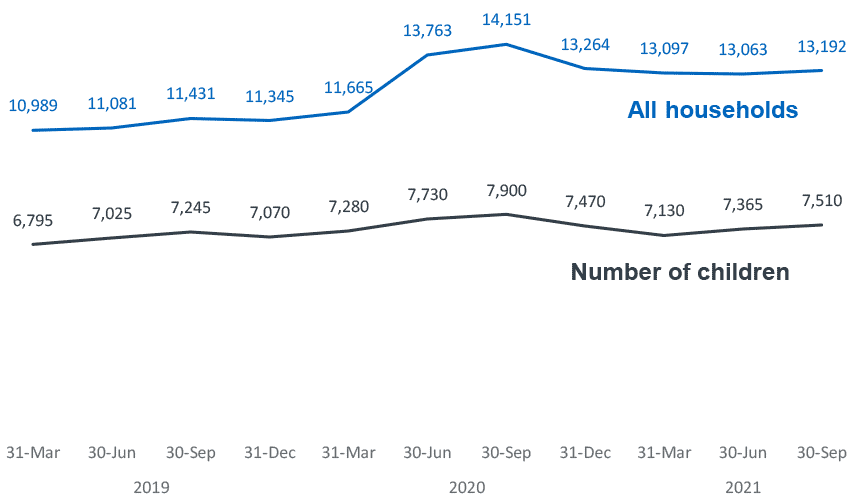
Following the onset of the pandemic, the number of open homelessness cases reached a peak of 27,036 in September 2020. After two quarters of decline (to 24,835 in March 2021), the last two quarters have seen an increase in open cases again (to 26,001 in September 2021).
As seen in Chart 2, households in temporary accommodation also reached a peak in September 2020 and had been declining until recently. There was an increase in the last quarter for the number of households in temporary accommodation and increases in the last two quarters for households with children and the number of children in temporary accommodation.

Intentionality
In the 6 month period, 14,161 (82%) applications assessed were found to be homeless or threatened with homelessness, an increase of 348 (3%) compared to 2020. Of all 17,372 assessments, 13,989 (81%) were assessed as unintentionally homeless and 172 (1%) were assessed as intentionally homeless. The small proportions of, and continued numerical decrease in, those assessed as intentionally homeless are due to the changes in legislation from November 2019 which give local authorities the power to assess for intentionality, rather than it being a legal duty to do so.
Local authority differences
Edinburgh has experienced a notable decline in the number of homelessness applications – a decrease of 518 (39%) from 1,327 to 809 in the 6 month period between 2020 and 2021. Similar decreases were experienced for those assessed as homeless (a reduction of 433, 36%) meaning Edinburgh now accounts for only 6% of all households assessed as homeless compared to 9% in 2020. This drop may be due to Edinburgh’s large private rented sector coupled with still lower than pre-pandemic eviction rates, despite eviction bans being lifted. This combined with the increased efforts of Edinburgh’s homelessness prevention team are believed to have prevented 180 households being evicted from the private rented sector in this period.
West Lothian was the local authority with the next biggest numerical decrease of 97 (13%) from 743 to 646 homelessness applications.
Glasgow, on the other hand, has seen an increase of 824 (28%) from 2,917 to 3,741 in the 6 month period and now accounts for 21% of homelessness applications compared to 17% in 2020. This is partly due to the increased number of applications from refugees who have been granted ‘Leave to Remain’ status. To note: over the 6 month period covered by these statistics, Glasgow was the only Scottish local authority the Home Office directed asylum seekers to while their claim was being processed.
West Dunbartonshire and North Ayrshire experienced the next largest numerical increases in applications (increases of 115, 22% and 96, 20% respectively).
Glasgow has a particularly high increase in the number of closed cases, 1,175 (167%) from 705 to 1,880, noting this is due to increased efforts, in co-operation with Housing Associations, to secure an increased number of settled lets. This is reflected in the increase in the proportion securing a Housing Association property as an outcome.
West Lothian has the largest numerical increase (+92) in households in temporary accommodation while Glasgow has the largest numerical decrease (-250), although their latest figure was an increase on the previous quarter. Edinburgh (-143), Highland (-137), Aberdeen City (-110) and Aberdeenshire (-95) also have large numerical decreases.
Contact
There is a problem
Thanks for your feedback