Housing statistics 2019: key trends summary
Annual statistics up to 31 March 2018 on total new housing supply in Scotland across all sectors, along with information on various elements of local authority housing such as stock, lettings, house sales, evictions, housing lists, and housing for older people and people with disabilities.
Housing Lists
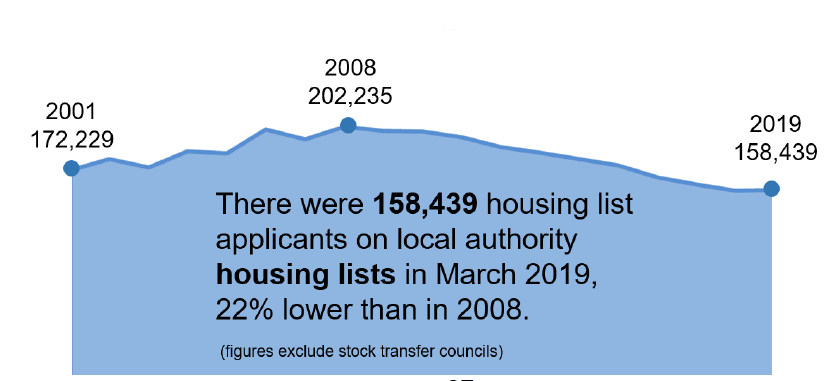
At 31 st March 2019, 158,439 applications were recorded on local authority or common housing register housing lists, a 0.4% increase, or 633 more households than 2018, the first increase since 2008, although the latest figure is 22% below the 202,235 applications recorded in 2008.
Chart 18: Number of housing list applicants

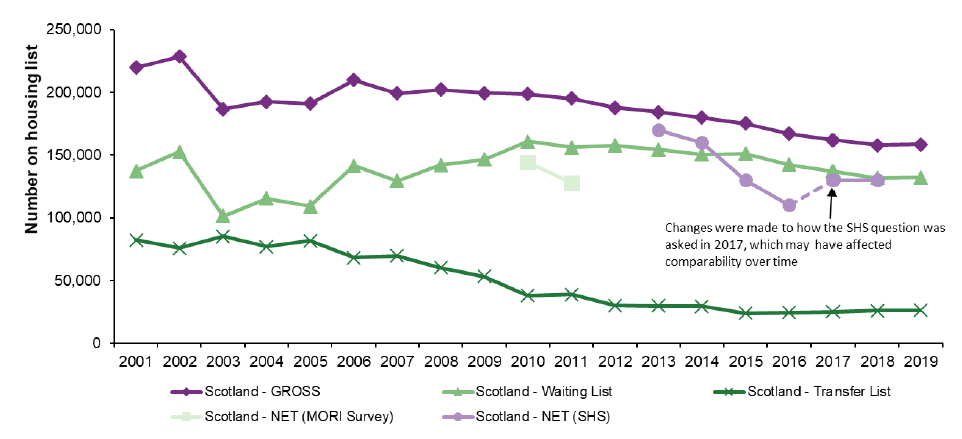
Of the 158,439 households on local authority or common housing register lists, 26,400 were recorded as being on transfer lists and 132,000 on waiting lists for entry into social housing.
However, 7 out of the 26 local authorities with housing stock did not operate separate waiting and transfer lists. In this report, all of the households on the lists of these authorities are treated as being on the waiting lists and none on the transfer list. This means that the waiting list figure is over-estimated and the transfer list figure is under-estimated. Also, the separate reporting of waiting and transfer lists by local authorities has changed over time, which means the historic trends are not consistent or reliable. This contributes to the trends illustrated in Chart 19. The chart shows large increases in the number of people on waiting lists until 2010 and large decreases in transfer lists until 2012, whilst the overall total remains more constant, although has fallen in recent years.
Chart 19: At 31st March 2019, 158,439 applications were recorded on local authority or common housing register housing lists, a 0.4% increase, or 633 more households than 2018

While numbers of applications may be recorded accurately within each authority, there is difficulty in recording actual numbers of people wishing to access all social housing and also in determining their current tenure. In addition to the multiple-counting of people who apply to more than one local authority, households often apply for both council and RSL housing in their desired area (although this has become less of an issue over time due to the increase in the number of Common Housing Registers). Some applicants may no longer need a social house if, for example, they take up tenancies with other housing providers, however they may not be removed from the housing list immediately. Chart 19 shows, alongside the figures collected for this publication, survey estimates from the Scottish Household Survey (SHS) and MORI.
The SHS and MORI estimates are population based, which means they cover all housing lists in Scotland, whereas those related to Local Authority and Common Housing Registers do not include the 6 local authorities (including Glasgow) which have transferred all of their housing stock to Registered Social Landlords. In addition, the MORI and SHS estimates asked respondents whether they were on any housing lists, so they are not affected by the double counting issue. The SHS and MORI results may therefore provide a more realistic estimate of applicants on housing lists in Scotland although they are based on sample surveys of private residential properties and so may exclude some people living in communal establishments or in particular types of temporary accommodation.
A question about being on a housing list was introduced to the SHS in 2013 and these questions are asked of the random adult. However, note that changes were made to the 2017 questions with the aim to better capture households who are using choice based lettings when seeking social housing. These may affect comparisons over time, and therefore some caution should be used when comparing the 2017 and 2018 results to earlier years. Results for 2018 show that an estimated 130,000 (5 per cent) of households were on a housing list, with a further 10,000 households estimated to have applied for social housing using a choice based letting system or similar in the last year, which are similar figures to the previous year 2017.
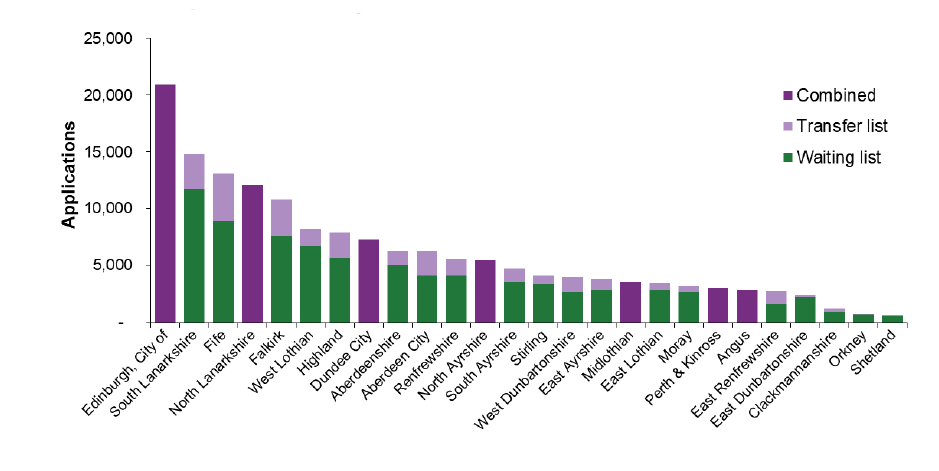
Chart 20 shows housing list applicants at 31st March 2019 broken down by local authority.
Chart 20: The number of applicants on waiting lists and transfer lists varied in each local authority, but the majority of local authorities had a lower number of applicants on the transfer list

Link to tables on housing lists: http://www.scotland.gov.uk/Topics/Statistics/Browse/Housing-Regeneration/HSfS/StockManagement
The Scottish Household Survey has asked a question since 2013 on whether the random adult interviewed is on a housing list. Scotland and local authority estimates are published in SHS Annual Reports: http://www.gov.scot/Topics/Statistics/16002/PublicationAnnual
Official statistics obtained from an Omnibus Survey carried out in February 2011 estimate the number of households which contain someone who is currently on a social housing list. These statistics provide an estimate which eliminates the double counting included in the administrative data collected annually from councils and housing associations. The excel tables can be accessed through the following link: http://www.scotland.gov.uk/Topics/Statistics/Browse/Housing-Regeneration/HSfS/HousingListSurvey
Contact
Email: lyndsey.middleton@gov.scot
There is a problem
Thanks for your feedback