Housing statistics 2019: key trends summary
Annual statistics up to 31 March 2018 on total new housing supply in Scotland across all sectors, along with information on various elements of local authority housing such as stock, lettings, house sales, evictions, housing lists, and housing for older people and people with disabilities.
New Housing Supply
22,273 new houses were built, refurbished or converted in 2018-19, 2,953 homes (15%) more than in 2017-18. New housing supply remains below pre-recession levels and is 19% below the 2007-08 figure of 27,594, however annual supply has increased by 7,333 homes (49%) since 2012-13.
New housing supply comprises the following elements:
- new house building: houses completed by or for housing associations, local authorities or private developers for market sale, below market rent or low cost home ownership;
- rehabilitation: houses acquired by housing associations and refurbished either for rent or low cost home ownership. Refurbishment of private dwellings funded wholly or partly through the Affordable Housing Supply Programme (AHSP); and
- conversion: net new dwellings created by conversion from non-housing to housing use or by alterations to existing dwellings in all tenures.
The supply of new housing increased by 2,953 homes (15%) between 2017-18 and 2018-19. There were 4,169 housing association new build completions in 2018-19, an increase of 1,041 homes or 33% on the previous year. Local authority new build completions totalled 1,413 homes, a decrease of 51 homes (3%) compared with 2017-18. A total of 15,710 homes were built by the private sector in 2018-19, an increase of 2,679 homes (21%) from the 13,031 homes built in 2017-18. The number of rehabilitations decreased from 958 in 2017-18 to 316 in 2018-19, and the number of buildings converted to housing use decreased by 74 homes from 739 to 655. See Table 1 below and Chart 1 (page1).
Table 1: Components of new housing supply in Scotland
| Private new build | Housing association new build | Local authority new builds | Rehabilitation | Net conversion | Total housing supply | |
|---|---|---|---|---|---|---|
| 1996-97 | 17,492 | 2,963 | 241 | 984 | 1,244 | 22,924 |
| 1997-98 | 17,984 | 4,489 | 114 | 1,514 | 958 | 25,059 |
| 1998-99 | 18,784 | 1,753 | 120 | 380 | 958 | 21,995 |
| 1999-00 | 19,074 | 3,964 | 69 | 413 | 1,151 | 24,671 |
| 2000-01 | 18,195 | 3,804 | 112 | 971 | 1,103 | 24,185 |
| 2001-02 | 18,309 | 4,197 | 65 | 597 | 1,311 | 24,479 |
| 2002-03 | 18,938 | 3,715 | 94 | 514 | 1,305 | 24,566 |
| 2003-04 | 20,456 | 3,368 | 0 | 410 | 1,409 | 25,643 |
| 2004-05 | 22,449 | 4,024 | 0 | 677 | 1,336 | 28,486 |
| 2005-06 | 20,260 | 4,698 | 0 | 469 | 1,695 | 27,122 |
| 2006-07 | 21,042 | 3,231 | 6 | 437 | 1,702 | 26,418 |
| 2007-08 | 21,663 | 4,097 | 28 | 389 | 1,417 | 27,594 |
| 2008-09 | 16,109 | 4,577 | 336 | 427 | 923 | 22,372 |
| 2009-10 | 11,139 | 5,576 | 413 | 442 | 920 | 18,490 |
| 2010-11 | 10,720 | 5,111 | 614 | 297 | 591 | 17,333 |
| 2011-12 | 10,145 | 4,776 | 1,114 | 338 | 644 | 17,017 |
| 2012-13 | 9,892 | 3,244 | 963 | 291 | 550 | 14,940 |
| 2013-14 | 11,088 | 2,911 | 1,140 | 711 | 509 | 16,359 |
| 2014-15 | 12,546 | 3,064 | 1,157 | 224 | 644 | 17,635 |
| 2015-16 | 13,432 | 2,320 | 1,138 | 457 | 684 | 18,031 |
| 2016-17 | 13,427 | 2,748 | 1,118 | 599 | 791 | 18,683 |
| 2017-18 | 13,102 | 3,130 | 1,499 | 958 | 739 | 19,428 |
| 2018-19 | 15,710 | 4,169 | 1,413 | 316 | 665 | 22,273 |
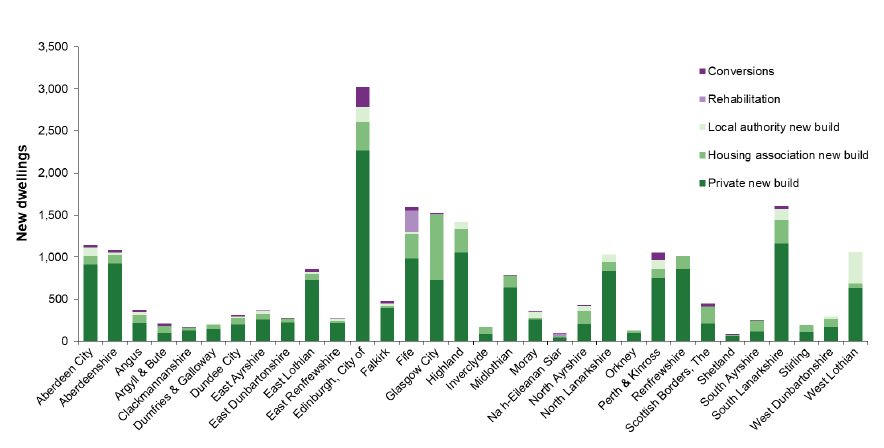
The components of housing supply within each local authority area for 2018-19 are shown in Chart 2. Together Edinburgh, Glasgow, Fife, Highland and South Lanarkshire accounted for 41% of Scotland’s new housing supply.
The proportions of housing supply accounted for by each grouping vary by local authority. For example, in Glasgow 51% of the new supply was housing association homes, 1% of supply related to conversions, and 48% from private led construction. The majority (75%) of the new supply in Edinburgh was from private sector new build with a further 11% from housing association new build and 6% from local authority new build. Private sector new build accounted for 83% of Falkirk’s new housing supply. West Lothian (35%) had the highest proportions of their new supply as local authority new build housing.
Chart 2: Edinburgh, Glasgow, Fife, Highland and South Lanarkshire accounted for 41% of Scotland's new housing supply

Link to Housing Supply tables: http://www.scotland.gov.uk/Topics/Statistics/Browse/Housing-Regeneration/HSfS/NewHousingSupply
Contact
Email: lyndsey.middleton@gov.scot
There is a problem
Thanks for your feedback