Impacts of the sale of house coal and the most polluting manufactured solid fuels: report
We commissioned this evidence review to inform proposals for introducing a ban on the sale of house coal and high sulphur content manufactured solid fuels in Scotland.
3. Business and Regulatory Impact Assessment
This section presents the substantiative evidence to support the Business and Regulatory Impact Assessment (BRIA) of the different policy options considering the sectors and groups affected by each option.
First we present two steps in the BRIA process which define the scope of the analysis and develop important inputs to the subsequent economic analysis, namely:
- Screening of impacts and affected groups
- Air quality modelling to support distributional impact analysis
The section then presents the outputs of the economic analysis, separated into sub-sections concerning different impacts and components of the BRIA:
- Assessment of costs and benefits
3.1 Summary of findings
A high level summary of findings of the BRIA is shown in Table 3‑1.
| Impact |
Policy Option 2 (Information campaign) |
Policy Option 3 (Coal ban and sulphur limit) |
Policy Option 2 (With fuel price sensitivity) |
Policy Option 3 (With fuel price sensitivity) |
|---|---|---|---|---|
| Air quality |
-3,223 kg There was a higher reduction in urban areas than rural, as there is higher use of wet wood in urban areas. The maximum reduction of 0.0013 µg m-3 for Option 2 was in Aberdeen; this reduction is 0.02% of total PM2.5 concentrations and 0.3% of modelled domestic combustion concentrations in this location |
-75,456 kg PM2.5 The highest reductions were in rural areas, where there is a higher prevalence of house coal use. The maximum reduction of 0.020 µg m-3 for Option 3 was in Fort William; this reduction is 0.5% of total PM2.5 concentrations and 15% of modelled domestic combustion in this location |
-3,223 kg PM2.5 There was a higher reduction in urban areas than rural, as there is higher use of wet wood in urban areas. The maximum reduction of 0.0013 µg m-3 for Option 2 was in Aberdeen; this reduction is 0.02% of total PM2.5 concentrations and 0.3% of modelled domestic combustion concentrations in this location |
-75,456 kg PM2.5 The highest reductions were in rural areas, where there is a higher prevalence of house coal use. The maximum reduction of 0.020 µg m-3 for Option 3 was in Fort William; this reduction is 0.5% of total PM2.5 concentrations and 15% of modelled domestic combustion in this location |
| Health impacts |
-£380,000 Health impacts include reduction in incidence of a range of pathways including chronic mortality, hospital admissions, and various morbidities. Benefits are lower in policy option 2 due to smaller improvements in PM2.5 |
-£1,830,000 Health impacts include reduction in incidence of a range of pathways including chronic mortality, hospital admissions, and various morbidities. Benefits are higher in policy option 3 due to larger improvements in PM2.5 |
| Greenhouse gas emissions |
-£13,000 Impacts in greenhouse gas emissions driven largely by improvements in fuel efficiency of alternative fuels (Dry wood and manufactured fuels) Benefits are lower in policy option 2 due to relatively low fuel switching from the information campaign. |
-£1,270,000 Impacts in greenhouse gas emissions driven largely by improvements in fuel efficiency of alternative fuels (Manufactured fuels) Benefits are higher in policy option 2 due to the large switch from coal to manufactured solid fuels. |
| Fuel costs |
£263,000 Increase in fuel costs driven by higher price of alternative fuels (When using fuel cost data based on the 2019 Defra impact assessment), outweighing benefits in fuel efficiency. |
£8,020,000 Increase in fuel costs driven by higher price of manufactured solid fuels compared with coal (When using fuel cost data based on the 2019 Defra impact assessment), outweighing benefits in fuel efficiency. |
£142,000 Increase in fuel costs driven by higher price dry wood compared with wet wood. |
-£4,120,000 Reduction in fuel costs driven by improved fuel efficiency of manufactured fuels compared with coal (When using fuel cost data based on stakeholder interviews). |
| Implementation costs |
£64,800 Implementation costs for the information campaign based on data from the 2019 Defra impact assessment. |
£96,400 Implementation costs for local authorities for the coal ban based on data from the 2019 Defra impact assessment. |
£64,800 Implementation costs for the information campaign based on data from the 2019 Defra impact assessment. |
£96,400 Implementation costs for local authorities for the coal ban based on data from the 2019 Defra impact assessment. |
| Impacts on businesses |
impacts on businesses are expected to be small. Suppliers already sell alternative fuels and there is no difference in profit margins between banned and alternative fuels. |
|||
| Summary |
-£65,200 |
£5,016,400 |
-£186,200 |
-£7,123,600 |
3.2 Screening of impacts and affected groups
Analysis was completed to characterise who currently uses solid fuels, in particular those to be regulated, in Scotland to assess which groups are likely to be affected the most.
3.2.1 Screening of impacts
The following impacts were screened in for the assessment based on the Scottish BRIA guidance:
- Valuation of health impacts from reduced exposure to air pollution the primary focus of the legislation, to reduce emissions of particulates and associated negative impacts on human health from burning of solid fuels domestically
- Fuel cost impacts driven by the swap from the more polluting fuels to alternative fuels either voluntarily due to the information campaign or due to the ban and sulphur limit. Different fuels have different prices per tonne but also different energy efficiencies which drives changes in costs.
- Greenhouse gas impacts driven largely by the difference in energy efficiency between fuels.
- Implementation costs of the policy for public authorities.
- Distributional impacts considering impacts on different sectors and groups, such as rural or urban populations, or households within different deciles of deprivation.
- Impacts on Scottish firms resulting from the shift in fuels, such as change in costs and change in profitability.
- Impacts on competitiveness resulting from the policy options leading to unfair advantages or disadvantages for certain businesses.
- Impacts on consumers driven by changes in fuel prices or availability.
- Impacts on International trade from changes to international supply chains driven by the policy options.
Note: Digital impacts have been screened out as not being relevant for these policy options.
3.2.2 Rural/urban
The Home Analytics dataset included the Scottish Government's eight-fold urban/rural classifications[19] for each property.
Table 3‑2 and Figure 3‑1 contains the breakdown of households using solid fuels as the main and secondary fuel sources within each of the eight urban/rural classes. 79% of households using solid fuel as the main fuel type are in rural classes (between six – eight). For all classes, considerably more households use solid fuels as a secondary fuel than as the main fuel, including in urban areas.
As only 21.1 thousand households use solid fuels as a main fuel type out of 2.8 million households (0.8%) included in the Home Analytics dataset, a small proportion of households would be highly affected by the proposed changes. 78% of the households with solid fuels as a main fuel type either use solid fuels as a secondary fuel type (7,020 households) or have no secondary heating system (9,526 households); these households would be most impacted by proposed changes.
Overall, households in rural areas are expected to be more affected by changes in regulations than those living in urban areas, as there is a higher use of solid fuels, particularly as the main fuel. For most households using solid fuels, impacts of the proposed changes would be limited, as most households use them as a secondary fuel. Additionally, a small number of households will be affected in a greater way due to using solid fuels as their primary fuel, while a far greater number will be affected in a smaller way due to using them as a secondary heat source.
| Classification |
Main fuel |
% of main solid fuel houses |
Secondary fuel |
% of secondary solid fuel houses |
|---|---|---|---|---|
| 1 - Large Urban Area |
811 |
4% |
13,783 |
9% |
| 2 - Other Urban Area |
1,279 |
6% |
14,770 |
10% |
| 3 - Accessible Small Town |
736 |
3% |
8,336 |
5% |
| 4 - Remote Small Town |
269 |
1% |
4,300 |
3% |
| 5 - Very Remote Small Town |
1,134 |
5% |
3,552 |
2% |
| 6 - Accessible Rural |
6,836 |
32% |
52,488 |
34% |
| 7 - Remote Rural |
3,473 |
16% |
25,960 |
17% |
| 8 - Very Remote Rural |
6,588 |
31% |
32,217 |
21% |
| Total |
21,126 |
155,406 |

3.2.3 Location
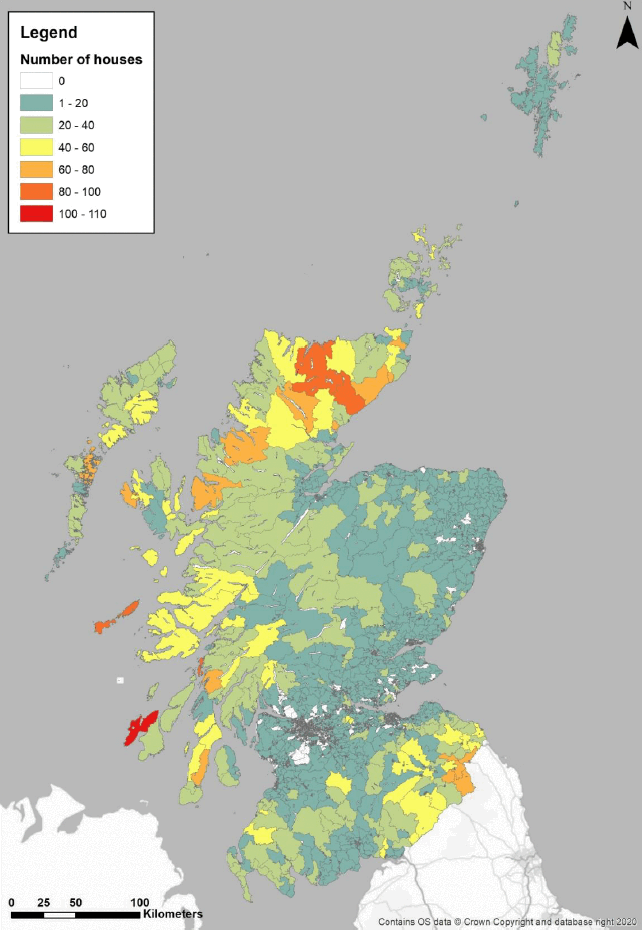
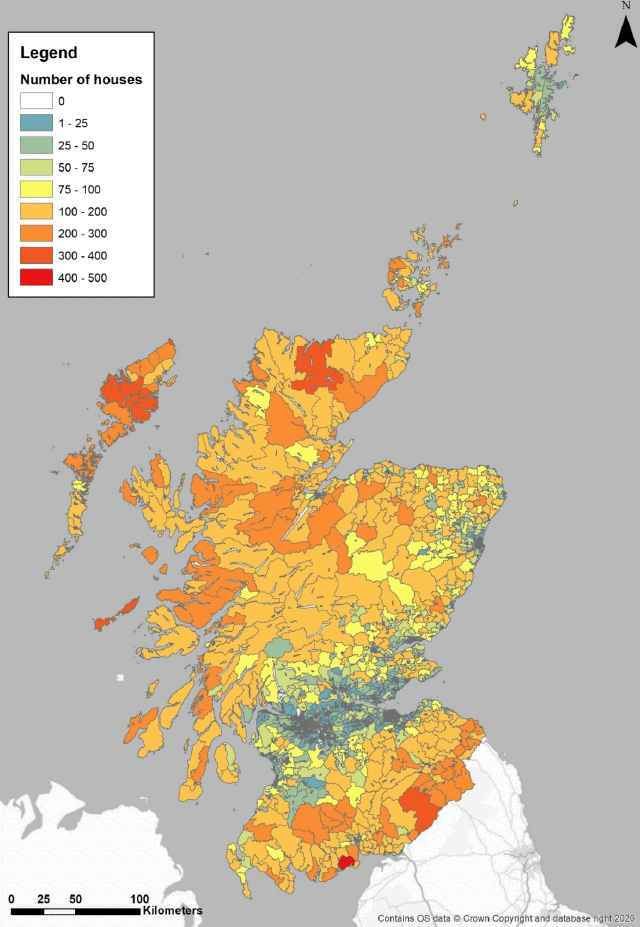
Figure 3‑2 and Figure 3‑3 show the numbers of households using solid fuels (in the Home Analytics dataset) as the main and secondary fuel sources within each Lower Layer Super Output Area (LSOA).[20] LSOAs are spatial groupings of 2011 Census Output Areas that distribute population size consistently and enable population based analysis. LSOAs have smaller areas in urban locations than in rural since they represent consistent population sizes.
There are larger numbers of households using solid fuels in remote, rural areas, e.g., in the Highlands and Islands, for both main and secondary solid fuel use compared to urban areas. There are also more households using solid fuels as a secondary fuel type than as a primary fuel type in both rural and urban areas.
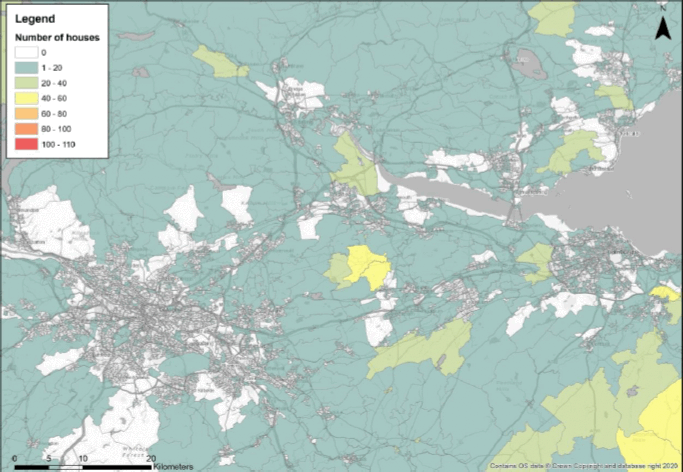
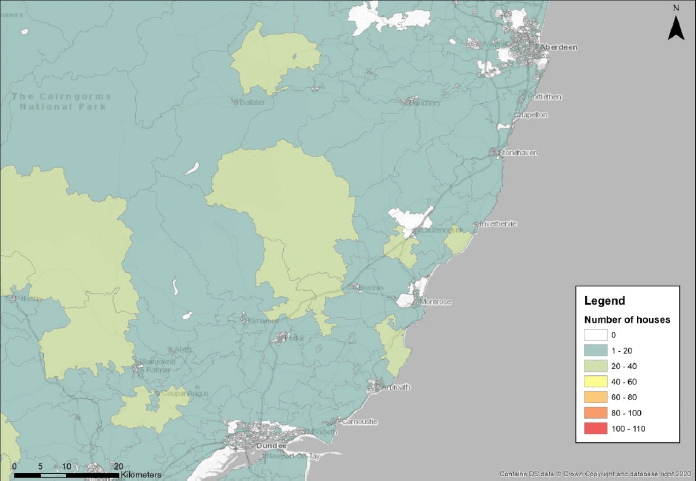
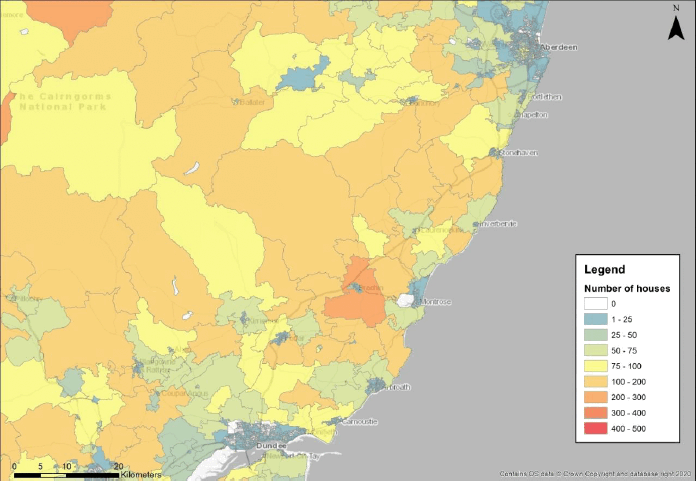
In urban areas, there is limited use of solid fuels as a primary fuel type; in many LSOAs in urban areas, solid fuels are only used as a secondary fuel type. Figure 3‑4 shows the number of houses using primary and secondary fuels in LSOAs in the central belt, which includes Glasgow and Edinburgh, and Figure 3‑5 shows urban areas on the east coast, including Aberdeen and Dundee. Urban areas such as Glasgow, Edinburgh and Dundee are in Smoke Control Areas, but Aberdeen is not.[21] There are LSOAs in Aberdeen with higher counts of households using solid fuels as a secondary fuel type than in Glasgow, Edinburgh and Dundee.

3.2.4 Demographic analysis
The Home Analytics dataset also includes the overall Scottish Index of Multiple Deprivation (SIMD) decile[22] of each property. Figure 3‑6 and Table 3‑3 contain the breakdown of households using solid fuels as main and secondary fuels by SIMD decile, where one is the most deprived and ten is the least deprived. The distribution of SIMD rank by overall population size is that 10% of the total population of Scotland falls within each of the decile groups. Thus, the distribution of solid fuel use across decile groups does not reflect the overall population distribution.
Most solid fuel users are in mid-range deciles between four and eight, with greater proportions of the population of solid fuel users in these deciles than in the population as a whole (Where population is spread evenly i.e. 10% per decile). Secondary solid fuel use is more prevalent in mid to least deprived deciles between four and ten, than in the most deprived groups.
Overall, changes in solid fuel regulations are expected to affect the mid to least deprived groups and have a limited effect on the most deprived groups.
| SIMD Decile* |
Main fuel |
% of main solid fuel houses |
Secondary fuel |
% of secondary solid fuel houses |
|---|---|---|---|---|
| One |
410 |
2% |
1,026 |
1% |
| Two |
674 |
3% |
2,342 |
2% |
| Three |
1,159 |
5% |
4,302 |
3% |
| Four |
2,498 |
12% |
10,934 |
7% |
| Five |
4,192 |
20% |
24,906 |
16% |
| Six |
5,450 |
26% |
35,971 |
23% |
| Seven |
4,006 |
19% |
31,965 |
21% |
| Eight |
1,834 |
9% |
21,724 |
14% |
| Nine |
547 |
3% |
11,252 |
7% |
| Ten |
356 |
2% |
10,984 |
7% |
| Total |
21,126 |
155,406 |
Note: * one is the most deprived and ten is the least deprived

Other demographic information (e.g., age, sex) was not available in the Home Analytics dataset, nor were the 2022 Census results. However, the impact of the proposed regulations on air quality has been assessed in Section 3.5.2 for sensitive age groups (i.e., children under 16 and elderly over 65), in addition to SIMD-Income.
3.3 Air Quality Assessment
Any policies targeting emissions will have a knock-on impact on air quality. The impacts on air quality can be assessed using the impact pathway or damage costs depending on the availability of concentration or emissions estimates respectively. The damage costs are quicker to apply as they are less resource and data intensive than impact pathway assessments. However, damage costs are unable to reflect the full granularity of exposures, including assessment in specific spatial areas, and as a result the outcome from a damage cost assessment can be sensitive to the method and costs adopted.
Given the sector and options being assessed we anticipate that human exposure and health may be a significant factor to consider in the assessment of the scenarios. Specifically, as shown in the assessment of who is affected (Section 3.1), solid fuel use is greater in rural areas where less people live, hence exposure to the air pollution produced is lower. The rural areas of Scotland are also less densely populated, for example, therefore the selection and use of (for example) the 'national average' damage costs (or even the 'rural' damage cost) may lead to a less robust picture of exposure and impacts of the scenarios in Scotland.
For this study, we have followed the more robust impact pathway approach. By modelling air quality concentrations, rather than simply a change in emissions, a more robust understanding of the air quality impacts in Scotland can be produced, including spatial impacts of any changes as a result of the scenarios. This means the assessment of the costs and benefits of the scenarios can be assessed specifically for Scotland, taking into consideration local conditions.
3.3.1 Scenario modelling
The scenarios modelled were:
- Option 1: Take no action (baseline)- this is a 'do nothing' counterfactual against which the other options are assessed, and assumes no further change in policy that impacts on the consumption of the fuels in scope. This baseline scenario uses the emissions calculated directly from the input data.
- Option 2: Voluntary Approach- Involves an information campaign informing the public on the health impacts of solid fuel use in homes. This scenario assumes that 1% of house coal and 1% of wet wood (moisture content > 20%, applicable to wood logs) were changed to low-sulphur Manufactured Solid Fuel (MSF) and seasoned wood, respectively. This assumption matches Defra's Impact Assessment in England.
- Option 3: Regulating the sale, distribution and marketing of fuels- A ban of the sale of bituminous (or 'house') coal and high sulphur (>2% sulphur) smokeless fuels with 100% compliance. Wet wood is not included in the ban, so emissions from wood match Option 1 (baseline).
3.3.2 Emissions calculations
The results presented in Annex B of the Defra Solid Fuel Burning Survey9 contained total quantities (kilotonnes) of wood and coal burned in Scotland in 2019; statistics included splits between urban and rural fuel use, the proportion of coal that was house coal, and the proportion of wood logs that was wet wood. Understanding the proportions of house coal and wet wood was required to derive more accurate Option 1 (baseline) emissions, and for modelling changes in fuel use (i.e., for coal and wood in Option 2 and for coal in Option 3). As the total quantities were projected from surveys conducted in the Defra Solid Fuel Burning Survey, any uncertainty in the calculations of total quantities has been carried into the modelling.
Table 3‑4 includes the total amounts of coal and wood logs used as modelling input. Coal products included house coal, smokeless coal, and coal-like briquettes. Although data on other wood fuels such as wood pellets and chips were available in the survey, these fuel types would be unaffected in the scenario modelling, so the modelling input was restricted to wood logs to be able to compare the shift from wet to seasoned wood logs in the options modelling.
| Area |
Fuel type |
Total fuel 2019 (kt) |
Quantity of wet wood or house coal (kt) |
Percent wet wood or house coal |
|---|---|---|---|---|
| Urban |
Wood |
45.4 |
12.8 |
28% |
| Rural |
Wood |
52.4 |
10.9 |
21% |
| Urban |
Coal |
2.3 |
0.3 |
11% |
| Rural |
Coal |
19.1 |
11.5 |
60% |
Total emissions by fuel type were calculated for urban and rural areas. The total quantities of solid fuel were converted to net energy using DUKES calorific values12 - note that the calorific value for wet wood was provided in Annex A of the Defra Solid Fuel Burning Survey9. The moisture content of seasoned wood is assumed to be 20% to match DUKES/NAEI data, and the moisture content of wet wood is assumed to be 30% to match the Defra Solid Fuel Burning Survey.
Total PM2.5 emissions were calculated from net energy using NAEI emission factors for each fuel type. For the wet wood emission factor, a ratio of average wet : seasoned wood emission factors was derived from a study by Price-Allison et al. (2021)[23]; this ratio of 2.93 was applied to the NAEI wood emission factor to calculate an emission factor for wet wood. The calorific values and emission factors used in this study are provided in Table 3‑5.
Note that different emission factors for low or high sulphur manufactured solid fuel (MSF) are not available in the NAEI, so it has not been possible to calculate PM2.5 emissions or model a change from high to low sulphur MSF. Hence our analysis of air pollution emissions and subsequent concentration changes captures only the impacts associated with the shifts away from coal and wet wood to low-sulphur (assumed) MSF and seasoned wood, respectively, and omits the impacts of the shift in consumption from high to low sulphur manufactured fuels. The largest effects on emissions are expected to be seen from the ban on house coal, as for example, 60% of coal burned in rural areas is house coal.
| Fuel type |
Calorific values (GJ/t net) |
PM2.5 emission factors (kt/TJ net) |
|---|---|---|
| House coal |
25.14 |
0.00032 |
| Manufactured Solid Fuel |
28.11 |
0.000057 |
| Seasoned wood |
14.71 |
0.00047 |
| Wet wood |
12.57 |
0.00138 |
3.3.3 Spatial distribution of emissions
The total emissions by fuel type in urban and rural areas have been scaled spatially using the data from Home Analytics, which contains the location, urban/rural classification, and primary and secondary fuel types of each house. The Home Analytics data were filtered to include only the properties using the "Solid" fuel type as the main or secondary fuel. The "Solid" fuel type includes house coal, smokeless solid fuels, and wood logs. A separate "Biomass" fuel type was excluded from the analysis, as it includes other fuel types such as waste and biogas that are not included in the scope of the policy option being considered.
Home Analytics includes a property's 8-fold urban/rural classification19. This classification was simplified to a two-category urban/rural classification as emissions were calculated at the urban and rural level from the Defra Solid Fuel Burning Survey. The urban classes 1 and 2 with settlements of over 10,000 people comprised the urban category, and classes 3 to 8 with settlements of less than 10,000 people were considered rural. This categorisation matches the urban/rural classification used in the Defra Solid Fuel Burning Survey, which applies the ONS definition of urban/rural.[24]
The number of households using solid fuels by urban/rural classification was used to distribute the total PM2.5 emissions spatially across Scotland in a 1 km2 emissions grid. The number of households using solid fuels as a primary fuel type was added to 10% of the houses using solid fuels as a secondary fuel type; this weighting reflects the estimate that a secondary fuel would provide 10% of the heat in a property.[25] Remote towns such as Fort William and Kirkwall have the highest weighted counts per 1 km2 as many households use solid fuel as the main fuel (see Appendix 3 for maps of weighted house counts).
The sum of urban and rural properties within a square kilometre grid cell was used to calculate the proportion of each grid cell's contribution to the total numbers of households using solid fuels in urban and rural areas. This proportion was used to allocate the total PM2.5 emissions for wood and coal in urban and rural areas across the emissions grid.
The same grid cell proportions were used to allocate the emissions of wood and coal sub-types (i.e., seasoned wood, wet wood, house coal, and MSF). Although there is uncertainty in this assumption, as for example there could be more houses burning house coal in certain rural areas than in others, this level of detail is not available in any of the data sources reviewed.
3.3.4 PM2.5 concentration modelling - methodology
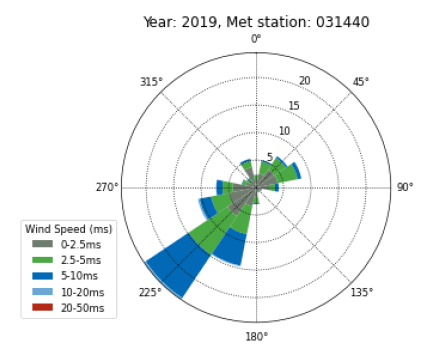
The calculation of PM2.5 concentrations from domestic sources was calculated from this emission grids using a convolution kernel in Ricardo's RapidAir model.[26] Dispersion parameters specific to domestic heating, adapted from national PCM modelling[27] (see Table 3‑6 for dispersion parameters and Figure 3‑7 for the diurnal profile), were used to create a dispersion kernel to model the concentrations from domestic sources at a resolution of 1 km2. Meteorological data for 2019 were processed from the Strathallan weather station, as this site is centrally located in Perthshire and considered suitable for modelling across Scotland. A wind rose showing the frequency of the wind speed and direction from which it originates is presented in Figure 3‑8; in 2019, there were predominantly south-westerly winds.
| Parameter |
Value |
|---|---|
| Release height (m) |
20 |
| Surface roughness |
0.5 |
| Receptor height (m) |
1.5 |
Figure 3‑7 Diurnal profile for domestic combustion estimated from Coleman et al. (2001)[28]
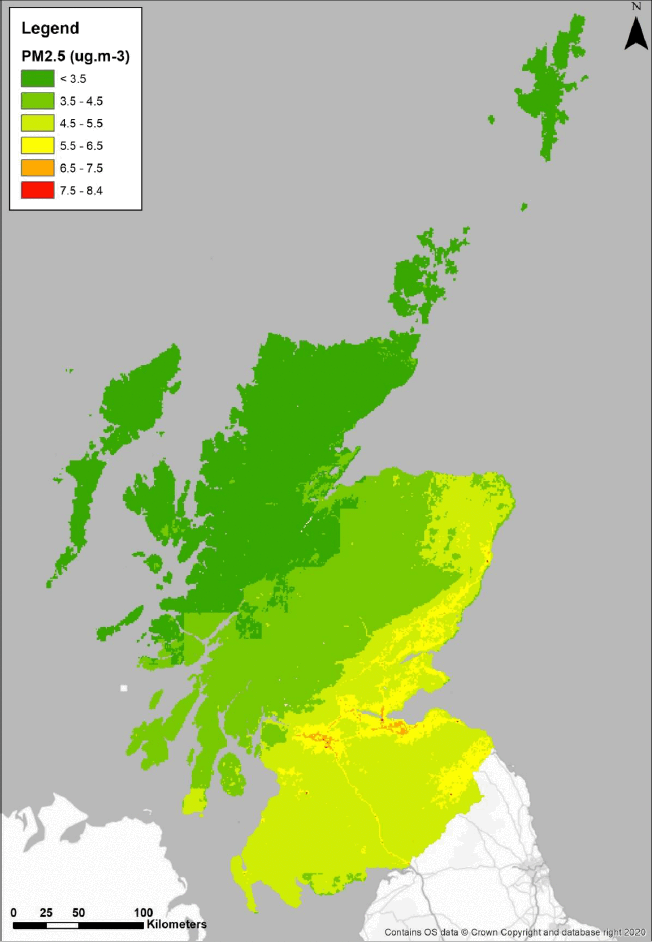
The total PM2.5 concentrations were derived by adding the outputs from the dispersion modelling to the PM2.5 background maps for Scotland in 2019 published by Defra.[29] Modelled baseline concentrations were subtracted from the domestic combustion sector of the background maps to ensure no double counting occurred. Figure 3‑9 contains a map of adjusted background concentrations. This is a similar approach adopted during a previous project undertaken for Scottish Government to assess particulate concentrations from wood-burning biomass boilers.[30]

3.3.5 Options modelling methodology
Assumptions agreed with the Scottish Government for Option 2 and Option 3 regarding the change in fuel use were used to calculate PM2.5 emissions:
- For Option 2 (a voluntary change): 1% of house coal (0.12 kt) and 1% of wet wood (0.24 kt) were changed to MSF and seasoned wood, respectively. The 1% change in quantities of fuel has been applied in the same way as in Defra's Impact Assessment in England.
- For Option 3 (the ban on house coal with 100% compliance), all coal was changed to MSF (0% house coal, or 11.7 kt). As wet wood is not included in the ban, emissions from wood matched the baseline.
The total quantities of solid fuel was retained as constant across the scenarios (i.e. between baseline and policy options). Although it is possible that there could be a small decrease in the quantities being burned in the scenarios because the less polluting fuel types have higher calorific values, this assumption could lead to PM2.5 concentrations being underestimated. However, this improvement in efficiency has been examined in the below economic analysis.
Updated emissions for each options scenario were calculated using the assumptions described in Section 3.3.1.
The updated emissions for each options scenario were run through the 2019 RapidAir dispersion model, and modelled PM2.5 concentrations were combined with the background concentrations.
3.3.6 Option 1 (Baseline) model results
Total Option 1 (baseline) emissions are presented in Table 3‑7. Although there are more households using solid fuels in rural areas than in urban, households in urban areas mainly use wood rather than coal, and PM2.5 emissions are higher for wood than for coal. There is also a higher proportion of wet wood being burned in urban areas than in rural areas (see Section 3.3.2).
Emissions from house coal are considerably higher than from MSF in rural areas. A ban on the sale of house coal would have a noticeable effect on emissions from house coal in rural areas.
| Location |
Fuel |
Type |
Total PM2.5 (g) |
% of total emissions |
|---|---|---|---|---|
| Urban |
Wood |
Seasoned |
225,185,625 |
21.8% |
| Urban |
Wood |
Wet |
222,189,943 |
21.5% |
| Urban |
Coal |
House |
2,029,425 |
0.2% |
| Urban |
Coal |
MSF |
3,232,406 |
0.3% |
| Rural |
Wood |
Seasoned |
286,563,187 |
27.8% |
| Rural |
Wood |
Wet |
188,759,559 |
18.3% |
| Rural |
Coal |
House |
92,190,650 |
8.9% |
| Rural |
Coal |
MSF |
12,219,114 |
1.2% |
| Total |
1,032,369,909 |
100% |
Figure 3‑10 shows the total PM2.5 concentrations for Option 1 (baseline), and Figure 3‑11 shows the modelled contribution from domestic combustion. Modelled domestic combustion contributes an average of 0.07% to total PM2.5 concentrations, so it is difficult to interpret maps of total concentrations, which mainly reflect background concentrations. Exceedances of the Scottish 10 µg m-3 PM2.5 annual mean objective were not predicted in any location.
The maximum modelled domestic solid-fuel combustion concentration of 0.43 µg m-3 was in Aberdeen, where the highest number of households using solid fuels in urban areas was located. The modelled domestic combustion concentration is 7% of total PM2.5 concentrations in this location. Total rural emissions are distributed across a larger number of households and locations than urban emissions.

3.3.7 Option 2 and 3 model results
Table 3‑8 contains the total PM2.5 emissions by fuel type and location for Options 2 and 3 compared to Option 1 (the baseline). Each option reduces the total PM2.5 emissions, with Option 3 having the largest impact because of the considerable reduction in coal emissions.
| Location |
Type |
Option 1 (baseline) PM2.5 (g) |
Option 2 PM2.5 (g) |
Option 2 change from Option 1 (g) |
Option 3 PM2.5 (g) |
Option 3 change from Option 1 (g) |
|---|---|---|---|---|---|---|
| Urban |
Seasoned wood |
225,185,625 |
226,073,055 |
887,430 |
225,185,625 |
- |
| Urban |
Wet wood |
222,189,943 |
219,968,044 |
-2,221,899 |
222,189,943 |
- |
| Urban |
House coal |
2,029,425 |
2,009,131 |
-20,294 |
- |
-2,029,425 |
| Urban |
MSF |
3,232,406 |
3,236,447 |
4,042 |
3,636,575 |
404,169 |
| Rural |
Seasoned wood |
286,563,187 |
287,317,096 |
753,909 |
286,563,187 |
- |
| Rural |
Wet wood |
188,759,559 |
186,871,963 |
-1,887,596 |
188,759,559 |
- |
| Rural |
House coal |
92,190,650 |
91,268,744 |
-921,907 |
- |
-92,190,650 |
| Rural |
MSF |
12,219,114 |
12,402,716 |
183,602 |
30,579,296 |
18,360,182 |
| Scotland |
Wood |
922,698,314 |
920,230,158 |
-2,468,156 |
922,698,314 |
- |
| Scotland |
Coal |
109,671,595 |
108,917,038 |
-754,557 |
34,215,871 |
-75,455,724 |
| Total |
1,032,369,909 |
1,029,147,196 |
-3,222,713 |
956,914,186 |
-75,455,724 |
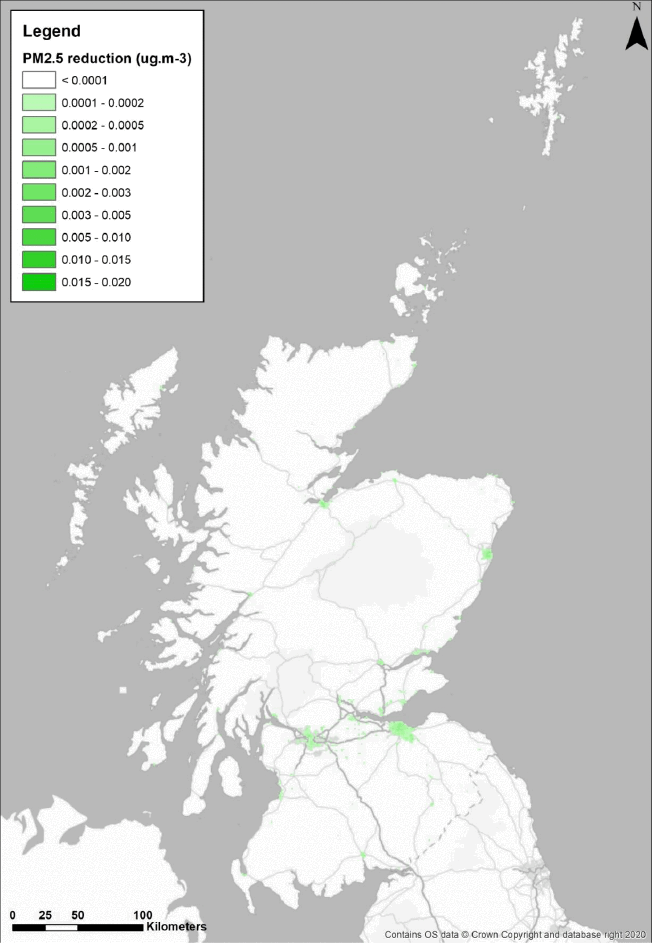
Figure 3‑12 shows the difference in total PM2.5 concentrations between Option 2 and Option 1 (baseline) as well as the difference between Option 3 and Option 1 (baseline).
For Option 2, the differences in concentrations are very small (< 0.0001 µg m-3) in most locations. The largest differences are in urban areas, where there were the highest emissions of wet wood in the baseline distributed across smaller urban areas compared to rural. The maximum reduction of 0.0013 µg m-3 for Option 2 was in Aberdeen; this reduction is 0.02% of total PM2.5 concentrations and 0.3% of modelled domestic combustion concentrations in this location.
There were larger reductions in total PM2.5 concentrations across many parts of Scotland in Option 3 than in Option 2, although the difference in total concentrations between Option 1 (the baseline) and Option 3 are still fairly small. Option 3 has a larger effect in rural areas than in urban because there is limited use of house coal in urban areas. The maximum reduction of 0.020 µg m-3 for Option 3 was in Fort William; this reduction is 0.5% of total PM2.5 concentrations and 15% of modelled domestic combustion in this location.

3.4 Assessment of costs and benefits
This section sets out the results of the assessment of costs and benefits, including monetising the change in emissions and their impact on air quality. The following methodological points have been used in accordance with HMT Green Book guidance:
- Prices converted to 2020 price year, with a discount year of 2022 (3.5% discount rate)
- Impacts have been calculated for the year 2023 and for a 10 year appraisal period from 2023-2032
- A 2% uplift for real wage growth has been applied to monetised health benefits
- 10 year appraisal period.
3.4.1 Valuation of health impacts from reduced exposure to air pollution
3.4.1.1 Overview and receptors
This section covers analysis of the health impacts associated with changes in exposure to air pollutants of Options 2 and 3.
There is a well-documented link between high levels of ambient air pollution and increased levels of adverse health effects. Due to the health concerns associated with air pollution, particularly PM2.5, legislation has been introduced in Scotland to improve air quality. Studies strongly suggest that long-term (chronic) exposure to particles (PM2.5) may damage human health and that these impacts (measured through changes in life expectancy) are substantially greater than the effects of acute exposure. Key receptors include all people exposed to local air pollution (e.g. residents, road users, pedestrians, the elderly/ children). In particular, the young, elderly and those with a pre-existing health condition are more at risk of exposure to air pollutants.
Health impacts are uplifted by 2% per year over the appraisal period in keeping with the Defra guidance: this recognises that willingness-to-pay to reduce detrimental health outcomes tends to increase with income and hence could be expected to rise over time with real income growth.
3.4.1.2 The impact pathway approach
Defra has produced guidance[31] to steer the assessment of air quality impacts on health and the valuation of associated economic costs. This guidance was designed to support evidence gathering to inform policy development or evaluation in the UK. Following this guidance, Defra produced a set of damage costs for air pollution, which summarise the impacts per tonne of emission. The assessment of health impacts in this report draws heavily on this guidance and is broadly consistent with the approaches used to produce the latest set of Defra damage costs (with slight variations as noted in the methodology section below), but also combined with Scotland-specific data, where available.
The first step overlays the gridded annual average modelled PM2.5 concentrations (produced from the air quality modelling as described in section 3.3) with population grids to calculate population weighted concentrations for each scenario.
Aggregate population-weighted mean concentrations (PWMC) were derived using the following formula:
PWMC = (LSOA mean pollutant concentration * LSOA population) / Total population in domain
For the second step, the concentration response function (CRF) for each impact pathway (which defines a given health impact per unit change in the ambient concentration of a pollutant), is combined with the change in population weighted mean pollutant concentrations and the following parameters to define health impacts:
- the underlying risk rate of the health impact;
- the population data.
By adopting the UK average CRFs and baseline risk rates, we have remained consistent with the Defra damage cost calculation to assess the impact of varying levels of ambient air pollution on the health of the Scottish population. The CRFs reflect COMEAP[32] guidance and opinions, which in turn forms part of the Interdepartmental Group on Costs and Benefits (IGCB) and HMT Green Book appraisal guidance. The CRFs used in our analysis are part of the latest set of damage costs published by the IGCB[33]. These CRFs are presented in Table 3‑9. The current estimation of effects may be an underestimate as the WHO recently recommended a higher CRF for the Chronic mortality of PM2.5 than presented in the Table below.
| % or Odds ratio change per 10ugm-3 change in pollutant |
|||||||
|---|---|---|---|---|---|---|---|
| Pollutant |
Pathway |
Air pollution metric |
CRF type |
Reference change in concentration (ugm-3) |
Low |
Central |
High |
| PM2.5 |
Chronic mortality |
Annual average |
Relative Risk (RR) |
10 |
4 |
6 |
8 |
| PM2.5 |
CHD |
Annual average |
Hazard Ratio (HR) |
5 |
1.00 |
19.00 |
42.00 |
| PM2.5 |
Stroke |
Annual average |
Hazard Ratio (HR) |
5 |
2.10 |
6.40 |
10.90 |
| PM2.5 |
Diabetes |
Annual average |
Relative Risk (RR) |
10 |
2.00 |
10.00 |
18.00 |
| PM2.5 |
Lung cancer |
Annual average |
Relative Risk (RR) |
10 |
4.00 |
9.00 |
14.00 |
| PM2.5 |
Asthma (Older Children) |
Annual average |
Odds Ratio (OR) |
10 |
1.22 |
1.48 |
1.97 |
| PM10 |
Respiratory hospital admission |
Annual average |
Relative Risk (RR) |
10 |
0.8 |
0.8 |
0.8 |
| PM10 |
Cardiovascular hospital admission |
Annual average |
Relative Risk (RR) |
10 |
0.8 |
0.8 |
0.8 |
| PM10 |
Chronic Bronchitis |
Annual average |
Relative Risk (RR) |
10 |
1.02 |
1.32 |
1.71 |
In the results, PM10 pathways are adjusted for PM2.5 using PM2.5/PM10 ratio in emissions.
Finally, the health impacts of policy scenarios are valued (i.e. presented in monetary terms) to show the economic impacts of changes in pollutant concentrations. The valuation of health improvements captures a number of economic effects, including the direct impact on the utility of the affected individual (commonly captured by the 'willingness-to-pay' of the individual to avoid the detrimental health outcome) and reduction in medical costs. Monetising the health impacts in this way is a common approach which allows the economic benefits of improved health outcomes to be compared to the costs of measures in a cost-benefit analysis. We have used monetary value for the health impacts consistent with those used by Defra to derive its air pollution damage costs.
The approach we have adopted is consistent with the latest published approaches from Defra. However, it is important to note that there will be caveats in applying the IPA at this level. Although the COMEAP guidance spans a wide range of health impacts, it does not capture all effects associated with air pollution. Furthermore, it is worth noting that outside the UK, different approaches are taken to quantifying health impacts, adopting different health pathways and CRFs (e.g. EU CAFÉ, US EPA approaches).
3.4.1.3 Sensitivity analysis
The estimation of the impacts of air pollution on health pathways is inherently uncertain. The methodology for assessing the different impact pathways (which are subsequently aggregated to form the damage costs) is based on a number of assumptions around which there is a distribution of probable outcomes. The benefits estimated under this project represent a best estimation of a 'central' damage cost estimate. However, there is uncertainty around the interpretation of changes in air pollution concentrations into impacts and the valuation of those impacts.
Key uncertainties in the damage costs are illustrated using sensitivity ranges around the central values. Given the importance of the impacts of long-term exposure to particulates in the overall damage cost calculation, these ranges explored the uncertainty around CRF for all pathways and valuation for all pathways. Some pathways are excluded altogether from the central analysis, and are only included in the high sensitivity analysis (e.g. chronic bronchitis) – again following the Defra guidance.
A mapping of the point on the CRF range for each impact pathway across each damage cost is presented in Table 3‑10.
| Damage cost sensitivity |
||||
|---|---|---|---|---|
| Pollutant |
Pathway |
Low |
Central |
High |
| PM2.5 |
Chronic mortality |
L |
C |
H |
| PM2.5 |
CHD |
C |
H |
|
| PM2.5 |
Stroke |
C |
H |
|
| PM2.5 |
Diabetes |
C |
||
| PM2.5 |
Lung Cancer |
C |
H |
|
| PM2.5 |
Asthma (Older Children) |
C |
H |
|
| PM2.5 |
Productivity |
L |
C |
H |
| PM10 |
Respiratory hospital admission |
L |
C |
H |
| PM10 |
Cardiovascular hospital admission |
L |
C |
H |
| PM10 |
Chronic Bronchitis |
C |
||
Note: L = Low end of CRF bound; C = central point of CRF bound; H = high end of CRF bound
3.4.1.4 Results
Table 3‑11 presents the change in population weighted concentrations of pollution under Option 2 for the single year of air quality modelling. The results show a reduction in the key pollutants considered within this study, PM2.5.
| Pollutant |
Business as usual (µg/m-3) |
Option 2 scenario (µg/m-3) |
Change (µg/m-3) |
% change |
|---|---|---|---|---|
| PM2.5 |
5.63205 |
5.63191 |
0.00013 |
0.002% |
Table 3‑12 presents the monetised outputs of the single year analysis. This presents the health impacts associated with change in exposure modelled for the scenarios for the year 2019 (the air quality modelling year) – the health impacts will be larger if viewed over the lifetime of the measure.
| Pollutant |
Health pathways / CRFs for inclusion |
Monetised output (£2020)[34] |
|---|---|---|
| PM2.5 |
Chronic mortality |
17,529 |
| PM2.5 |
CHD |
12,321 |
| PM2.5 |
Stroke |
4,636 |
| PM2.5 |
Lung Cancer |
299 |
| PM2.5 |
Asthma (Older Children) |
9,130 |
| PM2.5 |
Productivity |
1,531 |
| PM10 |
Respiratory hospital admission |
177 |
| PM10 |
Cardiovascular hospital admission |
108 |
| Total |
45,732 |
The most significant impact comes from the reduction in Chronic Mortality, which has a total monetised benefit of over £17,000. The other significant benefits are from CHD and Asthma (Older Children) which have a monetised impact of over £12,000 and £9,000 respectively.
Table 3‑13 presents the change in population weighted concentrations of pollution under Option 3.
| Pollutant |
Business as usual (µg/m-3) |
Option 3 scenario (µg/m-3) |
Change (µg/m-3) |
% change |
|---|---|---|---|---|
| PM2.5 |
5.63205 |
5.63140 |
0.00064 |
0.011% |
| Pollutant |
Health pathways / CRFs for inclusion |
Monetised output (£2020)[35] |
|---|---|---|
| PM2.5 |
Chronic mortality |
84,484 |
| PM2.5 |
CHD |
59,381 |
| PM2.5 |
Stroke |
22,345 |
| PM2.5 |
Lung Cancer |
1,442 |
| PM2.5 |
Asthma (Older Children) |
44,005 |
| PM2.5 |
Productivity |
7,380 |
| PM10 |
Respiratory hospital admission |
852 |
| PM10 |
Cardiovascular hospital admission |
521 |
| Total |
220,411 |
The most significant impact comes from the reduction in Chronic Mortality, which has a total monetised benefit of over £84,484. The other significant benefits are from CHD and Asthma (Older Children) which have a monetised impact of over £59,381 and £44,005 respectively.
Air quality impacts were then assessed over the appraisal period. Air quality benefits are assumed to be the same year on year, with no change in baseline fuel usage over the appraisal period. Table 3‑15 below provides the total health benefits of option 2 and 3 for a low, central and high sensitivity over the 10 year appraisal period. The high range in these results represents the sensitivity around the CRF for mortality and for the valuations of mortality and hospital admissions.
| Low |
Central |
High |
|
|---|---|---|---|
| Option 2 Monetised output (£2020) |
78,675 |
380,335 |
1,193,200 |
| Option 3 Monetised output (£2020) |
379,179 |
1,833,071 |
5,750,775 |
The air quality health impacts analysis has captured a range of key health impacts directly associated with changes in concentrations of air pollutants. Alongside these effects, exposure to air pollutants has been associated with a wider range of health impacts that have not been included in this assessment. These include additional health impacts from SO2 or NOX improvements that have not been quantified and the potential health benefits from reductions in indoor pollution. The impacts on health of these other pollutants could not be quantified in this assessment because the impacts of the options on pollutants other than PM2.5 have not been modelled. In particular, this is relevant for impacts on SO2 which will arise from the introduction of the 2% sulphur limit on manufactured sold fuels. In the interviews with industry stakeholders, it was raised that a typical sulphur content for "high sulphur" manufactured solid fuels is 6%, while those manufactured in accordance with the 2% limit (Already in place in England) will typically be at the 2% limit. However, it is not possible to directly estimate the change in SO2 emissions from this information, as there is not an established methodology to translate fuel sulphur content to sulphur emissions, and the proportion of manufactured fuels sold as high sulphur are currently not known. There is also likely to be a change in NOX emissions which has not been quantified, Therefore, there are additional health benefits of the policy options resulting from the shift from high sulphur to low sulphur manufactured fuels that are not captured in the quantitative figures. Environmental pathways were also not considered in the valuation of impacts from reduced air pollution as they are less significant for PM2.5 than for SO2 and NOX.
Also, in the target interviews, it was raised that the sulphur limit on manufactured smokeless fuels was considered to prevent a likely scenario that would occur in its absence. England already has in place a sulphur limit, and Ireland also from the 1st November 2022.[36] As such, it is likely that if the sulphur limit was not to be implemented in Scotland, high sulphur manufactured solid fuels would be moved to Scotland as it is one of the only remaining marketplaces. As such, more polluting fuels may become concentrated in Scotland with an increase in negative health impacts associated with them.
3.4.2 Fuel cost impacts
We have estimated the societal changes in fuel costs resulting from the scenarios. This analysis has monetised the baseline usage of fuels, and the change in fuel use in the scenarios using fuel price data derived from the Defra 2019 Impact Assessment. Table 3‑16 presents the retail fuels prices for the different fuel types based on a 2020 price year. Given the appraisal period for the assessment is 2023 – 2032 the coal prices have been adjusted in real terms for each year based upon the projected change in coal prices outlined in the BEIS supplementary guidance to the Treasury's Greenbook[37].
It should be noted that although the costs of the cleaner fuels are higher, there is an efficiency saving in consumption captured in the switch from coal to manufactured solid fuels, which is captured in the fuel usage estimates for each scenario. To note, the energy efficiency savings have not captured a switch from high manufactured fuel to low manufactured fuel, but have focussed only on the transition from wet wood to dry wood and coal to low sulphur manufactured fuel.
| Type of Fuel |
Price (£/tonne) |
|---|---|
| Dry Wood |
389 |
| Wet Wood |
239 |
| Coal |
293 |
| Low Sulphur Manufactured Fuel |
406 |
| High Sulphur Manufactured Fuel |
358 |
Source: 2019 Impact Assessment on the proposed England Regulation which provided prices referring to Defra estimates based on industry data from Call for evidence
Table 3‑17 illustrates the change in use for the different fuel types as a result of the implementation of either the information campaign to support the voluntary shift in fuel use or the proposed ban on coal use, compared to the baseline scenario. The behavioural assumptions which underpin the change in fuel use have been described in section 3.3.
As shown, the introduction of the ban on coal will have a greater impact on quantity of fuel consumed. Due to the greater efficiency of dry wood (comparative to wet wood) and manufactured fuel (comparative to house coal), under both scenarios a lesser amount of the substitute fuel is required to ensure energy output remains consistent.
| Type of Fuel |
Baseline (No Intervention) |
Information Campaign – Option 2 |
Change in Fuel Use – Option 2 |
Proposed Coal Ban – Option 3 |
Change in Fuel Use – Option 3 |
|---|---|---|---|---|---|
| Wet Wood |
23.74 |
23.50 |
-0.24 |
23.74 |
0.00 |
| Dry Wood |
74.02 |
74.22 |
0.20 |
74.02 |
0.00 |
| House Coal |
11.71 |
11.60 |
-0.12 |
0.00 |
-11.71 |
| Manufactured Fuel |
9.65 |
9.75 |
0.10 |
20.12 |
10.48 |
| Total |
119.12 |
119.07 |
-0.05 |
117.88 |
-1.24 |
As a result of the information campaign there is expected to be a small transition away from the use of wet wood to dry wood, and a small shift in the use of coal towards manufactured fuel. As a result, a small cost of approximately £30,000 is expected to be incurred primarily driven by the higher retail price of dry wood.
There is a greater increase in fuel costs from the Option 3 (£878,000 in 2023). This is due to the higher retail price of manufactured fuel compared to coal according to data gathered in the Defra 2019 Impact Assessment. Table 3‑18 presents the costs for the first year of the implementation of the policies (2023).
| Baseline (No Intervention) |
Information Campaign – Option 2 |
Change in Fuel Use – Option 2 |
Proposed Coal Ban – Option 3 |
Change in Fuel Use – Option 3 |
|---|---|---|---|---|
| £40,977,102 |
£41,007,166 |
£30,064 |
£41,854,719 |
£877,617 |
Note: Small differences in the change in impact are due to rounding
Additionally, the costs of both the information campaign and the proposed ban have been estimated for the 2023 – 2032 period (Table 3‑19).
| Baseline (No Intervention) |
Information Campaign – Option 2 |
Change in Fuel Use – Option 2 |
Proposed Coal Ban – Option 3 |
Change in Fuel Use – Option 3 |
|---|---|---|---|---|
| £356,786,496 |
£357,049,923 |
£263,426 |
£364,805,532 |
£8,019,036 |
Note: Small differences in the change in impact are due to rounding
As noted, the fuel prices have been based upon the retail fuel prices provided in the Defra 2019 Impact Assessment[38] exploring the costs of a similar coal ban. However, although the IA presents a higher price for manufactured fuel compared to coal, interviews with two industry stakeholders suggested that the price of manufactured fuel and coal have converged and become the same in recent years. As such, sensitivity analysis was undertaken around this information. The tables below provide the costs, in 2023, factoring in the views of the industry stakeholders and therefore setting an equivalent mid-point price level (£338/t) for both coal and manufactured fuels. As a result of equalising the coal and manufactured fuel prices the increase in costs under Option 2 is expected to decrease. In the case of the Option 3, following this price change there is now expected to be an overall fuel cost reduction (i.e. a saving) of approximately £450,000 in 2023. Option 2 still results in a net increase in fuel costs, as the price of dry wood is still significantly greater than wet wood, which outweighs the cost benefits brought from the greater energy efficiency of MSF compared with coal.
| Baseline (No Intervention) |
Information Campaign – Option 2 |
Change in Fuel Use – Option 2 |
Proposed Coal Ban – Option 3 |
Change in Fuel Use – Option 3 |
|---|---|---|---|---|
| £41,075,777 |
£41,092,558 |
£16,782 |
£40,625,199 |
-£450,578 |
Note: Small differences in the change in impact are due to rounding
| Baseline (No Intervention) |
Information Campaign – Option 2 |
Change in Fuel Use – Option 2 |
Proposed Coal Ban – Option 3 |
Change in Fuel Use – Option 3 |
|---|---|---|---|---|
| £357,688,112 |
£357,830,177 |
£142,066 |
£353,571,055 |
-£4,117,057 |
Note: Small differences in the change in impact are due to rounding
3.4.3 Greenhouse gas (GHG) impacts
We have estimated changes in greenhouse gas emissions from the change in fuel use using emission factors for wood from the EMEP guidebook[39]. For coal and manufactured solid fuels, emission factors from the NAEI were used. This contains emission factors per GJ for different types of solid fuels. The calculation of total GHG emissions has been based upon the 'total fuel consumed multiplied by the emission factor of the pollutant', as per the guidance in the EMEP guidebook.
The resulting change in GHG emissions were monetised using BEIS guidance.[40]
Table 3‑22 shows the emission factors for biomass (used as an indicator for wood), coal and manufactured fuel for the relevant GHG pollutants. As presented below, the highest GHG emission factor is associated with the burning of coal through domestic combustion processes.
| Fuel Type |
Category |
Unit |
Pollutant |
Emission Factor |
Source |
|---|---|---|---|---|---|
| Biomass (Wood) |
Fireplace |
mg/MJ |
CO2 |
91,210 |
EMEP guidebook |
| Biomass (Wood) |
Woodstove |
mg/MJ |
CO2 |
88,445 |
EMEP guidebook |
| Coal |
Domestic combustion |
kgCO2e/Tonnes |
CO2 |
2632 |
NAEI |
| Coal |
Domestic combustion |
kgCO2e/Tonnes |
Methane |
215 |
NAEI |
| Coal |
Domestic combustion |
kgCO2e/Tonnes |
Nitrous Oxide |
37 |
NAEI |
| Manufactured Fuel |
Domestic combustion |
kgCO2e/Tonnes |
CO2 |
2897 |
NAEI |
| Manufactured Fuel |
Domestic combustion |
kgCO2e/Tonnes |
Methane |
233 |
NAEI |
| Manufactured Fuel |
Domestic combustion |
kgCO2e/Tonnes |
Nitrous Oxide |
40 |
NAEI |
Table 3‑23 displays the GHG impact as a result of the scenarios compared to Option 1 (the baseline no intervention scenario). It should be noted that in terms of GHG emissions associated with wood burning, there is not expected to be an impact as a result of either policy measure, for wood burned in a fireplace or a woodstove. Although Option 2 is expected to lead to a small (1%) switch in the use of wet wood to dry wood, the emission factors provided in the EMEP guidance do not differentiate between the wood types. To note, the quantitative assessment has not captured the potential life-cycle impact of the fuels. For example, dry wood is typically dried through the use of a kiln, which will in turn lead to a small amount of GHGs emitted through this process. However, given the transition from the use of wet wood to dry wood is relatively small, this is not expected to have a significant impact upon GHG emissions.
As shown below, there is expected to be a greenhouse gas emissions reduction as a result of both policy measures. A significantly greater saving, of approximately 10 times the amount, is expected as a result of Option 3. This is due to the increased efficiency of manufactured fuels and the subsequent lower amount needed.
| Baseline (No Intervention) |
Information Campaign – Option 2 |
Change in GHG impact – Option 2 |
Proposed Coal Ban – Option 3 |
Change in GHG impact – Option 3 |
|---|---|---|---|---|
| £46,030,860 |
£ 46,029,475 |
-£1,385 |
£45,892,356 |
-£138,503 |
Note: Small differences in the change in impact are due to rounding
| Baseline (No Intervention) |
Information Campaign – Option 2 |
Change in GHG impact – Option 2 |
Proposed Coal Ban – Option 3 |
Change in GHG impact – Option 3 |
|---|---|---|---|---|
| £ 422,688,784 |
£422,676,065 |
-£12,718 |
£421,416,946 |
-£1,271,838 |
Note: Small differences in the change in impact are due to rounding
Sensitivity analysis has also been undertaken to determine the monetised impact of the change in GHG emissions using the low and high carbon costs provided through BEIS guidance.[41] The results of the sensitivity analysis are shown in the table below. As a result of the sensitivity analysis it can be determined that the GHG impact saving as a result of Option 2 will fall between approximately £690 – £2,080 in 2023. A greater saving of between £69,000 - £208,000 is expected as a result of Option 3. The benefits (savings) are greater over the 10 year appraisal period as shown in Table 3‑26.
| Carbon Price |
Baseline (No Intervention) |
Information Campaign – Option 2 |
Change in GHG impact – Option 2 |
Proposed Coal Ban – Option 3 |
Change in GHG impact – Option 3 |
|---|---|---|---|---|---|
| Low |
£23,015,430 |
£23,014,737 |
-£693 |
£22,946,178 |
-£69,252 |
| High |
£69,046,289 |
£69,044,212 |
-£2,078 |
£68,838,534 |
-£207,755 |
Note: Small differences in the change in impact are due to rounding
| Carbon Price |
Baseline (No Intervention) |
Information Campaign – Option 2 |
Change in GHG impact – Option 2 |
Proposed Coal Ban – Option 3 |
Change in GHG impact – Option 3 |
|---|---|---|---|---|---|
| Low |
£211,344,392 |
£211,338,033 |
-£6,359 |
£210,708,473 |
-£635,919 |
| High |
£634,033,176 |
£634,014,098 |
-£19,078 |
£632,125,419 |
-£1,907,757 |
Note: Small differences in the change in impact are due to rounding
3.4.4 Implementation costs
Implementation costs are expected to include the cost to the Scottish Government to undertake an information campaign to promote the bans, and costs of enforcement of the ban.
In terms of the cost of implementing the ban on the use of solid fuel, based on the Impact Assessment for the ban in England, enforcement costs for local authorities are expected to be approximately £1.2M over an 11-year period (costs for this assessment are based on a 10-year appraisal period). There are currently 333 local authorities operating within England and 32 within Scotland. Based on the assumption that the enforcement costs associated with the ban are evenly split across and scale with the number of local authorities, it is estimated that each authority will incur costs of approximately £3,300 over the 10 year period. This approach has used cost information for specific local authorities, but it is expected that the implementation burden for each local authority will be relatively consistent across both England and Scotland, although there may be some variation, for instance between rural and urban authorities. Following this approach would result in total enforcement costs for Scottish authorities of £116,000 over the 10-year appraisal period.
In terms of the public information campaign to support the voluntary transition away from the use of solid fuels, the costs for England were estimated to be £220,000 over a three year period. Based on the same approach taken to calculate the implementation costs of the coal ban for Scottish authorities (proportioning the costs based on the difference in the number of England and Scotland local authorities), the cost to run the public information campaign in Scotland will be approximately £80,000 over a 10-year period.
We have also considered the cost implications associated with changes or upgrades to heating systems to use different fuels. However, from interviews with industry (CPL supplier and the Coal Merchants Federation), it was noted that coal based boilers are capable of utilising smokeless fuels. As such, there will be no costs associated with required upgrading of heating systems resulting from the ban of coal. This is consistent with the Defra 2019 Impact Assessment which does not account for boiler costs in the assessment.
3.4.5 Summary cost benefit analysis
The results of the quantitative analysis of the cost-benefit analysis suggest that Option 2 results in a positive NPV, with the benefits of the air quality improvements and greenhouse gas emissions brought by the small shift in usage (from wet wood to dry wood, and from coal to manufactured solid fuels) outweighing the increased fuel costs and implementation costs of the policy (Positive NPV of £65,200).
For the proposed ban of coal and limit on sulphur in smokeless fuels (Option 3), the central assessment suggests that the costs outweigh the benefits, driven largely by the increased fuel costs which are not outweighed by the health and greenhouse gas emissions benefits (Negative NPV of -£5,016,400). This in part reflects the specific pattern of air quality benefits associated with a ban in Scotland (which have been assessed here using a more detailed dispersion modelling- impact pathway approach): namely given the use of solid fuels is highest amongst households in rural areas, there is also therefore low population densities in areas with the biggest impacts (i.e. reductions in air pollution). As such the associated reduction in exposure, and health improvements, are potentially smaller.
However, with such a large shift in fuel usage represented by the ban from coal to smokeless fuels, the fuel prices used play a large role in the determination of the NPV of the policy. The fuel price data used for the main analysis was based on price data from the Defra 2019 Impact Assessment for the England coal ban policy, published in 2019, and projected over the appraisal period using BEIS fuel price projections. This price data had coal as being significantly cheaper than manufactured solid fuels (£293 per tonne of coal vs. £358-406 per tonne for smokeless fuels in 2019). Through the targeted interviews conducted as part of this study, stakeholders have indicated that the prices of these fuels have converged in recent years. As such, we conducted sensitivity analysis with equivalent prices, and this found a positive NPV of £7,123,600 for Option 3 (However, Option 2 is still an overall cost due to the increased usage of dry wood and its higher price). This highlights the strong sensitivity of the overall NPV result to the fuel price assumptions used. Given this data was provided by the industry stakeholders as part of the study, this could be considered a more up-to-date assessment of the impacts, but fuel prices will remain inherently uncertain going forward. However, stakeholders indicated that the current price equivalence is resulting from the England ban which will remain in place, and therefore prices are likely to continue to be equivalent.
Certain additional benefits have also not been monetised under the policy scenarios. Most notably, additional benefits from SO2 brought by the 2% sulphur limit on manufactured solid fuels, and additional health benefits brought by reductions in indoor air pollution.
To the extent that the difference in prices between the banned fuels and their alternatives stays small (i.e. the price of manufactured solid fuels does not rise above the cost of coal, the NPV of the ban under Option 3 would also be positive under a central assessment.
| Impact |
Policy Option 2 (Information campaign) |
Policy Option 3 (Coal ban and sulphur limit) |
Policy Option 2 (With fuel price sensitivity) |
Policy Option 3 (With fuel price sensitivity) |
|---|---|---|---|---|
| Fuel Costs |
£263,000 |
£8,020,000 |
£142,000 |
-£4,120,000 |
| Greenhouse gas Impacts |
-£13,000 |
-£1,270,000 |
-£13,000 |
-£1,270,000 |
| Health impacts |
-£380,000 |
-£1,830,000 |
-£380,000 |
-£1,830,000 |
| Implementation Costs |
£64,800 |
£96,400 |
£64,800 |
£96,400 |
| Total NPV |
-£65,200 |
£5,016,400 |
-£186,200 |
-£7,123,600 |
3.5 Air quality results for the distributional analysis
3.5.1 Overview and approach
This section presents distributional analysis of health impacts. While the cost-benefit analysis includes the health impacts of the policy scenarios on society as a whole, distributional analysis estimates how these impacts may fall unevenly on certain populations geographically, and also certain demographics.
The approach to appraising each of the impacts closely follows the methodology set out in the TAG guidance. Namely, the 'impact variables' (describing how the impacts vary or are distributed across a geographic area) are overlaid with the 'grouping variables' (describing how different societal groups are distributed across the same area).
In most cases the appraisal is then made on the basis of splitting both the grouping and impact variables into quintiles, and then judging whether the impact on a given population group is proportionate to the representation of that group in the wider population. The categories included in this analysis are Index of Multiple Deprivation-Income, children, and elderly groups. The overlay of impacts and groups was then undertaken on a Lower Layer Super Output Area (LSOA) basis.
Average PM2.5 concentrations by LSOA were calculated for each scenario in GIS using zonal statistics of the total PM2.5 concentrations raster and the LSOA shapefile20. The LSOA boundaries represent 2011 Census data.
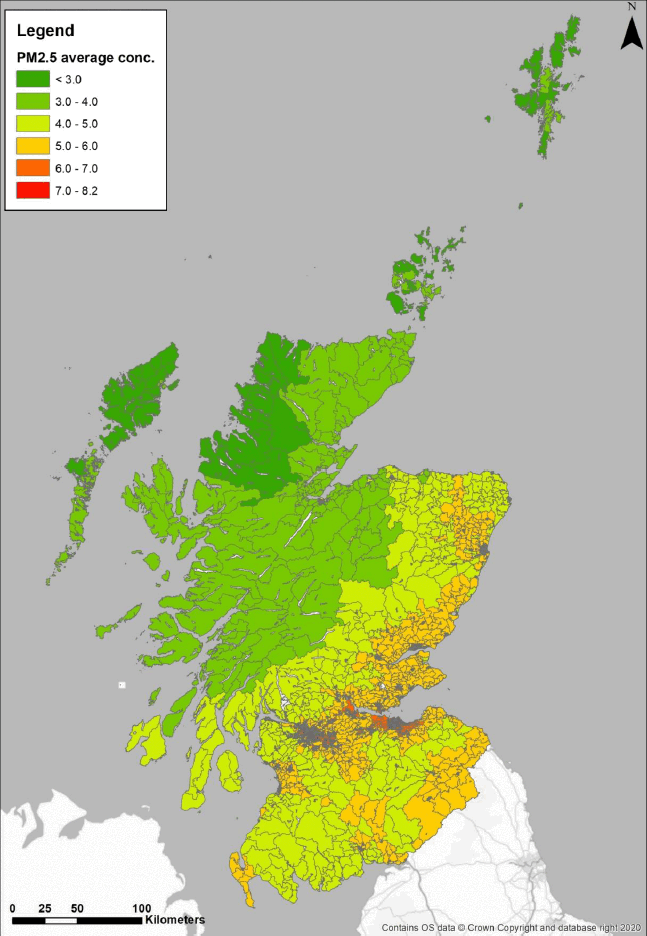
Figure 3‑14 shows average Option 1 (baseline) PM2.5 concentrations by LSOA. Figure 3‑15 shows the concentrations by LSOA for the central belt, including Glasgow and Edinburgh, and Figure 3‑16 shows the concentrations for the east coast, including Aberdeen and Dundee. We have included figures focusing on these areas because the LSOAs have smaller areas in the cities than in rural areas, and it is difficult to examine the results in a map covering all of Scotland. Large proportions of the population live in cities in the central belt and on the east coast.


To evaluate the impact of the options on each LSOA, the change in the average pollutant concentrations for each LSOA was calculated by subtracting Option 2 and 3 in turn from the Option 1 (baseline) 2019 scenario. If the resulting change is positive, there is an improvement in air quality as a result of the option.
(2030 Option 1) – (2030 Option 2/3) = (Change in Air Quality)
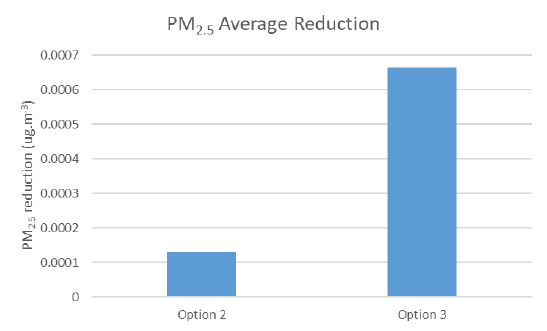
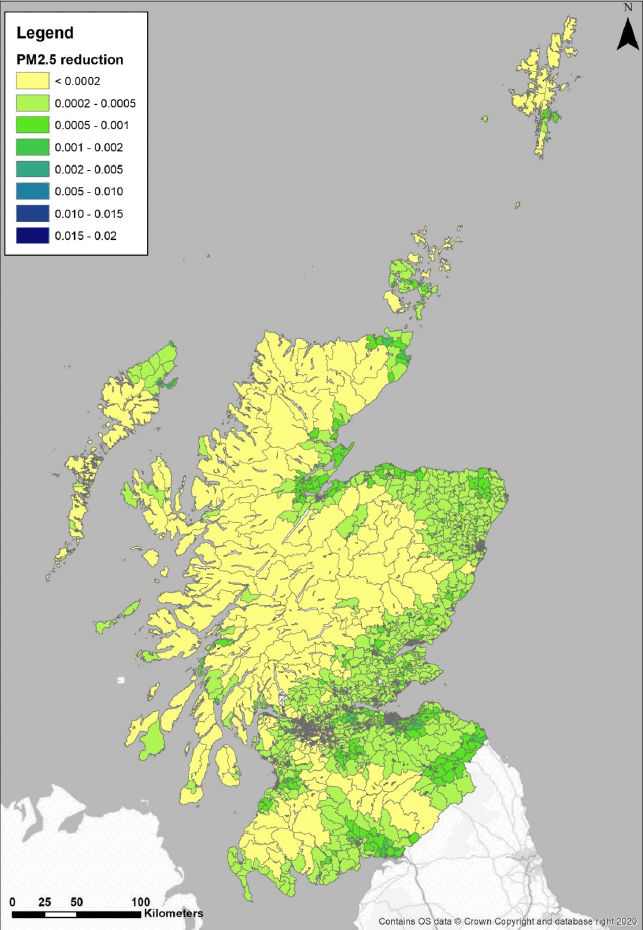
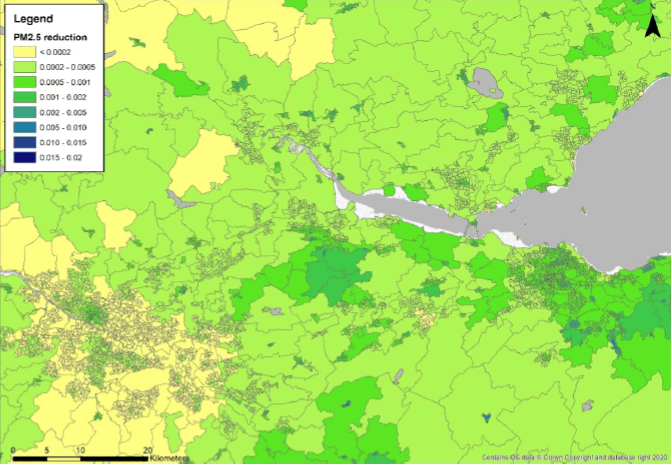
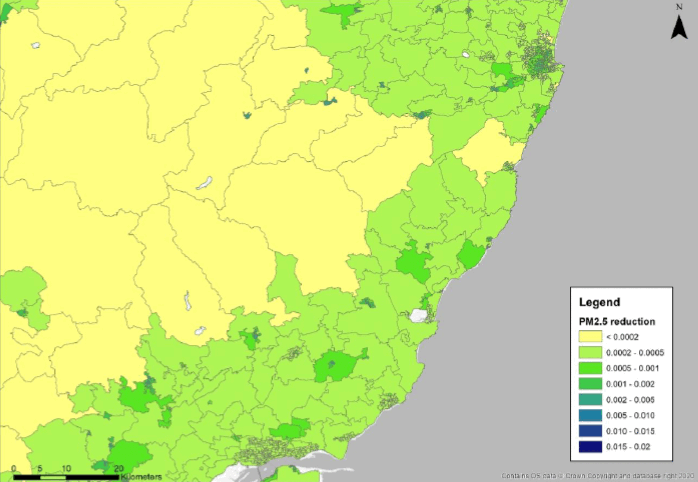
Figure 3‑17 shows the average reduction in total PM2.5 concentrations across LSOAs for each scenario. There is a larger average reduction for Option 3 than for Option 2. Figure 3‑18 through Figure 3‑21 show the reductions in average total PM2.5 concentrations by LSOA for Option 2 and Option 3. This analysis shows the following impacts:
- Overall, PM2.5 concentrations are lower in rural areas than in more populated areas in the central belt and east coast. Differences between total concentrations between the Option 1 (baseline) and Options 2 and 3 are small.
- There is a limited decrease in average concentrations in most LSOAs for Option 2. The largest decreases (0.001 μg.m-3) are in urban areas, e.g., in central parts of Aberdeen and Edinburgh.
- There is a larger reduction in concentrations in Option 3 than in Option 2 for many LSOAs, particularly in rural areas. The largest reductions (0.02 μg.m-3) are seen in LSOAs in remote towns, e.g., Fort William and Kirkwall.



3.5.2 Sectors and groups affected (Distributional impacts)
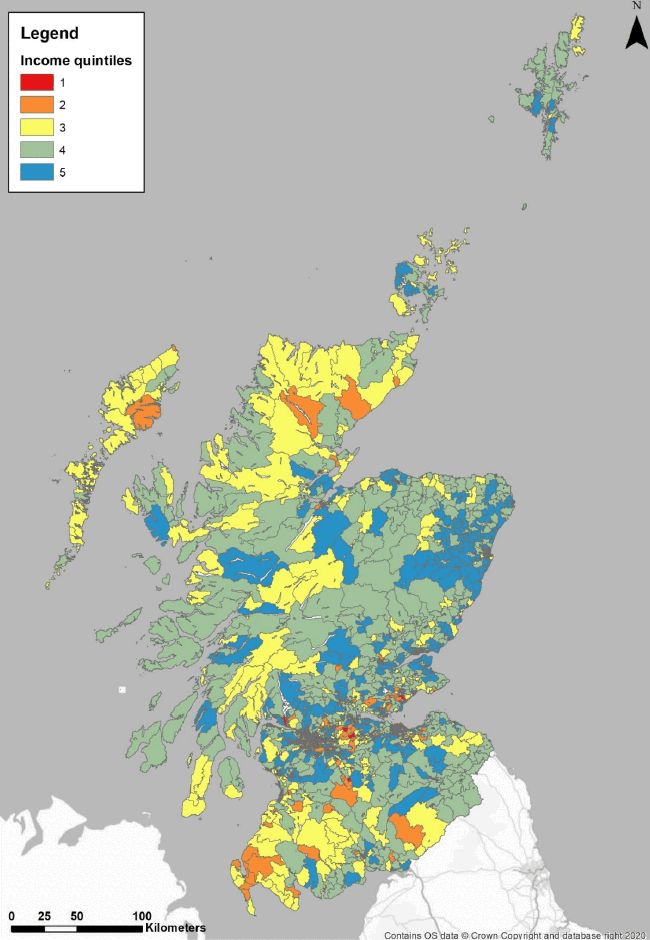
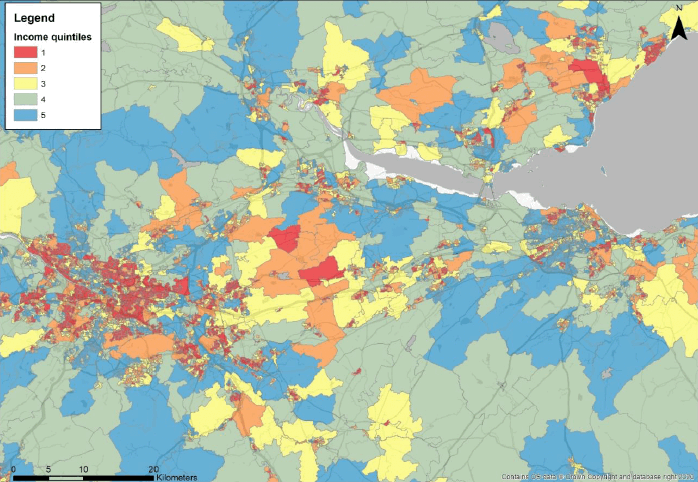
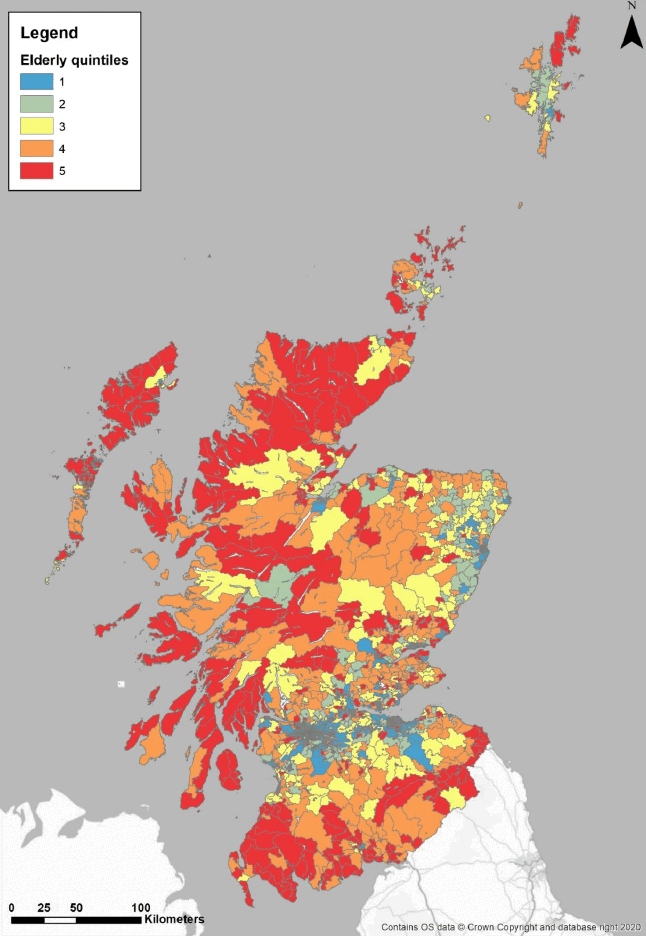
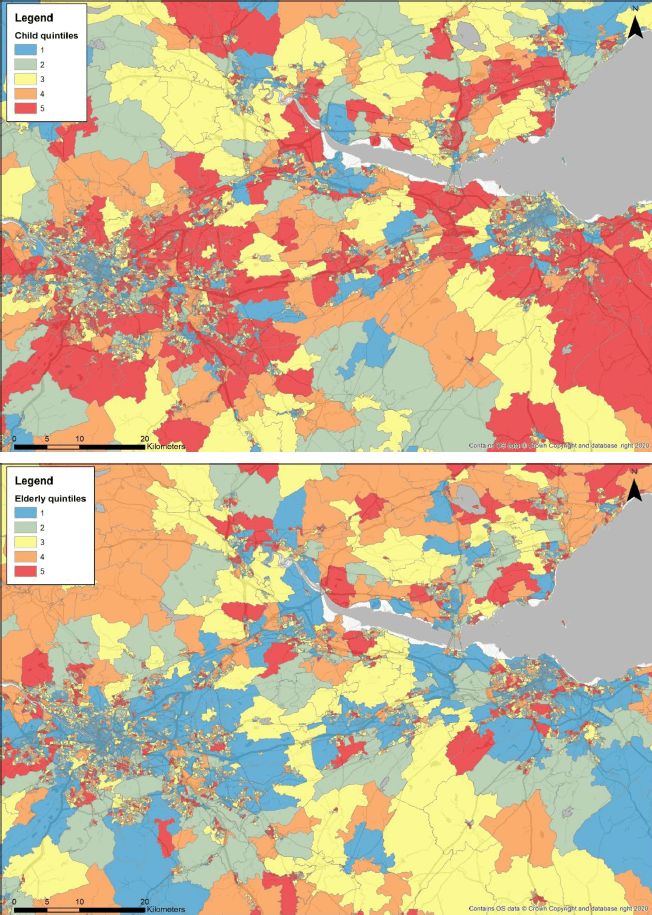
The following analysis explores the distribution of average PM2.5 concentrations by LSOA for socioeconomic impact groups, with a focus on: low income groups (SIMD-Income), children under 16, and elderly (over 65). Mid-2021 population estimates were used to calculate the distribution of each age group across LSOAs in Scotland in quintiles.[42] The SIMD-Income ranks were used to determine the quintile distribution of SIMD-Income across LSOAs22.

3.5.2.1 SIMD-Income
Table 3-28 through Table 3-30 present the average pollutant concentration, and average change in concentration under each of the options scenarios, split by SIMD-Income, proportion of children, and proportion of elderly quintiles respectively, relative to the Option 1 (baseline).
For Option 1 (baseline), the analysis shows that concentrations of PM2.5 are highest for the most deprived groups, who tend to live in urban areas. Average reductions in concentrations between Option 1 (the baseline) and Options 2 and 3 are small for all quintile groups (0.00012 – 0.00091 µg m-3). The options scenarios show the smallest reductions for the most deprived quintile group. The largest reduction was in Option 3 for mid-range quintile group 3. As the largest reductions were in rural areas, where less deprived quintile groups live, the ban on house coal would have a limited effect on reducing inequalities in pollution exposure by income group.
| Option |
SIMD-Income |
Most deprived |
Least deprived |
|||
|---|---|---|---|---|---|---|
| Quintile domain |
1 |
2 |
3 |
4 |
5 |
|
| 2019 Baseline |
Average PM2.5 concentration (μg/m3) |
5.8776 |
5.6995 |
5.4290 |
5.3826 |
5.6564 |
| Option 2 |
Average PM2.5 concentration (μg/m3) |
5.8775 |
5.6993 |
5.4289 |
5.3825 |
5.6562 |
| Real difference in PM2.5 concentration to baseline (μg/m3) |
0.00012 |
0.00013 |
0.00012 |
0.00012 |
0.00016 |
|
| Relative difference in PM2.5 concentration to baseline (%) |
0.002% |
0.002% |
0.002% |
0.002% |
0.003% |
|
| Option 3 |
Average PM2.5 concentration (μg/m3) |
5.8772 |
5.6987 |
5.4281 |
5.3819 |
5.6559 |
| Real difference in PM2.5 concentration to baseline (μg/m3) |
0.00045 |
0.00077 |
0.00091 |
0.00068 |
0.00052 |
|
| Relative difference in PM2.5 concentration to baseline (%) |
0.008% |
0.013% |
0.017% |
0.013% |
0.009% |
3.5.2.2 Children under 16 age group
The Option 1 (baseline) has the highest PM2.5 concentrations for areas with the highest proportion of children, who tend to live in areas near cities. Like Income, average reductions in concentrations between Option 1 (the baseline) and Options 2 and 3 are small for all quintile groups (0.00011 – 0.00074 µg m-3). The scenarios show the smallest reductions for the areas with the highest proportions of children. The largest reduction was in Option 3 for mid-range quintile group 3. As the largest reductions were in rural areas, where lower proportions of children live, the ban on house coal would have a limited effect on reducing inequalities in pollution exposure for children.
| Option |
Under 16 |
Lower proportion |
Higher proportion |
|||
|---|---|---|---|---|---|---|
| Quintile domain |
1 |
2 |
3 |
4 |
5 |
|
| 2019 Baseline |
Average PM2.5 concentration (μg/m3) |
5.6621 |
5.4711 |
5.5440 |
5.6516 |
5.7168 |
| Option 2 |
Average PM2.5 concentration (μg/m3) |
5.6619 |
5.4710 |
5.5439 |
5.6515 |
5.7167 |
| Real difference in PM2.5 concentration to baseline (μg/m3) |
0.00020 |
0.00012 |
0.00012 |
0.00011 |
0.00011 |
|
| Relative difference in PM2.5 concentration to baseline (%) |
0.004% |
0.002% |
0.002% |
0.002% |
0.002% |
|
| Option 3 |
Average PM2.5 concentration (μg/m3) |
5.6614 |
5.4704 |
5.5433 |
5.6510 |
5.7163 |
| Real difference in PM2.5 concentration to baseline (μg/m3) |
0.00068 |
0.00072 |
0.00074 |
0.00063 |
0.00055 |
|
| Relative difference in PM2.5 concentration to baseline (%) |
0.012% |
0.013% |
0.013% |
0.011% |
0.010% |
3.5.2.3 Elderly over 65 age group
Unlike the children quintile groups, the areas with the highest proportion of the over-65s have the lowest PM2.5 concentrations in Option 1 (the baseline), as higher proportions of the elderly live in rural areas with better air quality than in cities. Average reductions in concentrations between Option 1 (the baseline) and Options 2 and 3 are small for all quintile groups (0.00010 – 0.00080 µg m-3). Option 2 had the smallest reductions for the areas with the highest proportions of the elderly. The largest reductions in Option 3 were for areas with high proportions of the elderly, as there is more prevalent house coal use in rural areas. The ban on house coal reduces pollution exposure for the elderly.
| Option |
Under 16 |
Lower proportion |
Higher proportion |
|||
|---|---|---|---|---|---|---|
| Quintile domain |
1 |
2 |
3 |
4 |
5 |
|
| 2019 Baseline |
Average PM2.5 concentration (μg/m3) |
6.0634 |
5.7713 |
5.5627 |
5.3954 |
5.2527 |
| Option 2 |
Average PM2.5 concentration (μg/m3) |
6.0632 |
5.7712 |
5.5626 |
5.3953 |
5.2526 |
| Real difference in PM2.5 concentration to baseline (μg/m3) |
0.00019 |
0.00014 |
0.00012 |
0.00010 |
0.00010 |
|
| Relative difference in PM2.5 concentration to baseline (%) |
0.003% |
0.002% |
0.002% |
0.002% |
0.002% |
|
| Option 3 |
Average PM2.5 concentration (μg/m3) |
6.0629 |
5.7708 |
5.5620 |
5.3946 |
5.2519 |
| Real difference in PM2.5 concentration to baseline (μg/m3) |
0.00045 |
0.00054 |
0.00075 |
0.00079 |
0.00080 |
|
| Relative difference in PM2.5 concentration to baseline (%) |
0.007% |
0.009% |
0.013% |
0.015% |
0.015% |
3.6 Impact on Scottish firms
3.6.1 Introduction and method
This section presents an assessment of impacts on Scottish firms following the Scottish Government Business and Regulatory Impact Assessment template. It focuses on impacts on solid fuel suppliers, who are anticipated to be significantly impacted by the proposed Options. No other group of businesses is anticipated to experience a significant effect.
The approach to assessing impacts on Scottish firms took the following steps:
Step 1: Conduct research to profile the solid fuel supply sector in Scotland, gathering information on types of companies supplying solid fuels (e.g. quantity, size distribution, numbers of employees and range of fuels sold).
Step 2: Assess risks of impacts to fuel supply businesses. A key factor in risk to businesses is a supplier's options in response to a possible restriction. This in turn depends on their supply chains and if they already sell or have access to distribution of alternative less polluting fuels (such as dry biomass or low sulphur manufactured fuels). For example, where suppliers already sell both fuels subject to potential restriction and less polluting fuels, there may be less transitional risk. However, where suppliers sell a less diversified portfolio, or supplies of less polluting fuels are restricted or the market is structured in a way that presents barriers to new entrants, there may be higher risk to fuel supply firms. It was also important to understand differences in costs to suppliers and if they are able to pass this on to their consumers.
3.6.2 Profile of the Scottish fuel supply sector
A preliminary desk-based review identified a scarcity of publicly available information on the Scottish solid fuel supply sectors. To gather information, two targeted interviews were conducted (the information in the remainder of this section is based on the information gleaned in these interviews):
1. On the 24th October, with Wilma Brooks from the Coal Merchants' Federation
2. On the 15th November, with Jason Sutton the CEO of CPL, a large solid fuel supplier operating in Scotland and UK wide.
There are three main routes that consumers are supplied with solid fuels:
1. Merchants, from which fuel must normally bought by the pallet, and may be smaller local businesses or large national scale suppliers
2. Major retailers such as supermarkets and DIY stores, which are often themselves supplied by the large national suppliers
3. Online retail delivered by merchants usually by pallet.
The solid fuel supply sector in Scotland was noted to be diverse, with mixture of larger national suppliers and smaller local businesses. The Coal Merchants Federation has two categories of members: 'high sales' and 'low sales'.[43] 75% of members by number fall into the small category.
Both CPL and the Coal Merchants' Federation were of the opinion that all suppliers who sell coal will already also sell smokeless fuels, and as such would 'be ready' for the transition from coal to smokeless fuels that could be initiated by the proposed ban.
In terms of location of merchants, it was considered by the interviewees that the majority of suppliers to Scottish consumers are based in England (roughly 80% of suppliers based in England, and 20% split between Wales and Scotland). As such, the majority of suppliers for the UK as a whole have already stopped selling coal given the ban already in place in England.
In terms of supply chains, while there used to be indigenous Scottish coal mining often offering fuel at a discount to local people, the interviewees noted the vast majority of coal is now imported, and as such is subject to international prices. Smokeless fuels are manufactured in the UK from imported raw materials. There are three manufacturers of smokeless fuels in the UK: CPL, Oxbow, and M&G.
3.6.3 Impacts
Solid fuel suppliers may be affected in a number of ways as a consequence of the Options:
- Differences in quantities of different fuel sold (and overall quantity due to higher energy efficiency of alternative fuels)
- In swapping fuels sold, changes in material costs, revenue and profits
- Investment costs of purchasing of industrial dryer to produce dry wood may be an option chosen by some suppliers
- Administrative and monitoring costs from enforcement of the regulation by public administration (Option 3).
Interviewees commented that the transition from coal to smokeless fuels from the England ban was a smooth process. Both CPL and the Coal Merchants Federation indicated that suppliers should not experience significant impacts from a proposed coal ban in Scotland as it is extremely likely that all suppliers already sell smokeless fuels. There is no difference in profitability between coal and smokeless fuels. There may be a slight decrease in fuel use and as such, solid fuel sales, as outlined in Section 3.4.2, however this was not regarded to be a concern by the industry stakeholders. As such they could easily adjust their business models and product portfolios in response. Interviewees believed it was highly unlikely that any would go out of business in response to a ban. The Coal Merchants Federation has already run a PR campaign targeting consumers in Scotland highlighting the benefits of smokeless fuels in Winter 2021, involving a leaflet campaign, and conducting television interviews, supported by Defra.
Suppliers of more rural and remote areas are more likely to be impacted as coal is likely to be a higher proportion of their sales, while suppliers serving cities and populated areas will already sell mostly smokeless fuels, especially in cities where there are smokeless zones. Some older local merchants may be more resistant to change in a similar way to consumers who may not wish to swap from coal due to having used it for decades.
In summary, the impacts of Option 2 or Option 3 on businesses are expected to be insignificant following discussions with industry stakeholders. In particular:
- The vast majority of suppliers are likely to already supply smokeless fuels and so will be able to easily transition away from selling coal. Indeed given many suppliers supply to Scotland and other parts of the UK, many have already stopped selling coal given the ban already in place in England (and NI??).
- Given coal is imported yet alternative, cleaner fuels involve processing in Scotland, there is unlikely to be a negative impact further up the solid fuel supply chain and in fact could have a positive impact for the UK more widely as there is greater demand for processing of manufactured fuels, potentially bringing more business and employment opportunities in this part of the supply chain.
- There is no difference in costs or profit margins for suppliers between coal and smokeless fuels.
3.7 Impact on competition
As in accordance with the Scottish appraisal guidance, we below present an assessment of impacts on competitiveness of the policy options. This is based on the following four questions as set out in the BRIA guidance.
Will policy options directly or indirectly limit the number or range of suppliers?
Neither policy option will directly reduce the number of suppliers in the market.
Based on discussion with the industry stakeholders, it is considered highly unlikely that suppliers will be put out of business in response to either Option 2 or 3. Many suppliers were noted to already sell smokeless fuels, and as such it is highly unlikely that the number of suppliers will be impacted indirectly.
Furthermore, any increase in administrative and monitoring costs are not considered to be large enough to either push new firms out of the market, or to disincentivise for new firms to enter the market. This remains the case when factoring in that the relative costs will be greater for smaller firms.
This analysis corresponds to the impact upon businesses' competitiveness assessed in the Defra 2019 Impact Assessment of the solid fuel ban in England. The assessment showed that there was expected to be a limited impact only upon the range of suppliers which will remain in the market, as most firms will be able to adjust to the measure and remain competitive.
Will policy options limit the ability of suppliers to compete?
No. The information campaign under Option 2 and the ban under Option 3 would both apply consistently across all solid fuel operators. Hence the ability for any one firm to compete would not be different to any other as all operators will work within the same requirements.
Will the policy option limit suppliers' incentives to compete?
No. The options do not directly affect the pricing or market dynamics for those solid fuels not subject to the ban. The ban will serve to remove part of the market for solid fuels, which may increase competitiveness for the supply of cleaner alternatives.
Will the measure limit choices and information available to consumers?
Yes but while the measure technically limits choices available to consumers as it removes the market for coal and high-sulphur fuels, interviewees suggest that alternatives should be readily available to the majority of consumers through similar supply routes. Furthermore, the use of alternative fuels is not anticipated to require significant modification or upfront investment by consumers to facilitate their use. Hence the transition for consumers from coal to smokeless fuels should be straightforward, regardless of their type of heating system.
3.8 Impact on International trade
Drawing on the information provided by interviewees, coal is currently all imported to Scotland, with no indigenous coal mining in Scotland. Smokeless fuels by contrast are made of imported raw materials in the United Kingdom. As such, the policy will lead to a reduction in coal imports to Scotland and possibly as a consequence for the UK as a whole. In substitution, it could lead to an increase in the volume of sales of manufactured solid fuels bought from the main UK manufacturers (3 based in England). Hence it is anticipated that there will be little difference to Scotland's trade balance, but a potential (small) positive impact on the UK's overall trade balance.
3.9 Impact on consumers
We have considered the key questions in the Scottish guidance on consumer assessments and believe the following questions to be relevant. We then include an analysis of each question in response.
Does the policy affect the quality, availability or price of any goods or services in a market? Does the policy affect the essential services market, such as energy or water?
Yes. The policy will remove the availability of coal and high-sulphur manufactured fuels from the market for consumers for their home energy heating.
As outlined in Section 3.2, households in rural areas are expected to be more affected by changes in regulations than those living in urban areas, as there is a higher use of solid fuels, particularly as the main fuel. Most solid fuel users are in mid-range deciles of deprivation.
Smokeless fuels are an alternative to coal (and low-sulphur fuel and alternative to high-sulphur) and offer benefits to the consumer through higher quality in the form of greater energy efficiency, and reduced air pollution (both indoor and outdoor).
At the time of the UK impact assessment of the same policy options considered as here for Scotland, coal was cheaper than smokeless fuels, and as such the ban results in an increase in fuel costs to the consumer, even when factoring energy efficiency. These costs will be born on average by people in more rural and remote communities, of middle income, who make greater use of solid fuels on average, as explored in Section 3.1. With that said, data gathered from industry stakeholders in the interviews has suggested that the price of coal and smokeless fuels has converged in recent years, driven in particular by the lack of indigenous UK coal production and therefore costs being driven by international prices of coal. As such, the sensitivity analysis conducted on fuel costs indicates that Option 3 is a net benefit to consumers in fuel cost reduction driven by the higher energy efficiency of smokeless fuels.
Furthermore, the use of alternative fuels is not anticipated to require significant modification or upfront investment by consumers to facilitate their use.
As noted above, interviewees suggest that suppliers of solid fuels are already likely to be able to offer cleaner alternatives. Hence these should be readily available to the majority of consumers through similar supply routes. As such, no significant risk for security of supply or a transition period is anticipated.
Some users of coal may find the ban challenging from the perspective of tradition, whereby they may have used coal for their heating for many years or decades, and as such will be hesitant to change even in the event of cost savings from energy efficiency. As such, the information campaign will be important to help notify such consumers of the benefits of smokeless fuels both in terms of energy efficiency but also health benefits.
Does the policy increase opportunities for unscrupulous suppliers to target consumers?
The policy does not impact the opportunity for unscrupulous suppliers. Because suppliers already sell alternatives, consumers will likely continue to use the same suppliers as before the policy option.
3.10 Digital impact
There will not be digital impacts from the policy options. The ban will not encourage or discourage digital technology.
Contact
Email: airquality@gov.scot
There is a problem
Thanks for your feedback