Natural capital - importance to the Scottish economy: research
This research identifies sectors reliant on natural capital in Scotland and quantifies the economic value of these nature-dependent sectors at national and regional levels. The methodology values our economy's dependence on nature, estimating £40 billion economic output and 261,000 jobs supported.
Economic Impacts of the Various Methods to Measure Natural Capital Reliance
This section presents a summary of the input results from implementing Methods 1-3, followed by multiplier analysis where appropriate. Generating the findings involved a ranking analysis of SIC industries that were reliant on natural capital (including estimates for the proportion of each industry that was reliant on natural capital), and considerations for regional modelling of employment attributable to natural capital reliant industries. The findings focus on proportions of expenditure and output, and the direct and indirect impacts on final output and jobs.
A summary of the main economic impacts for the three methods are presented below in Table 5 and discussed in detail below. Complete results by method, by industry and by region are also provided in the MS Excel model in Appendix 4, tab “Overall Summary Results”. Where Table 5 below refers to “substitutability” and “non-substitutability”: “substitutability” refers to when it was considered possible to substitute the ecosystem services with physical capital; while “non-substitutability” refers to when production processes cannot take place without the ecosystem service due to the availability of substitutes.
| Output of Industries Reliant on Natural capital (£bn) | Total Scotland Output (£bn) | Natural Capital Output as a % of Scottish output | Output Effect (direct and indirect) (£bn) | Employment Effect (direct and indirect) | |
|---|---|---|---|---|---|
| Method 1 | 12.5 | 268 | 5% | 18.8 | 95,800 |
| Uplift between Method 1 and 2 | +12.5 | +17.7 | +135,600 | ||
| Method 2 | 25.0 | 268 | 9% | 36.5 | 231,400 |
| Uplift between Method 2 and 3 | +£9.6 2.6 (Substitutable) 7 |
+3.6* | +30,200* | ||
| Method 3 | 34.6 | 278 | 12% | 40.1 | 261,600 |
Note: “substitutability” refers to when it was considered possible to substitute the ecosystem services with physical capital; while “non-substitutability” refers to when production processes cannot take place without the ecosystem service. *Output and employment effect of substitutable share of nature related output only.
Method 1: Natural Capital Industries’ Output
The Scottish economy, as measured by total gross value added (GVA), or value added at the sector level, relies on industries that provide natural capital goods and services (i.e. provisioning services) to the economy. In this method, it was assumed that 100% of these industries were reliant on natural capital, (i.e. 100% domestic expenditure on other industries was reliant on natural capital). This assumption was made on the basis that the economic activity required to extract resources from the environment (provisioning services), such as crops and livestock (agriculture), timber (forestry planting and harvesting) and fish and other seafood (fishing and aquaculture), was also reliant on natural capital.[27]
In 2019, industries that supported renewable provisioning ecosystem services contributed £5 billion in value added to the economy, representing 4% of Scotland’s economy (based on the natural capital industry share of total GVA). The most significant of these industries to the Scottish economy was agriculture, contributing £1.4 billion – or 26% of renewable natural capital GVA. Agriculture is a key driver of land use in Scotland, with 80% of land used for agricultural production (NFU Scotland, 2023).[28]
The natural capital industries in scope were extended to non-renewable provisioning services as part of sensitivity analysis. Industries that are supported by non-renewable sectors include mining and mining support, coal and lignite, oil and gas extraction, and metal ores. It also includes a proportion of output from electricity generated from non-renewable resources (47% of total energy consumption in 2019) based on data sourced from the Scottish Energy Statistics Hub. As shown in Table 6, including these industries in the definition of natural capital increased the contribution of natural capital to the Scottish economy by almost 60% in GVA terms, from £5.3 billion to £8.5 billion. The contribution to total GVA increased from 4% of the Scottish economy to 6%. Similarly, the proportion of total domestic expenditure reliant on natural capital increased from £4.3 billion to £7.0 billion (7% to 11% of total domestic expenditure). This increase was largely driven by the inclusion of the remaining non-renewable electricity generation.[29]
| Industry | Renewable / Non-renewable | Value added (£ million) | Domestic expenditure (£ million) | Output (£ million) |
|---|---|---|---|---|
| Agriculture | Renewable | £1,407 | £1,346 | £3,841 |
| Forestry planting | Renewable | £149 | £64 | £253 |
| Forestry harvesting | Renewable | £144 | £196 | £403 |
| Fishing | Renewable | £181 | £56 | £327 |
| Aquaculture | Renewable | £396 | £417 | £1,145 |
| Coal & lignite | Non-renewable | £9 | £10 | £34 |
| Oil & gas extraction, metal ores & other | Non-renewable | £153 | £220 | £551 |
| Mining support | Non-renewable | £1,333 | £831 | £3,070 |
| Electricity | Renewable (53%) | £3,518 | £3,583 | £9,026 |
| Water and sewerage | Renewable | £1,161 | £321 | £1,721 |
| Total – renewable | £5,315(a) | £4,310(a) | £12,502(a) | |
| Total – non-renewable | £8,453 | £7,045 | £20,372 | |
| Total – Scotland | £148,002 | £64,072 | £268,084 |
Note: (a) Only the renewable proportion of value added, expenditure and output is used in the estimation of renewable value added and expenditure (£1.9 billion, £1.9 billion and £4.8 billion).
A limitation of using SUT data as the underlying database is that it reflects Scottish businesses that produce goods and services in each industry. For example, fishing activity may occur outside Scottish waters, but may be included in estimates as their business operations are in Scotland.
Economic Impact Analysis: Direct and Indirect Economic Impacts
Multipliers are used to understand how a change in output impacts the economy and its industries. This change will increase output in industries as producers react to meet the increased use, creating a direct effect. As producers increase their output, there will be a resulting increase in use on their suppliers and then to their supply chain – creating the indirect effect. A change in output for an industry will create an employment change, where employees are needed to fulfil the output change. The 2019 multipliers were used as they were deemed to be more representative of the economy, as opposed to 2020 multipliers which may have been impacted by significant structural and behavioural changes in 2020 owing to the COVID-19 pandemic.
Using the definition established in Method 1 and the identified individual industry output reliance on natural capital, the proportion of output and employment effects reliant on natural capital was estimated. Using Method 1, £4.3 billion of Scotland’s total £64 billion of domestic expenditure, and £12.5 billion of Scotland’s total £268 billion output in 2019 was estimated to be reliant on natural capital.[30] As shown in Table 6, the amount of output reliant on natural capital by industry can be used to establish output and employment effects in the Scottish economy. The economic impact analysis modelling throughout the report excluded non-renewable electricity generation from output reliant on natural capital.
Figure 5 below demonstrates that the £12.5 billion of output reliant on natural capital supported an estimated total direct and indirect output effect of £18.8 billion. The largest proportion of this output effect was within the electricity sector, supporting £7.8 billion, or 41% of the total output effect. If non-renewables were to be included, this amount would be even larger. The agriculture industry supported a £5.7 billion output effect (or 30% of the total output effect). The output effect in turn would support 95,800 jobs (direct and indirect). The largest proportion of employees (51%, or 48,500 employees) was estimated to be within the agriculture sector, a sector which relies more heavily on labour inputs. The second largest sector impact was an estimated 18,900 jobs supported in the electricity sector (or 20% of the total employment effect).

The regional results were considered across the eight Regional Economic Partnerships (REP) in Scotland. REPs are collaborations between local government, the private sector, education and skills providers. These areas represent regional interests and economies across Scotland. [31] Figure 6 maps the eight REPs and their geographical boundaries.
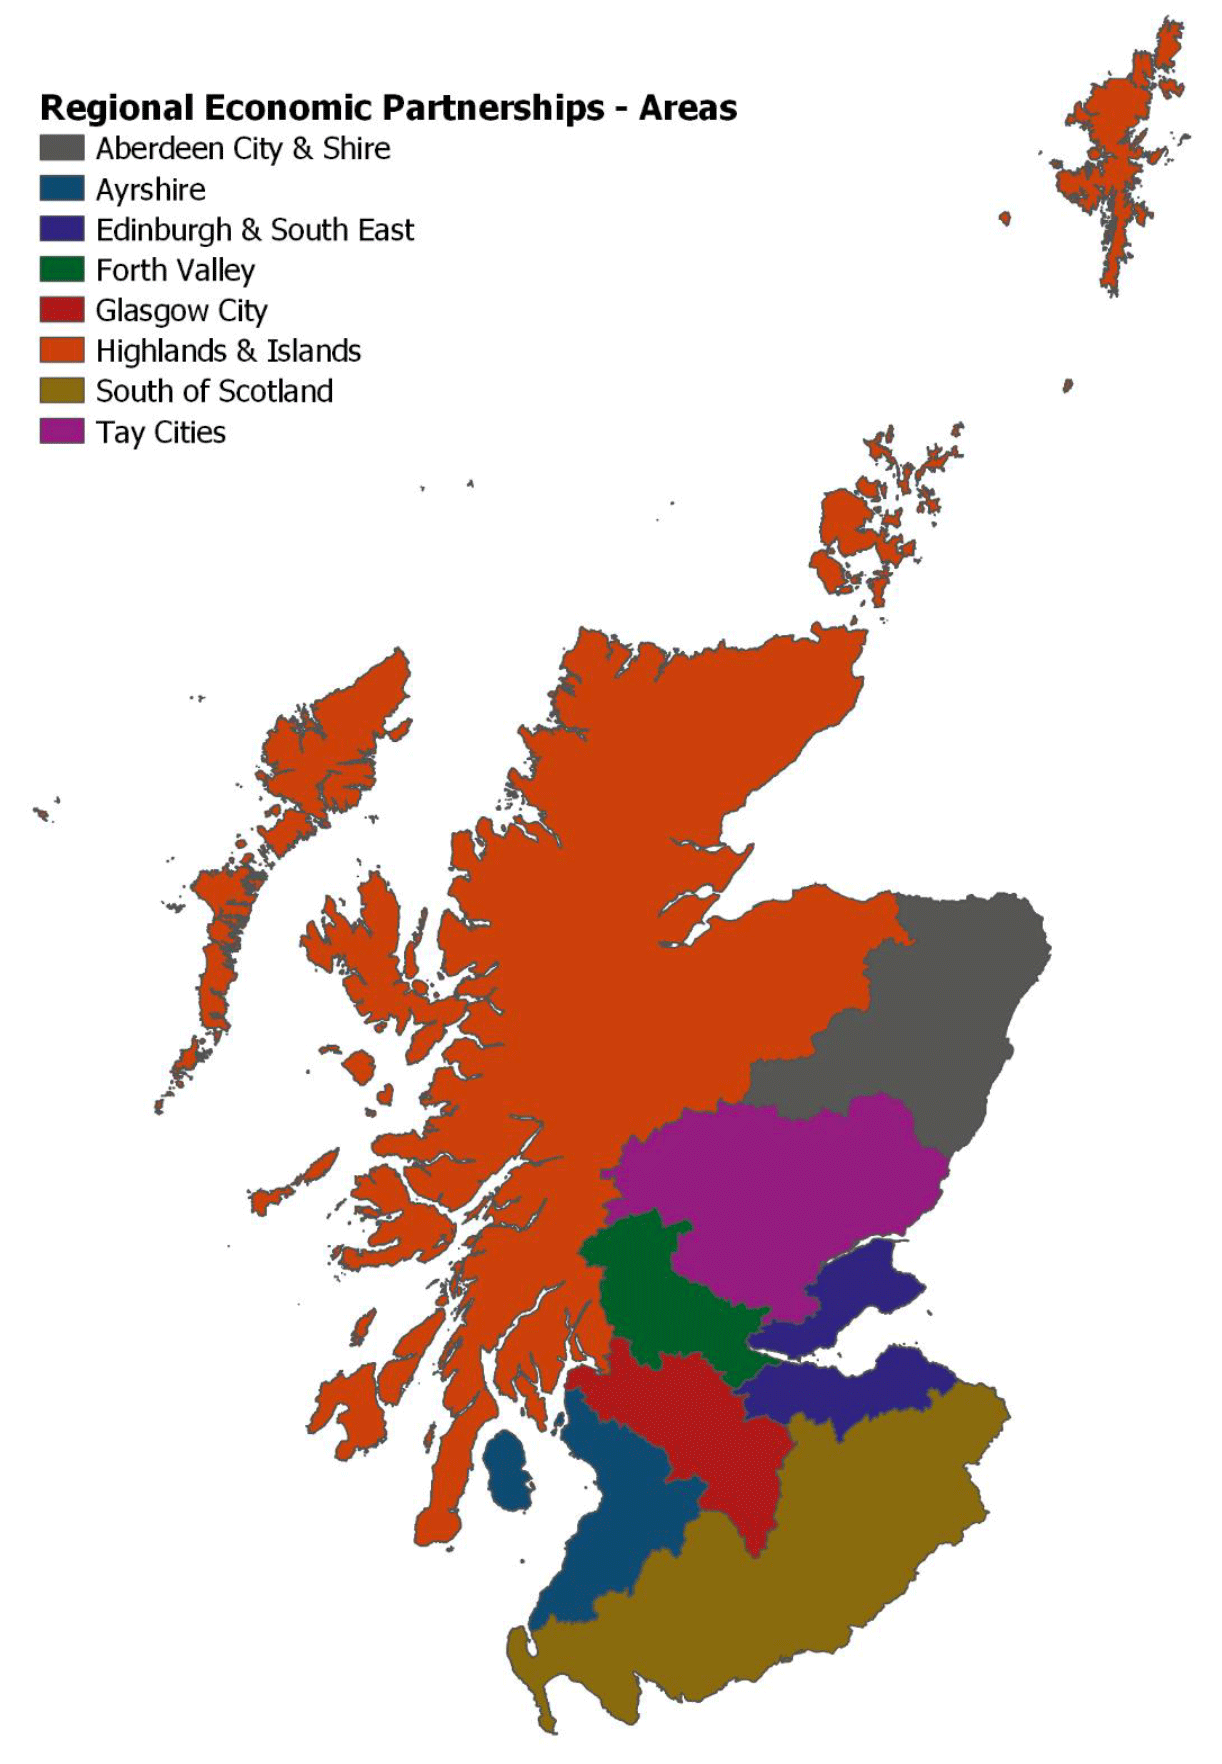
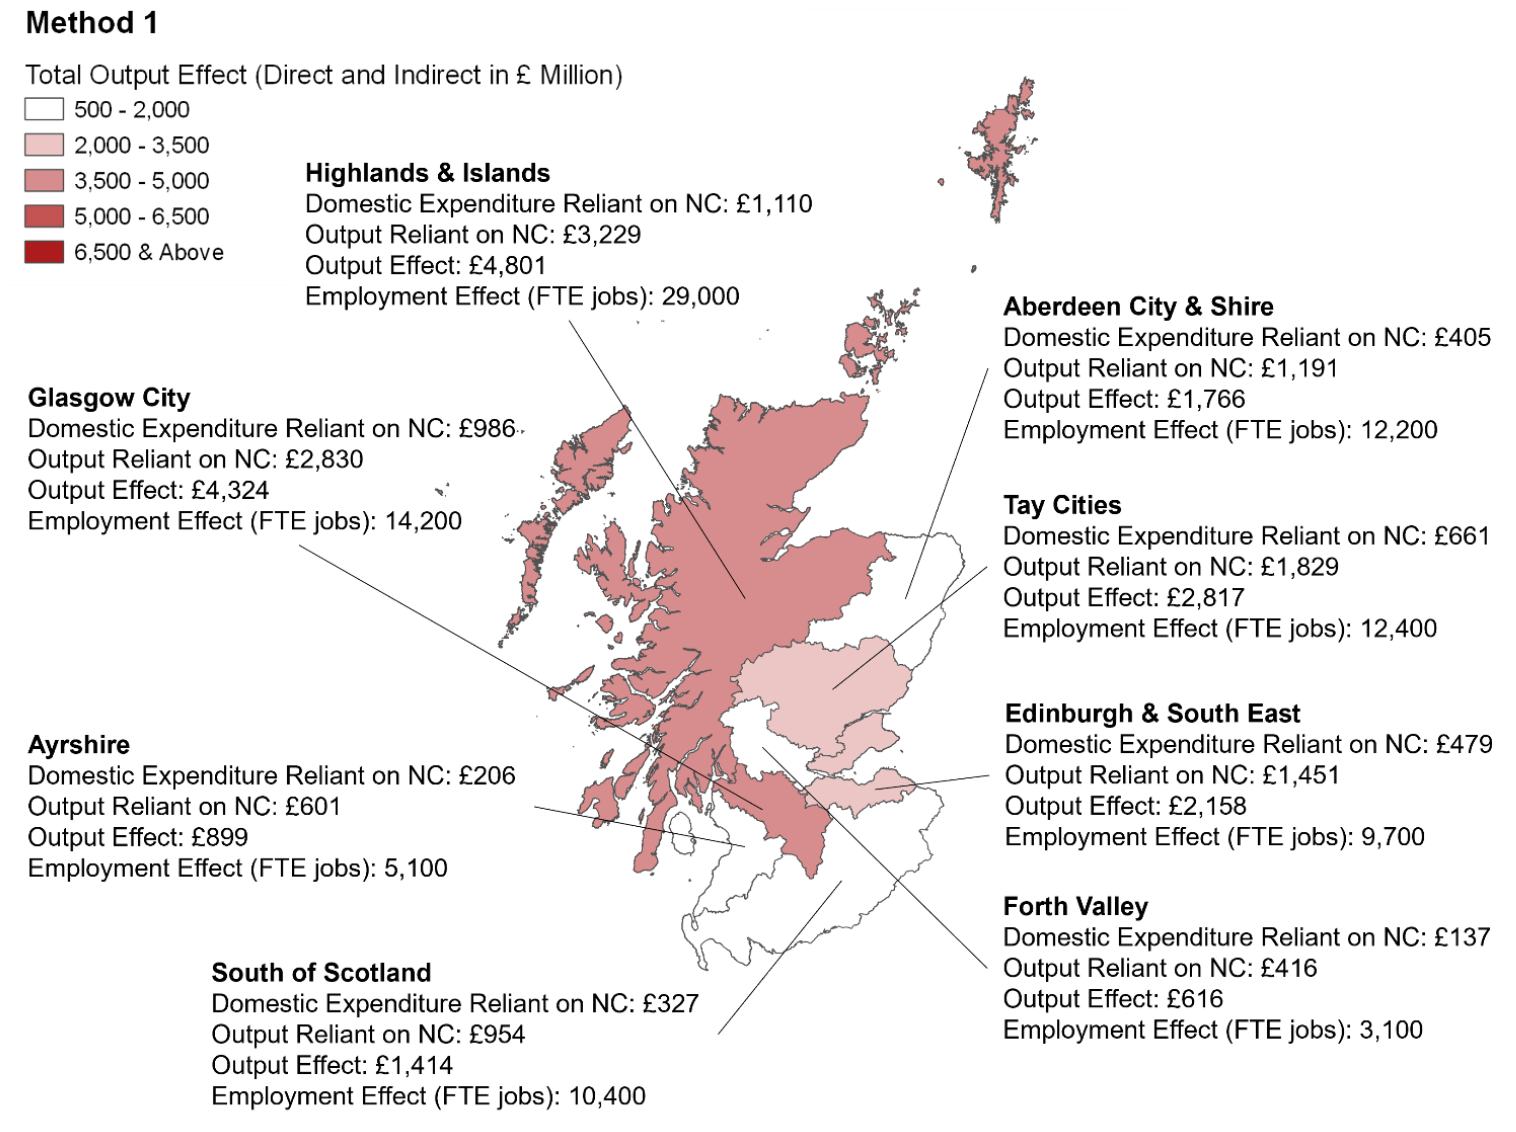
Figure 7 below illustrates how the £12.5 billion Scottish output reliant on nature, and the associated direct and indirect output and employment effects from this natural capital reliant output, were likely to be spread across the eight REPs. Appendix 5 tabulates the regional results for Method 1. The regional breakdown throughout this report was estimated using employment in corresponding industries as a proxy. Employment statistics were sourced from the Office for National Statistics Business Register and Employment survey, available on the Nomis platform.[32] Employment statistics were used to regionally apportion both output and employment effects as Gross Value Added (GVA) by industry, by REP, was not available for the required 98 industry breakdown.[33] Highlands & Islands and Glasgow City were estimated to benefit the most from the increase in output and employment.
The Highlands & Islands REP was estimated to have a total output effect (direct and indirect) reliant on natural capital of £4.8 billion, and was estimated to support 28,900 direct and indirect jobs also reliant on natural capital. This was approximately 25% of the total output effect and 30% of the total employment effect, and was largely due to the strong concentration of the agriculture, forestry planting, forestry harvesting, fishing and the aquaculture industries in this area. The strong concentration of these industries in the Highlands & Islands REP was demonstrated by 36% of the total employees in the agriculture, forestry planting, forestry harvesting, fishing and aquaculture industry in Scotland, being within the Highlands & Islands REP alone. These industries are also more labour intensive, supporting a significant employment effect in this area.
The Glasgow City REP was estimated to have a total output effect (direct and indirect) reliant on natural capital of £4.3 billion, and was estimated to support 14,200 direct and indirect jobs also reliant on natural capital. This was approximately 23% of the total output effect and 15% of the total employment effect, and was largely due to the strong concentration of the electricity, and water and sewerage industries in this area. Of these industries, approximately 39% of existing employees in Scotland were estimated to be within the Glasgow City REP. It should be noted that many of the electricity sector businesses in Scotland have their head offices located within the Glasgow City REP, with the natural capital the electricity sector relies on likely being largely located outside of the Glasgow City REP. However, the jobs within this sector in Glasgow are still reliant on this natural capital, even if it is not located in close proximity.
It should also be noted that, Aberdeen City & Shire REP has a strong presence in the forestry harvesting and fishing industry, with 40% of the total output and employment effects in the forestry harvesting and fishing industry being attributed to this REP alone.
Method 2: Natural Capital Industries’ Expenditure
Method 2 estimated Scotland’s natural capital reliance based on the domestic expenditure of sectors reliant on natural capital goods and services. The total domestic expenditure for renewable natural capital industries identified in Method 1 was included, as this expenditure would not occur without the existence of provisioning services. For all other industries, only the proportion of expenditure used to purchase natural capital goods and services in Scotland was included. Using this approach, the total domestic expenditure on natural capital industries in 2019 was £7.9 billion, or 12% of total domestic expenditure in the Scottish economy.
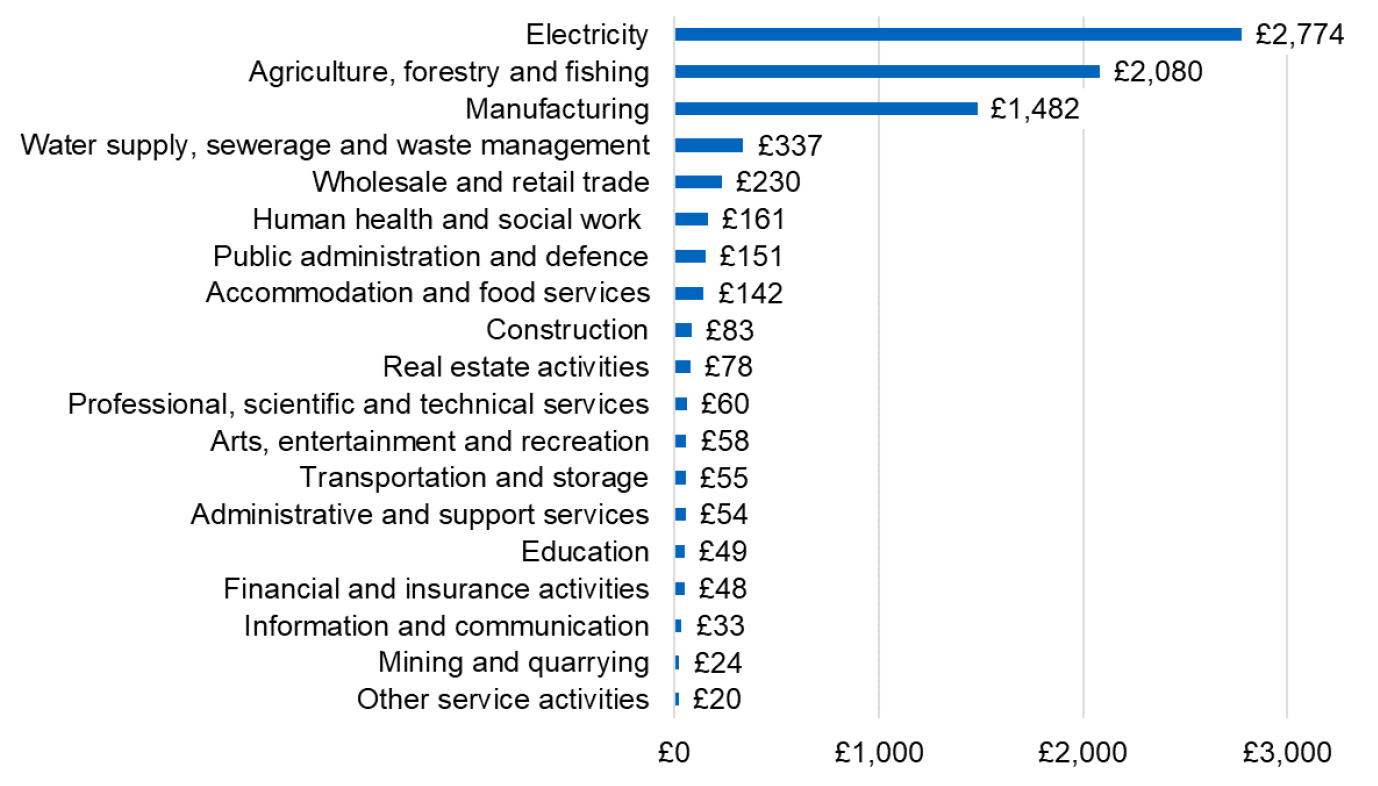
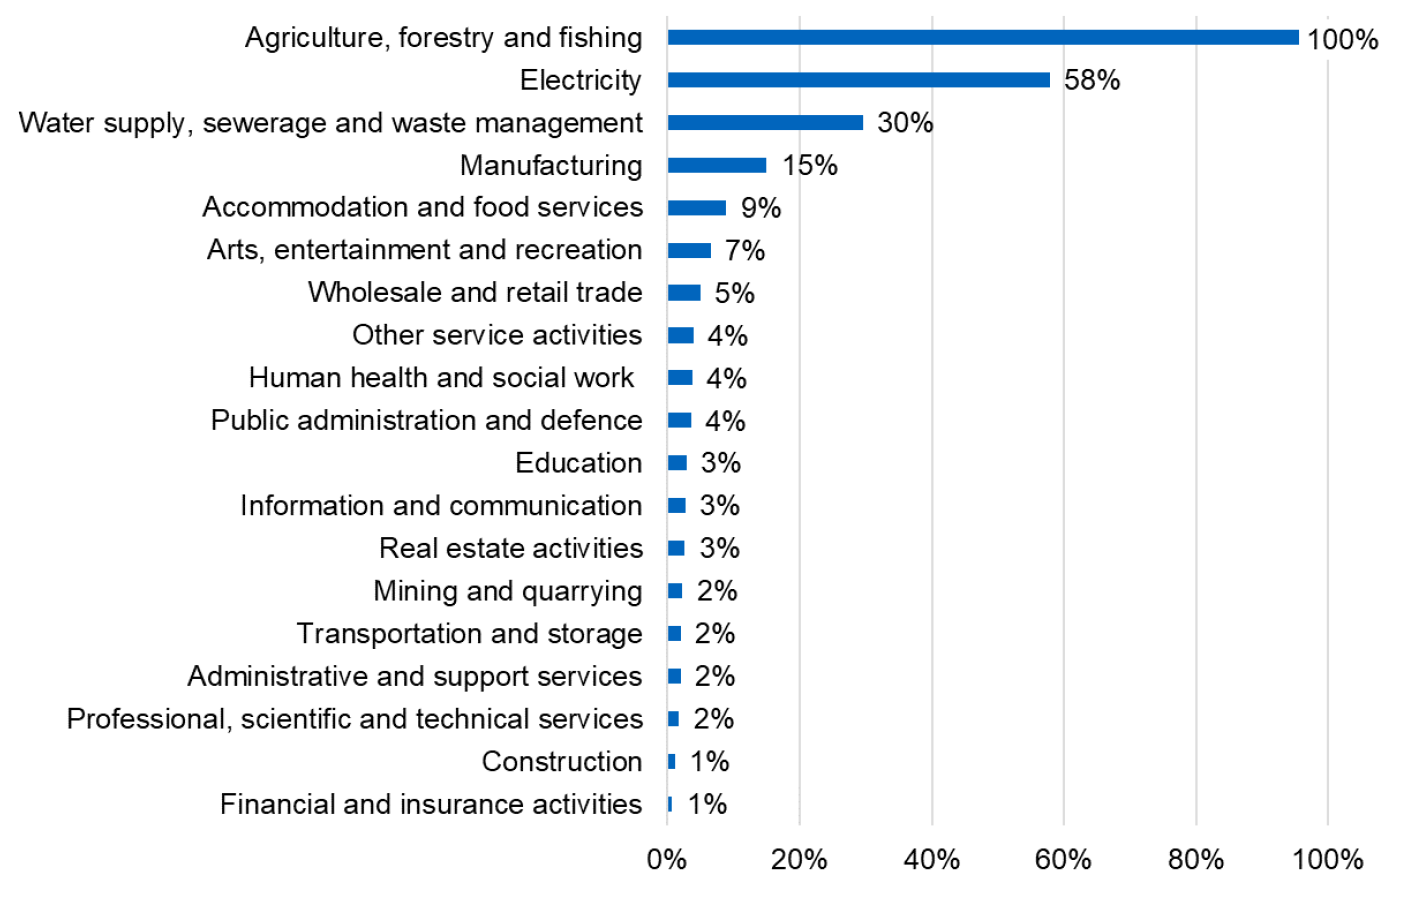
Figure 8 and Figure 9 refer to domestic expenditure on goods and services using sector level industry classifications, the broadest industry classification. On average, across the economy, natural capital expenditure was a small proportion of total domestic expenditure on goods and services (less than 5% in 12 out of 19 sectors).[34] After the electricity and the agriculture, forestry and fishing sectors (which included most industries defined in Method 1), the manufacturing sector spent the most on natural capital goods and services (at £1.5 billion, see Figure 8). This was estimated to represent 15% of total natural capital expenditure, as shown in Figure 9. By contrast, water supply, sewerage and waste management natural capital expenditure was £337 million in absolute terms, one fifth of the manufacturing sector. However, this represented a higher proportion of the sewerage and waste management sector’s total domestic expenditure (30%, see Figure 9).
Larger industries that have a relatively low reliance on natural capital inputs compared to other inputs are more natural capital reliant in absolute terms, compared to other industries in the economy. Even though less than 1% of the construction sector and the health sector’s intermediate expenditure was allocated to natural capital goods and services (Figure 9), the size of these industries increased the significance of their natural capital expenditure in absolute terms. Industry expenditure was equivalent to £83 million and £161 million, for the construction and health sector respectively (see Figure 8), representing the eighth and ninth highest spending sectors on natural capital (out of 100 industry sectors).
Apart from the seven 100% reliant on natural capital industries (defined at the SIC classification level), the industries that were most reliant on natural capital were processing and manufacturing industries that process food products. As shown in Figure 10 and Figure 11, £400 million (63%) of meat processing domestic expenditure, £89 million (61%) of dairy and fats processing domestic expenditure, and £412 million (50%) of fish and fruit processing domestic expenditure was estimated to be natural capital reliant.
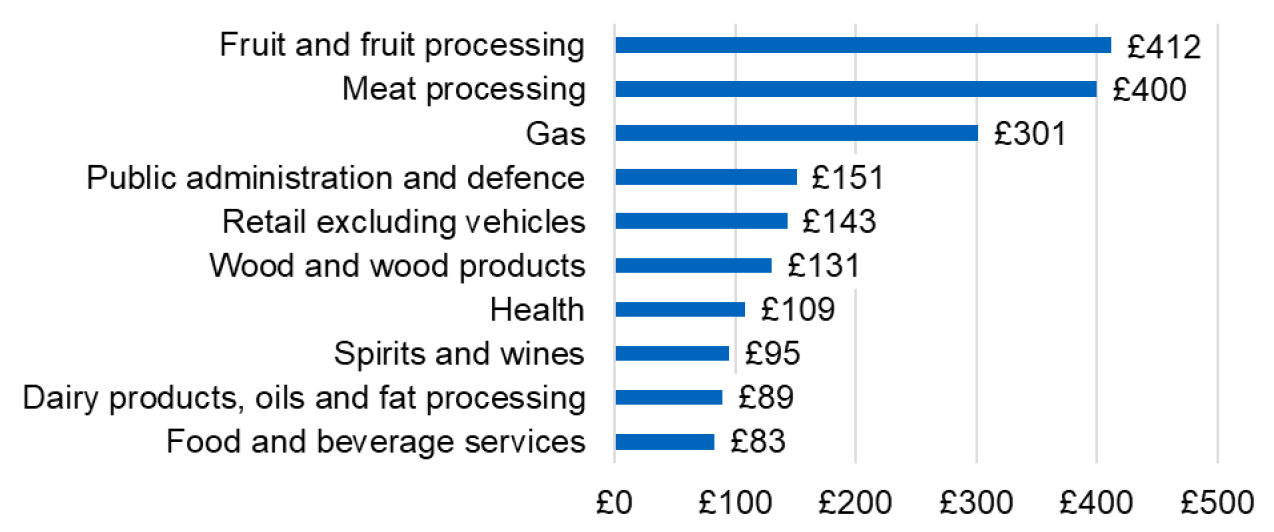
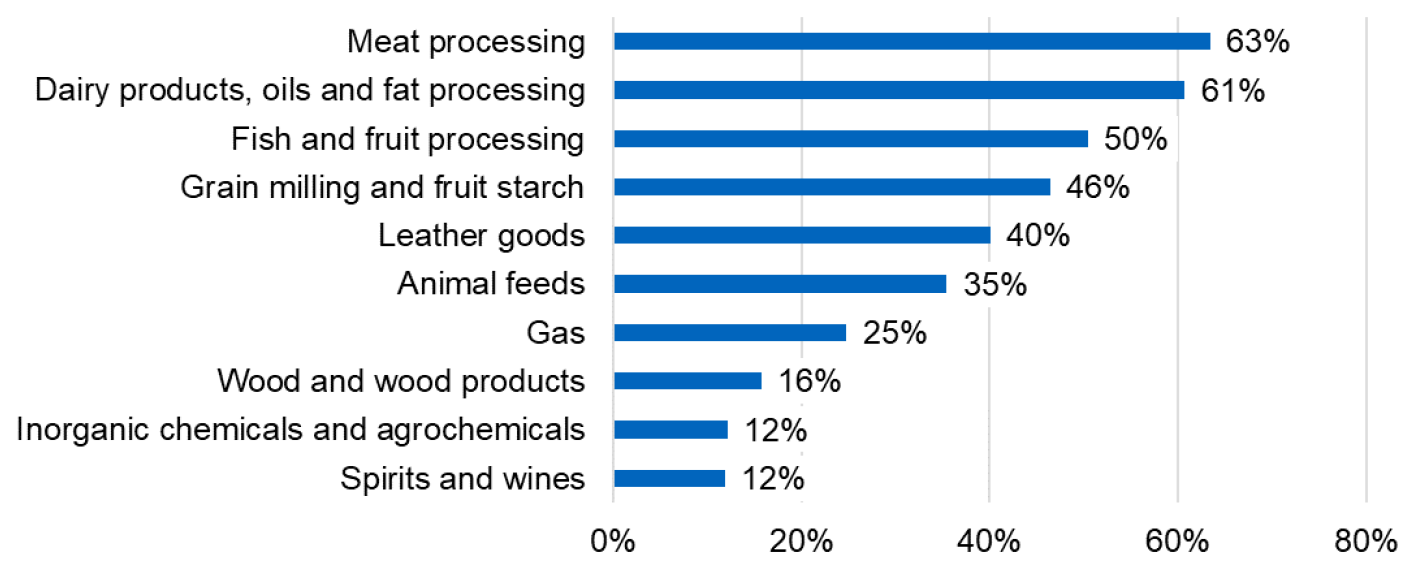
The expenditure estimates were converted to output using the ratio of total domestic expenditure to total output in the economy. Estimates assumed that natural capital reliant output as a share of total output is proportional to natural capital spend as a share of total domestic spend for a given industry.
Scottish output reliant on the economy was estimated at £25 billion, or 9% of £268 billion total Scottish output in 2019. Table 7 shows the 10 industries with the greatest difference in natural capital output between Method 1 and Method 2. This broadly reflects trends identified in Figure 10.
| Industry | Output (£ Million) |
|---|---|
| Fish and fruit processing | £868 |
| Retail excluding vehicles | £852 |
| Meat processing | £834 |
| Gas | £749 |
| Public administration and defence | £685 |
| Health | £635 |
| Spirits and wines | £533 |
| Food and beverages services | £465 |
| Imputed rent | £361 |
| Education | £358 |
Method 2 was considered a better measure of overall reliance of the Scottish economy on natural capital than Method 1. However, it was still not a complete measure, as the methodology did not include the reliance on natural capital of economic activities that are not well captured in the sector SIC codes used in the SNA data, such as the tourism sector, for example.
Economic Impact Analysis: Direct and Indirect Economic Impacts
Based on the Method 2 definition of reliance on nature, approximately £7.9 billion of Scotland’s total £64.1 billion domestic expenditure in 2019 was reliant on natural capital and £25 billion of Scotland’s total £268 billion output in 2019 (see Figure 12).[35] This £25 billion nature-reliant output would also have supported £36.5 billion for the Scottish economy (the direct and indirect output effect) and supported 231,400 direct and indirect jobs in the economy. The MS Excel model is provided in Chapter ‘A5 Economic Impact Analysis Model’. Tab “Overall Summary Results” provides a breakdown of output reliant on nature for each industry and the corresponding output and employment effect.
The largest proportion of this total £36.5 billion output effect was in the electricity sector, supporting £10.1 billion direct and indirect output, followed by the agriculture industry. Industries that were categorised as ‘Less than 100%’ reliant on natural capital industries, and identified through Method 2, supported an additional £17.7 billion direct and indirect output effect (approximately 48% of the total output effect). Of these industries classified as less than 100% reliant on natural capital, the fish and fruit processing industry had the largest output effect (direct and indirect) generated. The fish and fruit processing industry was estimated to be 50% reliant on natural capital, meaning that £844 million of the industries total £1.7 billion output in 2019 was reliant on nature, leading to a nature reliant direct and indirect output effect of £1.4 billion.
In terms of employment, the nature-reliant output supported the most jobs in the agriculture sector, followed by the electricity sector. Industries that were ‘Less than 100%’ reliant on natural capital and identified in Method 2, supported an additional 135,600 direct and indirect jobs (59% of the total job effect). The retail industry’s natural capital reliance was not captured in Method 1, but identified in Method 2 due to the industry’s reliance on natural capital goods. The retail industry had the third largest job effect (direct and indirect). This industry was estimated through Method 2 to be 8% reliant on natural capital, meaning that £828 million of the industries total £10.1 billion output in 2019 was deemed natural capital reliant. Although the retail industry’s natural capital reliance (8%) was relatively low compared to other industries, the total output from the retail industry was large, and the industry was significantly more labour reliant than other industries. Both these elements led to a large natural capital reliant employment effect, with approximately 15,500 jobs (direct and indirect) being supported by natural capital reliant output in the retail industry.
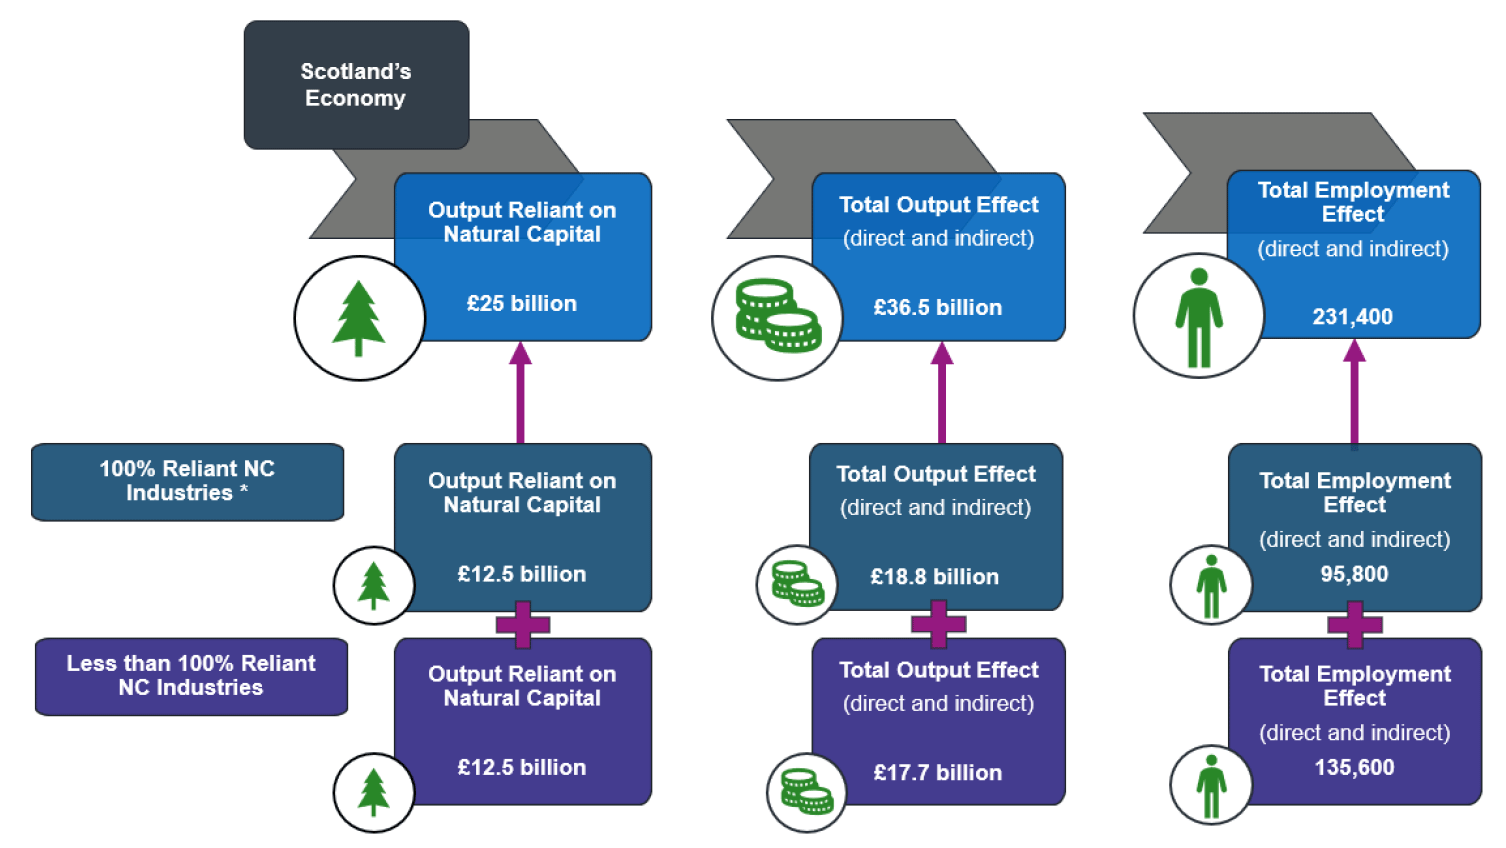
* Includes Electricity industry, excludes non-renewables.
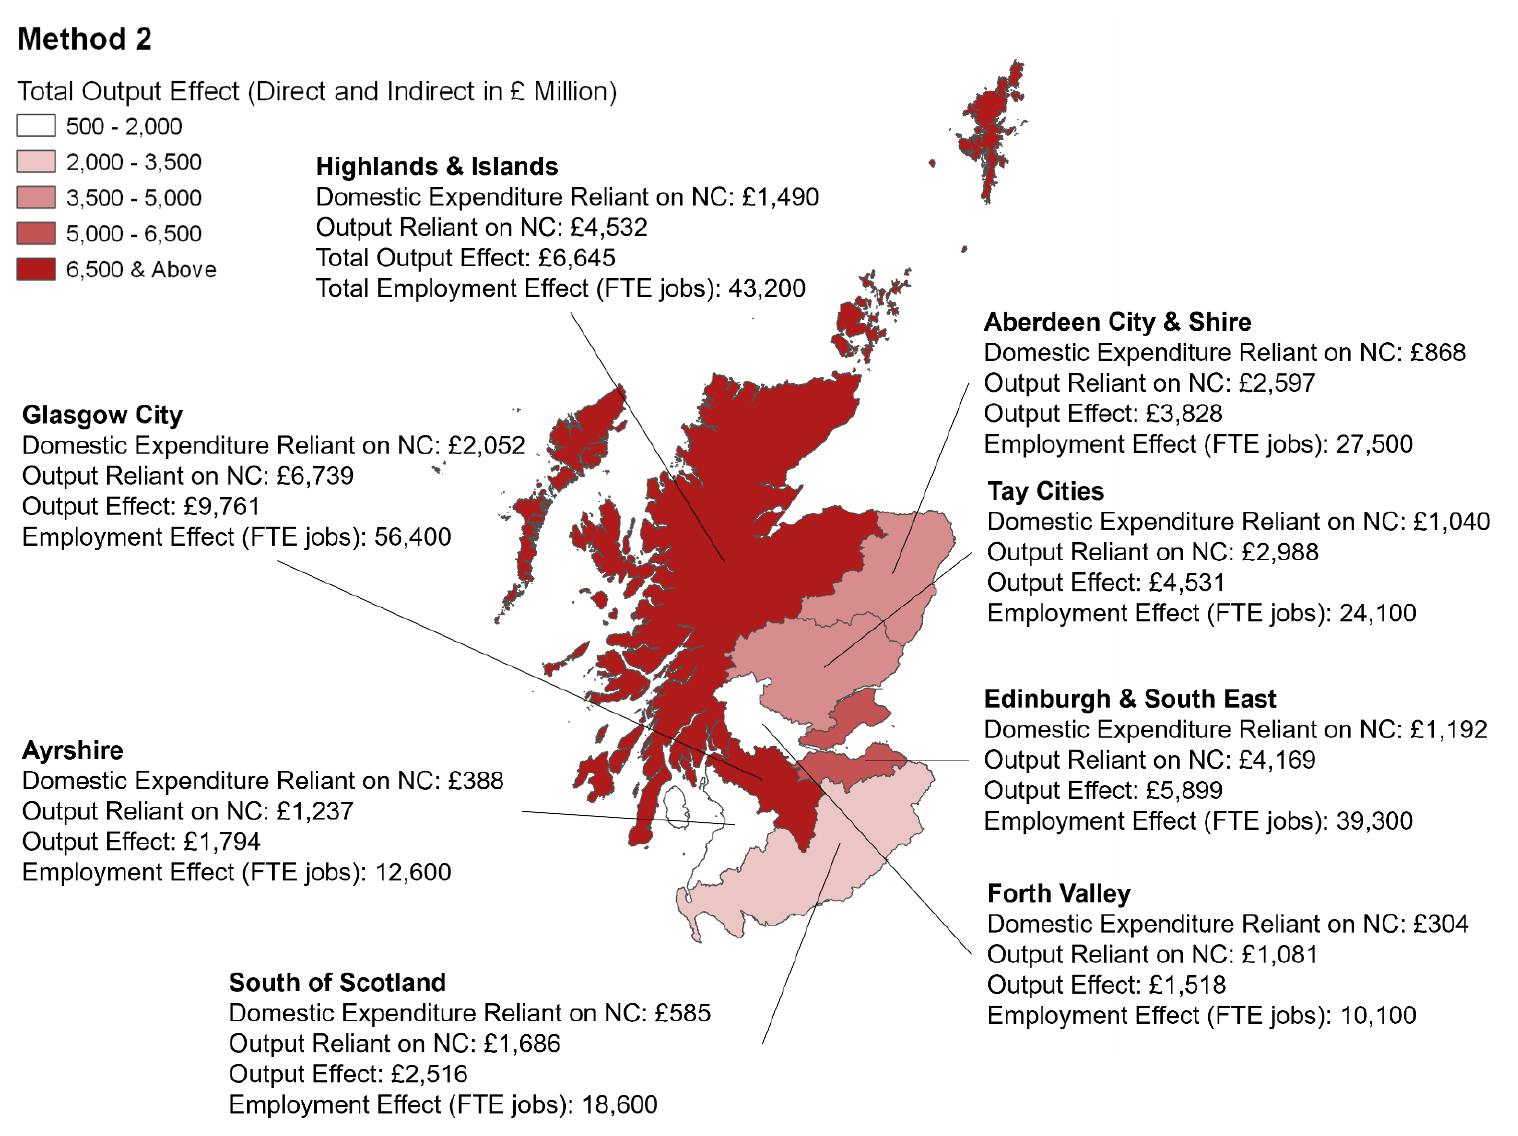
Figure 13 below illustrates the distribution of the £25 billion output found to be reliant on natural capital, and the associated output and employment effects across the eight Regional Economic Partnerships (REPs) in Scotland. Appendix 6 tabulates the regional results for Method 2. The regional breakdown was estimated using employment in corresponding industries as a proxy.[36] As identified previously in Method 1, the large output and employment effects for the Highlands & Islands and Glasgow City REPs were being driven by the agriculture and electricity industry. As previously discussed, this is because the agriculture industry and electricity industry are highly reliant on natural capital and the economic activities of these two industries are largely centred in the Highlands & Islands and Glasgow City REPs.
When looking at industries ‘Less than 100% reliant’ on natural capital identified in Method 2, the fish and fruit processing industry had the largest output effect of the industries. The fish and fruit processing industry is largely located in the Aberdeen City & Shire REP, Highlands & Islands REP, and South of Scotland REP, accounting for 77% of Scotland’s employment in the fish and fruit processing industry. Aberdeen City & Shire REP were estimated to benefit from a £519 million natural capital reliant output effect and 2,900 natural capital supported jobs (direct and indirect) from the fish and fruit processing industry alone.
Other major sectors of note in terms of regional employment effect are the retail industry and food and beverage services sectors.
The retail industry, as previously discussed, had the largest natural capital reliant associated employment effect (direct and indirect), outside of the 100% reliant industries identified in Method 1. The retail industry in Scotland is largely located in Glasgow City REP and Edinburgh & South East REP, with 57% of total Scottish retail industry employment within these two REPs. Glasgow City REP and Edinburgh & South East REP, were estimated to have benefitted from approximately 5,100 and 3,700 jobs, respectively, supported by natural capital reliant output in the retail industry.
The food and beverage services industry had the second largest natural capital reliant associated employment effect (direct and indirect), outside of the 100% reliant industries identified in Method 1. The food and beverage services industry in Scotland, like the retail industry, is largely located in Glasgow City REP and Edinburgh & South East REP, with 59% of total Scottish food and beverages services industry employment within these two REPs. Glasgow City REP and Edinburgh & South East REP, are estimated to have benefitted from approximately 3,000 and 2,400 jobs supported from natural capital reliant output in the food and beverage services industry.
Method 3: Measuring reliance on Natural Capital ecosystem services
Method 3 provided the broadest view of economic reliance on natural capital. It did so by using a qualitative assessment of ecosystem dependence for each industry sector to estimate the industry expenditure that was reliant on Scotland’s natural capital but did not relate to purchases of provisioning services.
Method 3 built on Method 2 by applying a judgement-based assessment of natural capital reliance to each industry. A key output of this assessment was an index reflecting an industry’s natural capital reliance based on non-market factors (i.e., outside of the SNA production boundary). As this index measured reliance on factors that were not captured in the market, it is not recommended that the index be compared to expenditure values, or to the share of domestic expenditure, and should be interpreted with caution. The index is useful to compare the degree of natural capital reliance on non-market factors across sectors.
The industries with the highest scores on the index had a greater breadth and depth of reliance on natural capital. These were measured by the number of ecosystem services, and the importance of reliance ecosystem services to production processes, respectively. As shown in Table 8, the industries that are most dependent on natural capital included agriculture, fishing and aquaculture (88%), forestry and forestry harvesting and wood and wood products (59%), water and sewage (40%) and spirits and wine and beer and malt sectors (30%).
The index was assessed across 21 ecosystem services (see Figure 4). All of these services were considered important for the agricultural and aquaculture and fisheries sectors – 15 had a materiality rating of “very high”, and this was considered the only industry sector that relied directly on pollination. Forestry planting and forestry harvesting (the second highest) each relied on 15 ecosystem services, 10 of which had a materiality rating of “very high”. The ENCORE database broadly classified agricultural processes encompassing both agriculture and aquaculture and fisheries products. A limitation of the current study is that the ENCORE structure was not tailored to Scotland, and therefore may not capture important relative differences in materiality. For example, there may be differences between sectors dependencies in the marine and land environments. Furthermore, flood and storm protection was rated as moderately important for some sectors (e.g., beer and malt and spirit and wine industries), but this ecosystem service could be considered more important in Scotland.
While renewable energy, particularly in the form of wind energy, is important to the Scottish economy, the electricity sector only relied on 9 of the 21 ecosystem services. Water flow maintenance, climate regulation, and flood and storm protection were considered highly important for the electricity sector.
In the ENCORE database, beer and malt and spirit and wine industries had identical ecosystem service profiles, with ground and surface water being the most important ecosystem services to production. These industries were a small selection of industries (two of eight) that relied on genetic materials for production, as certain crops – such as barley – are known to contribute to the flavour of beer and some types of spirits, including whisky.[37]
| Materiality Score | Number of dependent ecosystem services(a) | ||||||
|---|---|---|---|---|---|---|---|
| Industry | (out of 105) | (%) | Very low (1) | Low (2) | Moderate (3) | High (4) | Very High (5) |
| Agriculture | 92 | 88% | 0 | 1 | 5 | 0 | 15 |
| Fishing | 92 | 88% | 0 | 1 | 5 | 0 | 15 |
| Aquaculture | 92 | 88% | 0 | 1 | 5 | 0 | 15 |
| Forestry planting | 62 | 59% | 1 | 0 | 1 | 2 | 10 |
| Forestry harvesting | 62 | 59% | 1 | 0 | 1 | 2 | 10 |
| Wood and wood products | 62 | 59% | 1 | 0 | 1 | 2 | 10 |
| Water and sewerage | 42 | 40% | 0 | 4 | 5 | 1 | 3 |
| Electricity | 32 | 30% | 1 | 2 | 1 | 1 | 4 |
| Spirits and wines | 31 | 30% | 0 | 3 | 5 | 0 | 2 |
| Beer and malt | 31 | 30% | 0 | 3 | 5 | 0 | 2 |
| Repairs - personal and household | 31 | 30% | 2 | 3 | 5 | 2 | 0 |
| Textiles | 29 | 28% | 0 | 5 | 3 | 0 | 2 |
| Leather goods | 29 | 28% | 0 | 5 | 3 | 0 | 2 |
| Meat processing | 28 | 27% | 1 | 4 | 3 | 0 | 2 |
| Fish and fruit processing | 28 | 27% | 1 | 4 | 3 | 0 | 2 |
| Dairy products, oils and fats processing | 28 | 27% | 1 | 4 | 3 | 0 | 2 |
| Grain milling and starch | 28 | 27% | 1 | 4 | 3 | 0 | 2 |
| Bakery and farinaceous | 28 | 27% | 1 | 4 | 3 | 0 | 2 |
| Other food | 28 | 27% | 1 | 4 | 3 | 0 | 2 |
| Soft drinks | 28 | 27% | 1 | 4 | 3 | 0 | 2 |
Note: (a) Numeric values for ecosystem service materiality scores are in brackets.
Source: Adapted from ENCORE.
The ENCORE industry scoring was applied at the global level. It is possible that the materiality could be further tailored for the Scottish economy. A preliminary review of evidence was undertaken that could be considered in the adjustment of materiality weightings predetermined by ENCORE, according to:
1. The number of ecosystem services considered for the analysis.
2. The importance of high-quality natural capital to the product value;
3. Substitutability of the natural capital that the sector relies on; and
The application of these criteria to potentially tailor the ENCORE database is explained using a worked example of the beer and malt sector (see Box 3: Application of ENCORE Database to Scotland Using the Beer and Malt Sector).
Box 3: Application of ENCORE Database to Scotland Using the Beer and Malt Sector
The ENCORE database identified 10 ecosystem service dependencies for the beer and malt Sector, outlined below. Other ecosystem services that were not identified in this list could be more relevant to Scotland. For example, temperature regulation (a component of the ENCORE climate regulation ecosystem service) is important for the fermentation process, which typically occurs below 20 degrees Celsius and is well-suited to Scotland’s climate. In turn, it could be considered an additional ecosystem service considered for the sector in Scotland.

2. The importance of high-quality natural capital to product value
High-quality natural capital is important for the beer and malt sector in terms of product value. Stable air and water temperatures are important for high quality beer production air filtration and good water quality services during the malting and fermentation stages. For example, one of Glasgow-based Tennent’s selling points is sourcing water from Loch Katrine, an ancient source of pure highland water. The company remains the top choice for Scottish consumers and its lager is a valuable drink brand in Scottish pubs and bars. Scores for “filtration” and “surface water quality” could be adjusted on this basis upon further expert review.
3. Substitutability of ecosystem dependent flows for physical capital
Arguably, natural capital for the beer and malt sector is not easily substituted. Natural capital and associated ecosystem services (e.g., air filtration and water flow regulation services) cannot be substituted for physical capital for undertaking economic activity (i.e., production). Tennent’s (and many other Scottish breweries) depend on extracting water from local water sources (e.g., Loch Katrine) for beer production and uses malted barley supplied by local farmers.
While a desktop review was a starting point, the evidence for sectoral dependency on ecosystem services is not consistent for all 98 sectors outlined in the Scottish Supply-Use Tables. To adjust ENCORE scoring for Scotland specific context, further Scottish expert judgement and analysis is recommended to provide input on the materiality scoring for individual industry sectors to fill data gaps (see Chapter ‘Conclusions & Recommendations for Future Work’).
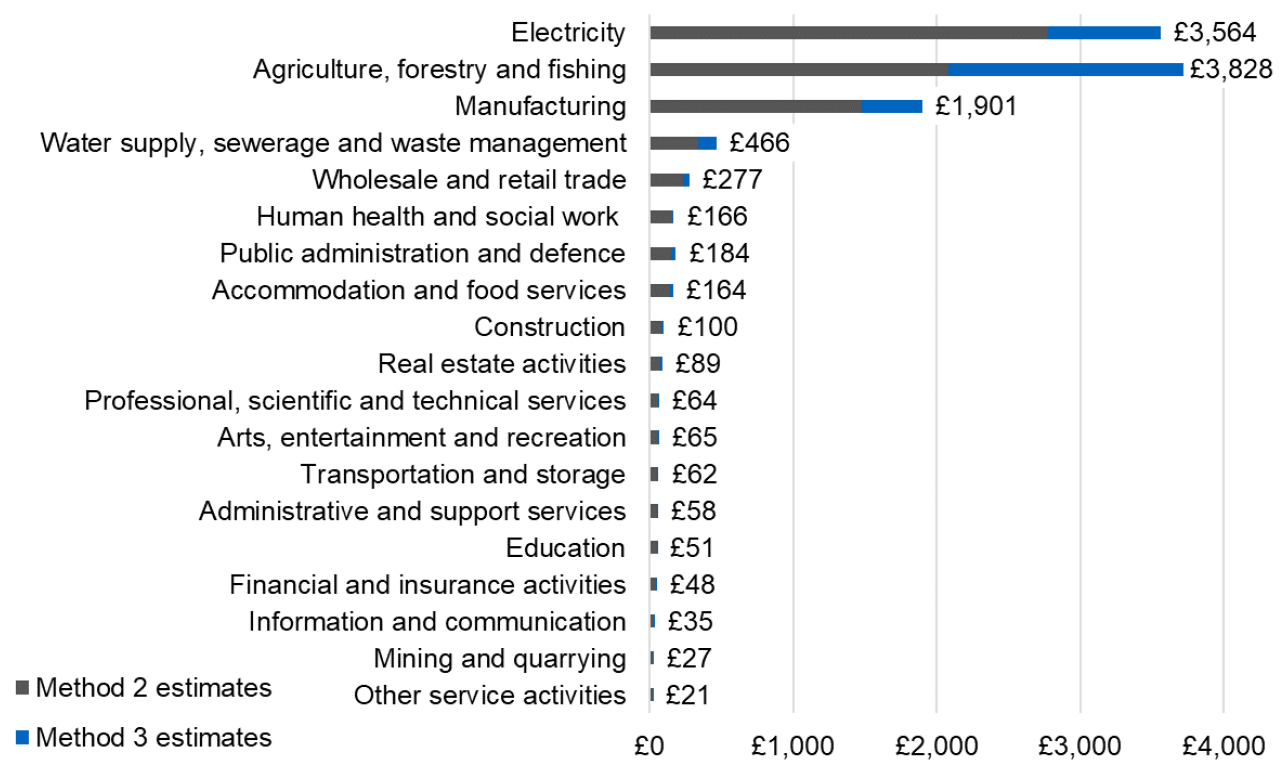
In an experimental approach, the index was used to increase monetary estimates from Method 2 to increase the total value. Note that this value does not reflect a market exchange that occurred in the economy, but a reflection of the potential additional value provided by nature that is not captured in market terms. This comparison was aggregated to industry levels, classified by SIC ‘sections’, and represented in the Method 3 estimates in Figure 14.
Economic Impact Analysis: Direct and Indirect Economic Impacts
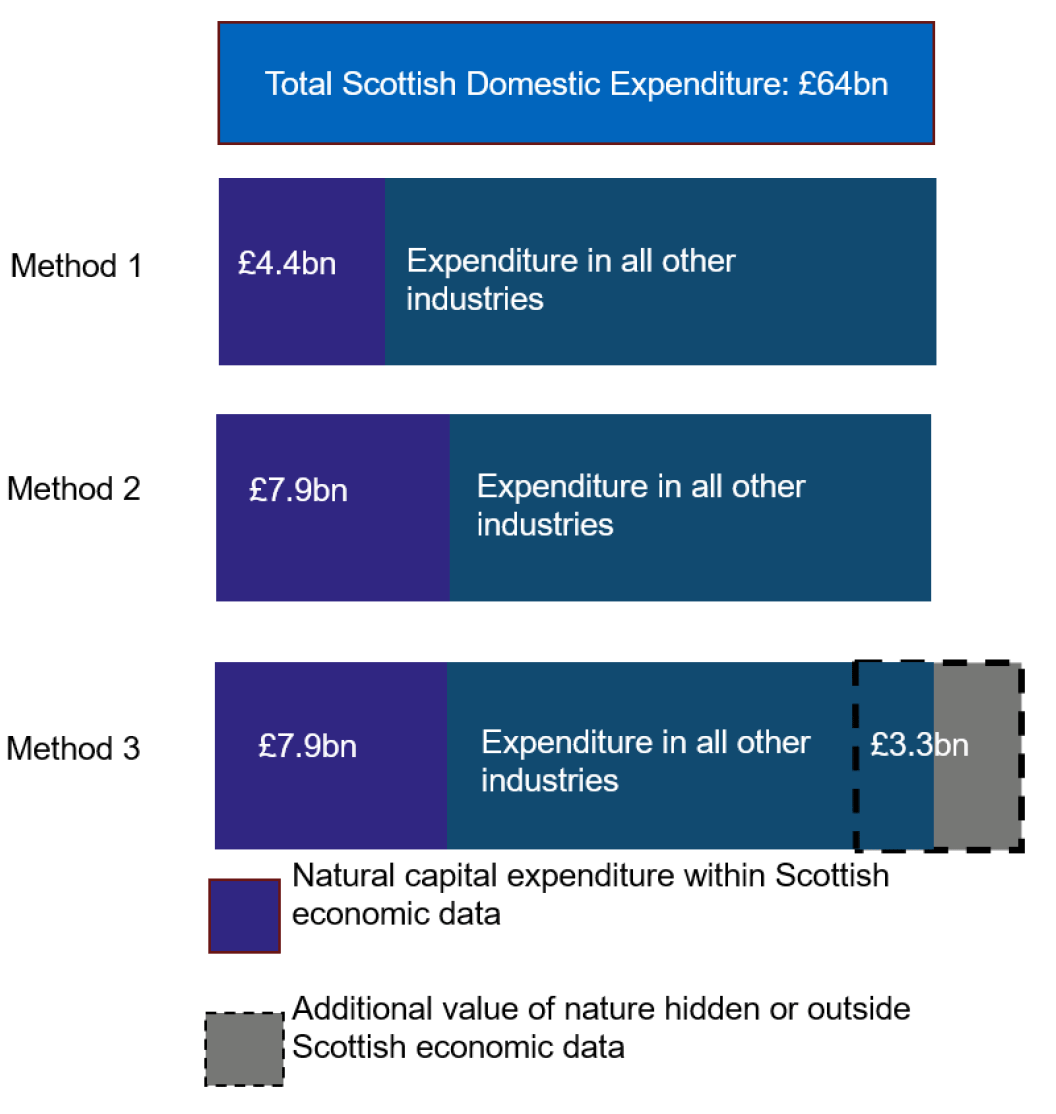
As mentioned earlier, Method 3 built on Method 2 by capturing the industry’s natural capital reliance based on factors that are not captured in the market (i.e., outside of the SNA production boundary). Method 3 expanded the measured size of Scotland’s domestic expenditure in industries that provide natural capital goods and services – from £7.9 billion under Method 2, to £11.2 billion under Method 3. This additional £3.3 billion represents the additional value of ecosystem services (e.g., surface water, flood and storm protection, water flow maintenance, ground water and erosion control) not captured within existing Scottish economic data (SNA). This domestic expenditure on natural capital can be considered as either: hidden within Scotland’s economic data boundary (SNA); or lying outside the envelope of the economy altogether.[38]
Figure 15 below shows the uplift in expenditure on natural capital related sectors for each of the three methods. Table 9 below shows the uplift in Scottish output reliant on natural capital across the three methods. Method 3 uplift has some important implications for the Scottish economy. The uplift value captures value of natural and ecosystem services that would otherwise require man-made solutions such as engineering solutions or nature-based solutions, for example constructed flood defences, or water purification systems to maintain water quality. It captures value from nature that avoid damage to assets or disrupt the economy (e.g., climate regulation, disease & pest control). It also includes value from nature that cannot be substituted by humans, such as genetic materials and bio-remediation.
| (£ Million) | Output of Industries Reliant on Natural capital (£bn) | Total Scotland Output (£bn) | Natural Capital Output as a % of Scottish output | Output Effect (direct and indirect) (£bn) | Employment Effect (direct and indirect) |
|---|---|---|---|---|---|
| Method 1 | 12.5 | 268 | 5% | 18.8 | 95,800 |
| Uplift between Method 1 and 2 | +12.5 | +17.7 | +135,600 | ||
| Method 2 | 25.0 | 268 | 9% | 36.5 | 231,400 |
| Uplift between Method 2 and 3 | +£9.6 2.6 (Substitutable) 7 |
+3.6* | +30,200* | ||
| Method 3 | 34.6 | 278 | 12% | 40.1 | 261,600 |
Note: “substitutability” refers to when it was considered possible to substitute the ecosystem services with physical capital; while “non-substitutability” refers to when production processes cannot take place without the ecosystem service.
*Output and employment effect of substitutable share of nature related output only.
The additional £3.3 billion domestic expenditure would generate £9.6 billion output in the Scottish economy under this method. This additional amount captured the regulating and cultural ecosystem services’ values, and was estimated using the ENCORE database and methodology outlined above. Regulating and cultural ecosystem services are vital for industrial production but were not explicitly captured within the traditional economic approaches using the System of National Accounts’ conceptual and technical boundary. To capture output and employment effects related to this additional £9.6 billion output identified in Method 3, output and employment effect multipliers could not be applied in the same way to Method 3 as they were applied in Methods 1 and 2 as this additional identified output sits outside the System of National Accounts’ boundary.
One way of recognising the value of this additional £9.6 billion of output reliant on natural capital – in a traditional economic systems of account – was to estimate the share of this value that could be substituted by certain industries through human capital such as engineering solutions (e.g., constructing artificial flood defences), and/or nature-based solutions (e.g., catchment tree planting). The ENCORE database had a marker for the substitutability for some of these services, further information on this can be seen in Appendix 3.[39] Looking at the industries that rely on certain ecosystem services that could be substituted provided a proxy for the output and employment effects for the additional £9.6 billion Scottish output identified. Based on this approach, £2.6 billion (or 27% of the additional £9.6 billion Scottish output) was identified as being substitutable. Industries that had substitutable ecosystem services were mapped to human capital and/or nature-based solutions that could be used to provide these ecosystem services if the natural capital was lost and/or degraded.[40] These substitutes were then mapped to SIC codes and corresponding output and employment multipliers were used.[41] The MS Excel model is provided in Chapter ‘A5: Economic Impact Analysis Model’. Tab “Substitutions_All” provides a full breakdown of substitutions and mapped SIC codes for every industry.
Using the textiles industry as an example, the ecosystem services that were substitutable from ENCORE were:
- fibres and other materials
- flood and storm protection, and
- water flow maintenance.
For the ecosystem service fibres and other materials, we identified the activities that could substitute the service. These included activities such as increasing production/purchasing of synthetic fibres, increased research and development into synthetic fibres, and increased insurance for crop damages. These activities were then mapped to corresponding SIC codes.
Table 10 below shows all substitutions and all mapped SIC codes for the fibres and other materials ecosystem service for the textiles industry, as an example of one of the ecosystem services for the textiles industry (see Table 17 for comprehensive mapping of all ecosystem services). Output and employment multipliers for these mapped SIC industries were used to estimate the output and employment effect. As noted, it was assumed that each mapped SIC code had an equal weighting.
| Ecosystem Service | Industry Process Reliant on Ecosystem Service | Human Capital and/or Natural Capital Substitution | Mapped SIC Code |
|---|---|---|---|
| Fibres and other materials | Natural fibre production |
|
|
This process was repeated for the other ecosystem services identified as substitutable in the textile industry, flood and storm protection, and water flow maintenance. For flood and storm protection, human capital and/or nature-based solutions such as engineering natural flood management (e.g., river meandering, tree planting), constructing artificial flood defences, and increasing crop/livestock insurance, were identified. These were mapped to SIC codes such as silviculture and other forestry activities (SIC code 2.1), construction of utility projects (42.2), and insurance (65.1).
For the ecosystem service water flow maintenance, substitutes such as increasing water storage at reservoirs and dams, and installing solutions to harvest rainwater, were identified. These were mapped to SIC codes such as water collection, treatment and supply (36), and construction of utility projects (42.2). Table 17 provides a full breakdown of the textiles industry substitutions and mapped SIC codes.
The approach noted above was undertaken across the entire Scottish economy, and £2.6 billion of the additional £9.6 billion identified in Method 3 was found to be substitutable. From this £2.6 billion, an output effect (direct and indirect) of £3.6 billion was estimated and an employment effect of an additional 30,200 jobs estimated.[42] The MS Excel model is provided in Chapter ‘A5: Economic Impact Analysis Model”. Tab “Regional Breakdown” provides for a full breakdown of substitutable expenditure and non-substitutable expenditure, as well as output and employment effect by industry.
The agricultural sector, at £1.9 billion, accounted for 53% of the total additional £3.6 billion output effect. This sector relies the most on ecosystem services that are not accounted for, or are hidden in SNA production boundary. Of all the 21 ecosystems services the agriculture sector relies on, 8 out of the 21 were found to be substitutable. The MS Excel model is provided in Chapter ‘A5: Economic Impact Analysis Model’. Tab “Substitutions_All” shows the ecosystem services that were found to be substitutable. A significant proportion of the direct and indirect output effect was attributed to the agriculture sector, owing to a combination of:
- a large agriculture sector in Scotland (in terms of total Scottish output in this sector);
- the industry’s high reliance on natural capital products (as identified in Methods 1 and 2);
- high reliance on ecosystem services (as identified in Method 3); and
- having many ecosystem services which were substitutable.
The aquaculture industry accounted for approximately £568 million (or 16%) of the additional £3.6 billion output effect. This large output effect was due to the same reasons as the agriculture sector. The aquaculture industry is not as large as the agriculture sector in Scotland, but as with the agriculture sector, highly reliant on natural capital products and ecosystem services.
In terms of employment, an additional 30,200 jobs were estimated from the £2.6 billion substitutable amount. As with the output effect, the agriculture industry and aquaculture industry made up the highest proportion of these jobs, with 15,700 jobs, or 52% of the total additional 30,200 jobs in the agriculture industry, and 4,700 jobs, or 16% of the total in the aquaculture industry. These industries made up a large proportion for similar reasons as those stated above. They are highly reliant on natural capital and have a high share of ecosystem services that can be substituted. The industries are both also largely labour-intensive industries.
To summarise, Method 3 identified an additional £9.6 billion of output in Scotland reliant on natural capital. This additional amount is either hidden in the SNA production boundary or is beyond this boundary and not accounted for. This takes the total amount of output reliant on natural capital to £34.6 billion. Of this additional £9.6 billion, £2.6 billion (27%) can be substitutable. Using this as a proxy, an additional indirect and direct output effect of £3.6 billion and an additional direct and indirect employment effect of 30,200 jobs supported were estimated. This took the total estimated direct and indirect output effect to £40.1 billion (£36.5 billion estimated from Methods 1 and 2 + £3.6 billion from Method 3), and total direct and indirect employment effect to 261,600 jobs (231,400 estimated from Methods 1 and 2 + 30,200 jobs from Method 3). Figure 16 below demonstrates this.
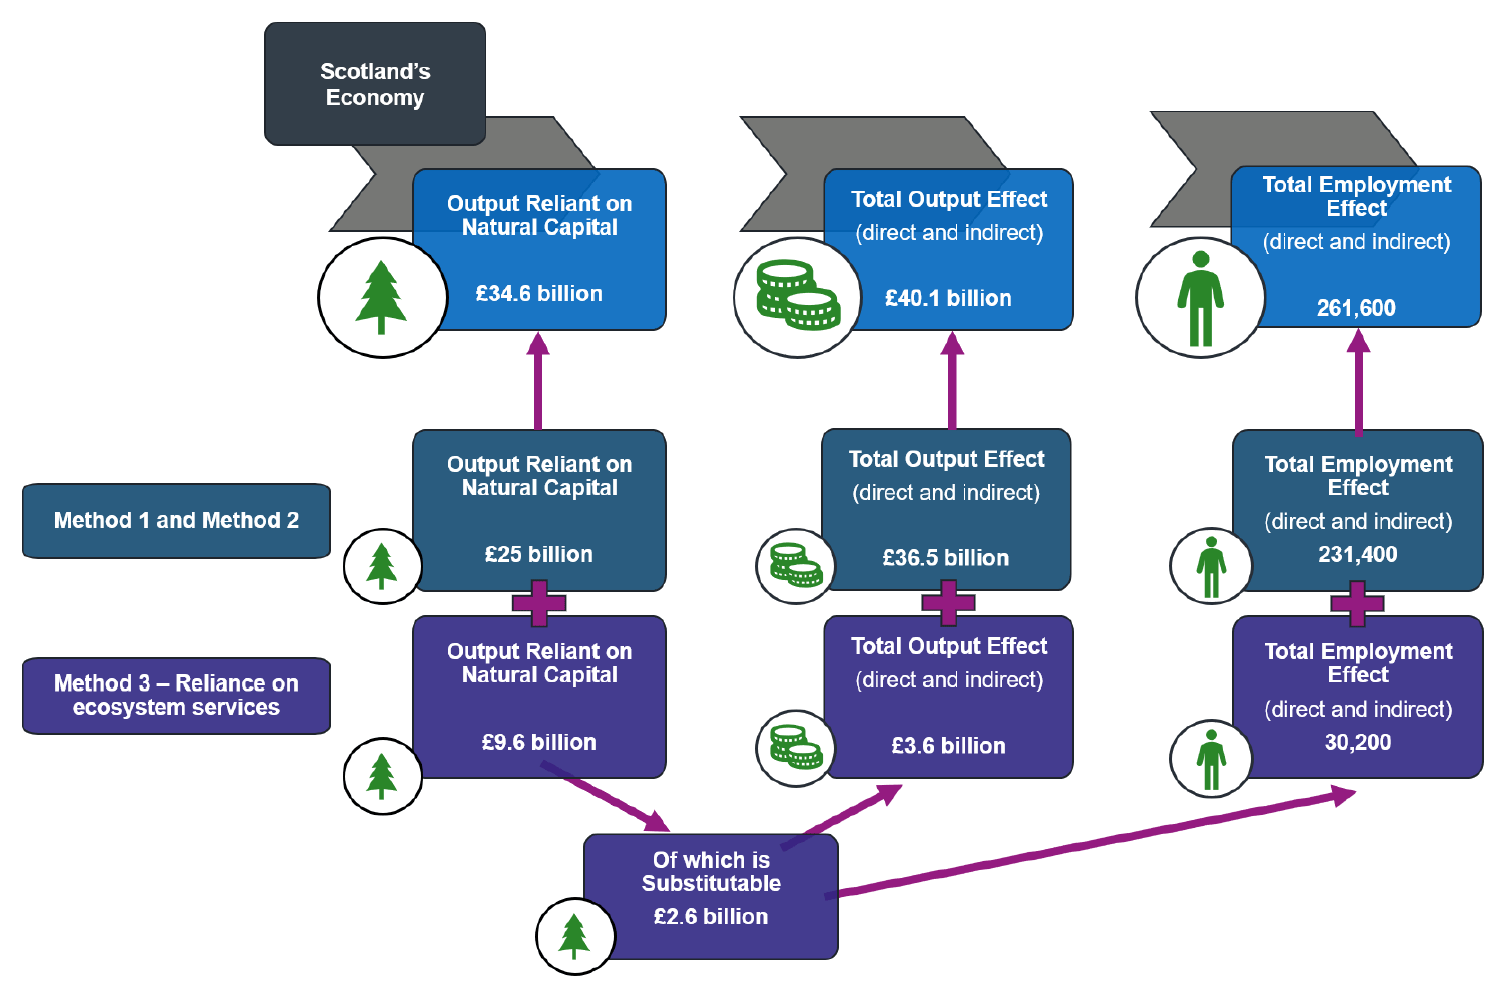
Figure 17 below illustrates the distribution of the £34.6 billion output found to be reliant on natural capital, and the associated output and employment effects across the eight Regional Economic Partnerships (REPs) in Scotland. This figure shows the combined results from Method 1, Method 2 and Method 3’s definition of industry natural capital reliance [43]. Appendix 8 tabulates the regional results for Method 3. The regional breakdown, as with other methods, was estimated using employment in corresponding industries as a proxy [44]. As identified through Method 1 and Method 2 definition analysis, Highlands & Islands and Glasgow City, continued to have the largest share of output effect and employment effect, due to these areas’ economic reliance on the agriculture industry and electricity industry.
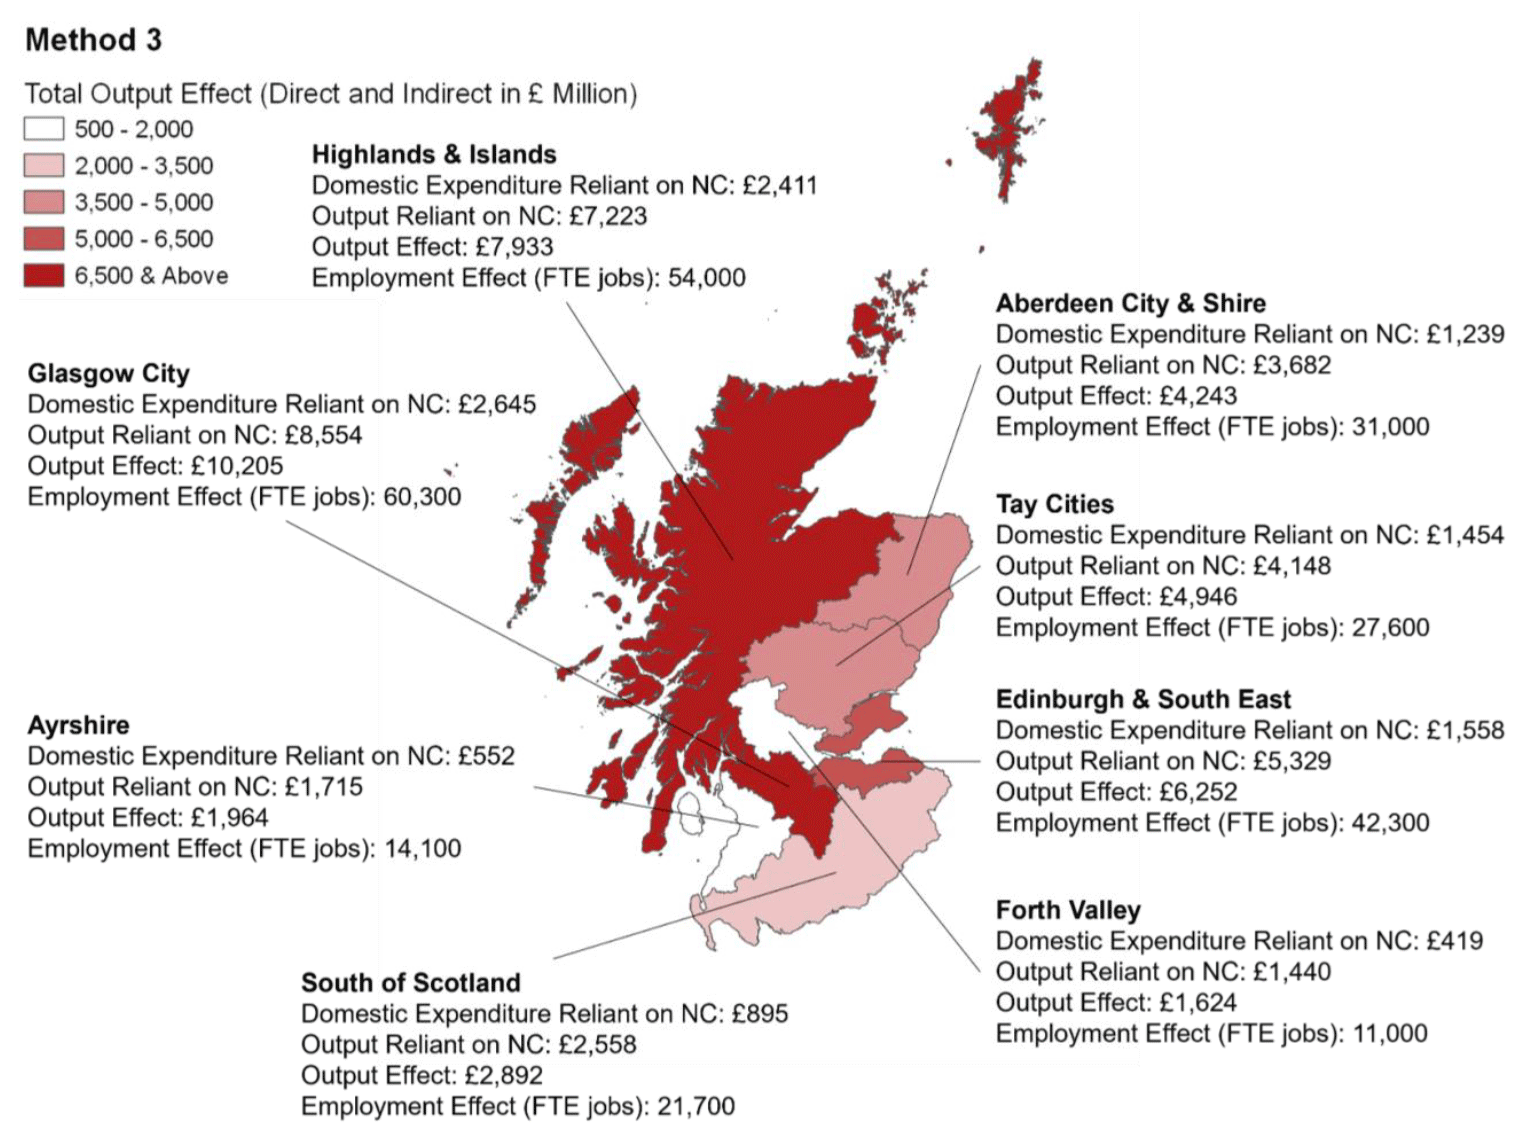
When expanding the definition of natural capital reliance in Method 3 to include ecosystem service reliance, the largest increase in output and employment effect was in the Highlands & Islands REP. This is due to the area’s economy being more reliant on the agriculture, forestry planting, forestry harvesting, fishing, and aquaculture industry. These industries were all found under Method 3 to be highly reliant on ecosystem services provided by nature. The human capital and/or nature-based solutions that would need to be implemented to substitute these ecosystem services are relatively complex and high value-add activities (in terms of multiplier effects). For example, these substitutes would largely be within the research and development industry, i.e., research into development of genetically modified organisms (GMOs) or livestock/aquatic animal vaccine development to replace nature-based disease control. This is particularly relevant to salmon fish-farms being predominantly located in the Highlands & Islands. This means that the Highlands & Islands REP relies heavily on disease control, an area threatening the industry. Scottish salmon is the UK’s largest export of food [45], demonstrating the impact not just on the Scottish economy, but the wider UK economy if the habitats providing ecosystem services such as biodiversity, water quality and microbial diversity were to be lost and/or degraded.
Regional results for total direct and indirect output, and direct and indirect employment effects across the three methods are shown below in Table 11.
| (£ Million) | Method 1 | Method 2 | Method 3 | |||
|---|---|---|---|---|---|---|
| Total Output Effect (direct and indirect) | Total Employment Effect (direct and indirect) | Total Output Effect (direct and indirect) | Total Employment Effect (direct and indirect) | Total Output Effect (direct and indirect) | Total Employment Effect (direct and indirect) | |
| Aberdeen City & Shire | £1,766 | 12,200 | £3,828 | 27,500 | £4,243 | 30,900 |
| Ayrshire | £899 | 5,000 | £1,794 | 12,600 | £1,964 | 14,000 |
| Edinburgh & South East | £2,158 | 9,700 | £5,899 | 39,300 | £6,252 | 42,300 |
| Forth Valley | £616 | 3,100 | £1,518 | 10,000 | £1,624 | 10,900 |
| Glasgow City | £4,324 | 14,200 | £9,761 | 56,300 | £10,205 | 60,300 |
| Highlands & Islands | £4,801 | 28,900 | £6,645 | 43,200 | £7,933 | 53,900 |
| South of Scotland | £1,414 | 10,300 | £2,516 | 18,500 | £2,892 | 21,700 |
| Tay Cities | £2,817 | 12,400 | £4,531 | 24,00 | £4,946 | 27,600 |
| Total | £18,795 | 95,800 | £36,492 | 231,400 | £40,059 | 261,600 |
Habitats Provision of Ecosystem Services
As identified using Method 3, economic industries in Scotland are reliant on different ecosystem services, beyond that of provisioning services captured in the SNA. The ecosystem services that support and enable industries to function are provided by habitats across Scotland. Habitats in Scotland were mapped using Scottish Government published habitat GIS mapping tool.[46] Ecosystem services from ENCORE were mapped to the habitats which provide them. The mapping of habitats to ecosystem services is widely established within the literature. Table 12 shows how the habitats were mapped to ecosystem services.
| Habitat Type | Ecosystem Service |
|---|---|
| Woodland | Climate regulation, Disease control, Fibres and other materials, Filtration, Flood and storm protection, Genetic materials, Groundwater, Mass stabilisation and erosion control, Mediation of sensory impacts, Pest control, Pollination, Soil quality, Surface water, Water flow maintenance, and Water quality |
| Plantation | Climate regulation, Fibres and other materials, Filtration, Flood and storm protection, Groundwater, Mass stabilisation and erosion control, Mediation of sensory impacts, Surface water, Water flow maintenance, and Water quality |
| Grassland | Climate regulation, Fibres and other materials, Filtration, Genetic materials, Groundwater, Mass stabilisation and erosion control, Pest control, Pollination, Soil quality, Surface water, Water flow maintenance, and Water quality |
| Saltmarsh | Bioremediation, Climate regulation, Dilution by atmosphere and ecosystems, Disease control, Fibres and other materials, Filtration, Genetic materials, Flood and storm protection, Maintain nursery habitats, Mass stabilisation and erosion control, Pest control, Soil quality, and Water quality |
| Bogs, mires, and fens | Bioremediation, Climate regulation, Dilution by atmosphere and ecosystems, Disease control, Fibres and other materials, Filtration, Genetic materials, Flood and storm protection, Maintain nursery habitats, Mass stabilisation and erosion control, Pest control, Pollination, Soil quality, and Water quality |
| Heathland and scrubland | Climate regulation, Fibres and other materials, Filtration, Flood and storm protection, Genetic materials, Mass stabilisation and erosion control, Pest control, Pollination Soil quality, Surface water, Water flow maintenance, and Water quality |
| Arable land | Climate regulation, Fibres and other materials, Filtration, Genetic materials, Groundwater, Mass stabilisation and erosion control, Pest control, Pollination, Soil quality, Surface water, Water flow maintenance, and Water quality |
| Dunes, sandy shore, shingle shore, and coastal cliffs | Filtration, Flood and storm protection, Mass stabilisation and erosion control, and Water quality |
| Inland scree and rocky habitat | Mass stabilisation and erosion control, and Water flow maintenance |
| Surface water | Buffering and attenuation of mass flows, Dilution by atmosphere and ecosystems, Disease control, Fibres and other materials, Filtration, Genetic materials, Groundwater, Maintain nursery habitats, Pest control, Surface water, Water flow maintenance, and Water quality |
| Urban and artificial | N/A |
The 11 habitats mapped above can be depicted across the eight REPs as shown in Table 13 below. Table 13 shows the share of habitat area across the regions.[47] It should be noted that ecosystem service provision depends on the quality of assets and not just their area. The Highlands and Islands REP has the largest area of all the REPs in Scotland with 43% of total area in Scotland within this REP. However, Table 13 shows that the share of each habitat type is overrepresented in the Highlands and Islands REP, demonstrating the high concentration of habitats that provide ecosystem services within this local area.
| Habitat Type | Aberdeen City & Shire | Ayrshire | Edinburgh & South East | Forth Valley | Glasgow City | Highlands & Islands | South of Scotland | Tay Cities |
|---|---|---|---|---|---|---|---|---|
| Saltmarsh | 1% | 1% | 11% | 2% | 0% | 45% | 18% | 21% |
| Dunes, sandy shores, rocky / shingle shores, and coastal cliffs | 7% | 2% | 8% | 0% | 0% | 75% | 3% | 5% |
| Surface waters | 2% | 2% | 2% | 5% | 3% | 71% | 5% | 9% |
| Bogs, mires, and fens | 3% | 6% | 0% | 4% | 2% | 74% | 3% | 7% |
| Grasslands | 10% | 7% | 1% | 7% | 2% | 58% | 7% | 7% |
| Heathland and scrubland | 13% | 7% | 0% | 5% | 1% | 63% | 3% | 8% |
| Woodland | 14% | 5% | 2% | 5% | 4% | 48% | 15% | 7% |
| Plantation | 8% | 6% | 3% | 4% | 4% | 45% | 22% | 9% |
| Inland scree and rocky habitat | 9% | 3% | 0% | 1% | 0% | 82% | 1% | 5% |
| Arable land | 18% | 7% | 10% | 3% | 6% | 19% | 24% | 13% |
| Urban and artificial | 8% | 7% | 20% | 4% | 15% | 28% | 7% | 11% |
| Unclassified | 4% | 1% | 1% | 1% | 1% | 80% | 1% | 11% |
Table 14 illustrates the share in employment across the eight REPs for the top 5 industries found in Method 3 and ENCORE to be the most reliant on ecosystem services. Employment by industry by region is a good proxy for examining the economic activities across the habitats in Scotland. These top 5 industries appear to have a large presence in the Highlands & Islands, with a high share of natural habitats in Scotland. Although there are many reasons beyond natural capital reliance for a business to locate in a certain area, it suggests that the proximity to the habitat for which the industry relies on for its ecosystem services may play a hidden role. If habitats were to be lost and/or degraded, then it would affect the ecosystem services they provide. This intrinsic relationship between nature and the economy could have different impacts on the economy in the regions across Scotland. Industries more reliant on ecosystem services and location specific, may be vulnerable to habitat loss/degradation and may require more place-specific interventions.
| Aberdeen City & Shire | Ayrshire | Edinburgh & South East | Forth Valley | Glasgow City | Highlands & Islands | South of Scotland | Tay Cities | |
|---|---|---|---|---|---|---|---|---|
| Agriculture | 13% | 6% | 9% | 3% | 6% | 34% | 16% | 14% |
| Fishing | 47% | 1% | 3% | 0% | 3% | 41% | 3% | 3% |
| Aquaculture | 1% | 1% | 5% | 3% | 3% | 83% | 2% | 2% |
| Forestry planting | 8% | 3% | 15% | 7% | 4% | 29% | 21% | 13% |
| Forestry Harvesting | 36% | 12% | 4% | 6% | 9% | 15% | 14% | 3% |
Note: Percentages for each industry sum to more than 100% due to rounding.
The bottom 5 industries found in Method 3 and ENCORE to be the least reliant on ecosystem services told a very different story in terms of share of employment across the eight REPs than those noted in Table 15 below. Table 15 illustrates the share of employment in the industries least reliant on ecosystem services. Jobs in these industries were mainly located in Edinburgh & Southeast and Glasgow City REPs, with a lower share of natural habitats in Scotland.
| % Total Employment in Industry in Scotland | Aberdeen City & Shire | Ayrshire | Edinburgh & South East | Forth Valley | Glasgow City | Highlands & Islands | South of Scotland | Tay Cities |
|---|---|---|---|---|---|---|---|---|
| Other professional services | 8% | 7% | 23% | 5% | 38% | 7% | 4% | 8% |
| Head office & consulting services | 12% | 5% | 26% | 5% | 35% | 8% | 4% | 6% |
| Accounting & tax services | 12% | 3% | 25% | 3% | 41% | 7% | 3% | 5% |
| Legal activities | 8% | 3% | 34% | 2% | 37% | 5% | 3% | 7% |
| Auxiliary financial services | 4% | 2% | 46% | 2% | 35% | 3% | 1% | 6% |
Applying the Method 1, Method 2, and Method 3, and the Multiplier Effects for an Industry of Interest
In this section, the three methods for defining reliance on nature have been applied and the economic impacts estimated for the textiles sector. Selection of the textiles sector as an example was driven by the differing levels of natural capital reliance when analysed through the lenses of Methods 1-3.
The textiles industry under Method 1 definition was not reliant on natural capital. This is because Method 1 defined an industry as being natural capital reliant if an industry supplies materials, or energy extracted from the environment to the economy - the textiles industry does not do this. Therefore, no associated output or employment effect could be measured under Method 1 definition. Under Method 2, the definition of an industry reliant on natural capital was broadened to also include industries that rely on natural capital as an input into production. This definition deemed the textile industry as being reliant on natural capital inputs, including fibre crops and animal fibres. Method 2 therefore found 4.5% of the textile industry to be reliant on natural capital. This resulted in, under the Method 2 definition of natural capital reliance, £7 million of domestic expenditure and £31 million of output in 2019 within the textiles industry being natural capital reliant, with approximately an associated £40 million of direct and indirect output effect and 390 direct and indirect jobs effect.
However, Method 3 extended the textiles industry’s reliance on nature due to the recognition of key ecosystem services such as bioremediation, dilution by atmosphere and ecosystem, fibres and other materials, filtration, flood and storm protection, ground water, mass stabilisation and erosion control, surface water, water flow maintenance and water quality. This recognition of ecosystem services reflecting value of natural capital was based on the ENCORE approach. These identified ecosystem services that are vital to the textiles industry and are not explicitly captured in the intermediate inputs and expenditures in a typical economic system of accounts approach. Based on the Method 3 approach, the 4.5% reliance on nature from Method 2 increased to 5.7% under Method 3. This resulted in an uplift of +£1.9 million to £8.8 million of domestic expenditure and +£8.5 million to £39.3 million output which could be considered to be reliant on natural capital. The results for output reliant on natural capital and associated output and employment effect are shown below in Table 16.
| Output of Textile industry Reliant on Natural capital (£ million) | Total Textile Industry Output (£ million) | Natural Capital Output as a % of Textile industry output | Output Effect (direct and indirect) (£ million) | Employment Effect (direct and indirect) | |
|---|---|---|---|---|---|
| Method 1 | £0 | 689 | 0% | 0 | 0 |
| Uplift between Method 1 and 2 | +12.5 | +39.9 | +390 | ||
| Method 2 | 30.8 | 689 | 4.5% | 39.9 | 390 |
| Uplift between Method 2 and 3 | +8.5 2.6 (Substitutable) 5.9 |
+3.7* | +30* | ||
| Method 3 | 39.3 | 697.5 | 5.7% | 43.6 | 420 |
Note: “substitutability” refers to when it was considered possible to substitute the ecosystem services with physical capital; while “non-substitutability” refers to when production processes cannot take place without the ecosystem service.
*Output and employment effect of substitutable share of nature related output only.
However, as these ecosystem services are not captured within the traditional approach of the SNA boundary, the output and employment multipliers could not be directly applied to the value of natural capital reliance as identified in Method 3. Of the 11 ecosystem services attributed to the textiles industry, three could be substituted, providing a proxy for output and employment effects. One of these three substitutable ecosystem services was ‘fibres and other materials’. This relies on natural fibre production, which in turn relies on natural capital inputs. If the natural capital that renders natural fibre production possible were lost or degraded, the analysis determined that it could be substituted by increased production and purchasing of synthetic fibres (SIC code 20.6 ‘Manufacture of synthetic fibres’). This way, the output and employment effects from the manufacture of synthetic fibres were measured. Table 17 shows the ecosystem services that could be substituted by human capital and/or natural capital nature-base solutions. The SIC codes were mapped to these substitutable options and are shown in the final column of Table 17. From this analysis, 31% of the additional £8.5 million output identified in Method 3 (amounting to £2.6 million), can be substituted. This substitutable £2.6 million output supported an additional £3.7 million direct and indirect output effect, taking the total output effect to £43.6 million (£39.9 million + £3.7 million), and 30 additional direct and indirect jobs, equating to a total employment effect of 420 jobs in total (390 jobs + 30 jobs)
| Ecosystem Service | Industry Process Reliant on Ecosystem Service | Human Capital and/or Natural Capital Substitution | Mapped SIC Code |
|---|---|---|---|
| Fibres and other materials | Natural fibre production |
|
|
| Flood and storm protection | Natural and synthetic fibre production |
|
|
| Water flow maintenance | Natural and synthetic fibre production |
|
|
Applying the Three Methods and Multiplier Effects for Peatland Restoration
In this section, the three methods for defining reliance on nature were applied and the economic impacts estimated for peatland restoration. Peatland restoration was selected given the important role it plays in helping Scotland become a ‘Net Zero Nation’ by 2045. Scotland is at the forefront of work to create viable markets for nature – the Peatland Code being one of the key examples. Therefore, there is increased funding and economic activity flowing into peatland restoration that merits further analysis as part of this study.
The three methods were applied, and estimations were calculated for the economic impact of investment in peatland management and restoration activities in Scotland. The previous 2023 study for Scottish Government undertaken by WSP and eftec [48] provided the breakdown of industries involved in peatland management and restoration. These activities and mapped SIC codes were used and are shown below in Table 18.
| Activity | SIC Codes | Proportion of spend across SIC Code (a) |
|---|---|---|
|
|
1% |
|
|
51% |
|
|
2% |
|
|
46% |
|
|
1% |
|
|
0.1% |
Note: (a) May not sum to 100% due to rounding
A hypothetical injection of £100 million of government spending for peatland restoration was assumed. This spending was then absorbed by the various identified activities and industries shown in Table 18 above, with the final column indicating estimated proportion of spend by SIC Code.[49] Given the industries involved in peatland restoration and from the established Method 1, Method 2 and Method 3, the economic impact of natural capital reliance for peatland restoration was estimated as shown in Table 19.
Under Method 1, 46% of this injection (£46 million) was deemed natural capital reliant. This resulted in a direct and indirect output effect of £62 million, and 510 direct and indirect jobs supported reliant on natural capital. Using Method 2, an additional 1% of the injection (£47 million) for peatland restoration was deemed natural capital reliant. This resulted in a direct and indirect output effect of £63 million and 520 direct and indirect jobs reliant on natural capital supported. The remaining 54% (Method 1) and 53% (Method 2) of the injection also filtered through the economy in the non-natural capital reliant elements of sectors, creating additional output and employment effects.
Method 3 expanded the definition further, with 74% of the injection for peatland restoration (£74 million) deemed to be natural capital reliant. However, as previously discussed, this extra 27% (£27 million) of natural capital reliance sits outside the national accounts (SNA) as it is capturing regulating and cultural ecosystem services. Therefore, only the substitutable share of the extra £27 million was used to estimate output and employment effects. This was estimated to be around £2 million, with the remaining £25 million deemed non-substitutable.
The additional output effect from this substitutable £2 million was +£4 million, bringing the total direct and indirect output effect to £67 million reliant on natural capital.[50] The additional employment effect from this substitutable £2 million was an additional +30 jobs, bringing the total direct and indirect employment effect to 550 jobs reliant on natural capital supported.
| Natural Capital Reliance | Expenditure Reliant on Natural capital (£ million) | Output Effect (direct and indirect) (£bn) | Employment Effect (direct and indirect) | |
|---|---|---|---|---|
| Method 1 | 46% | 46 | 62 | 510 |
| Uplift between Method 1 and 2 | +1% | +1 | +1 | +10 |
| Method 2 | 47% | 47 | 63 | 520 |
| Uplift between Method 2 and 3 | +27% | +27 (Substitutable = £2) (Non-substitutable = £25 million) |
+4* | +30* |
| Method 3 | 74% | 74 | 67 | 550 |
Note: “substitutability” refers to when it was considered possible to substitute the ecosystem services with physical capital; while “non-substitutability” refers to when production processes cannot take place without the ecosystem service.
*Output and employment effect of substitutable share of nature related expenditure only.
The rental and leasing services industry, forestry planting industry, and construction industry are the industries mainly impacted by investment in peatland restoration.
The forestry planting and construction industries have substitutes for ecosystem services allowing the additional reliance identified in Method 3 impact to be proxied. The rental and leasing services industry relies on 7 different ecosystem services, however none of these were identified as substitutable for the industry in the ENCORE database. Table 20 below shows the forestry planting industry ecosystem services that can be substituted, along with the relevant substitution options and mapped SIC codes. Table 21 provides the same information for the construction industry.[51]
| Ecosystem Service | Industry Process Reliant on Ecosystem Service | Human Capital and/or Natural Capital Substitution for Ecosystem Service | Mapped SIC Code |
|---|---|---|---|
| Flood and storm protection |
|
|
|
| Flood and storm protection |
|
|
|
| Ecosystem Service | Industry Process Reliant on Ecosystem Service | Human Capital and/or Natural Capital Substitution for Ecosystem Service | Mapped SIC Code |
|---|---|---|---|
| Mass stabilisation and erosion control |
|
|
|
Workforce Health
The interaction between natural capital, workforce health, and productivity is complex, and not directly captured in SNA data. In general, however, workforce health (and population health broadly) are reliant on ecosystem services, particularly regulating services (e.g., temperature and air pollution) which can have knock-on workforce health effects through sick days taken, productivity, and output. Notable impacts of natural capital on workforce health that can be identified from the UK Natural Capital Accounts include the role of access to green space in supporting the physical and mental health of the population[52], and the role of vegetation in removing air pollution.[53]
Air pollution effects on workforce health were excluded from the core natural capital economic framework in this study, as the benefits are not reflected as a market value. However, it may be possible to roughly estimate workforce health impacts in quantitative terms where data is available. For example, in terms of air pollution, Particulate Matter 2.5 (PM2.5) is a leading environmental human health risk factor, and PM2.5 concentration is thereby a commonly used proxy for estimating the avoided loss of workforce productivity in connection with air pollution changes (i.e., reduction)[54]. PM2.5 removal alone represents 85% of the annual value of air pollutant removal (estimated through avoided health impacts) in Scotland in 2020.[55] Despite having lower levels of vegetation, densely populated local areas in Scotland tend to generate the greatest air pollution removal values (estimated through avoided health impacts) given the number of people benefitting compared to a more sparsely populated area. The Scottish Natural Capital Accounts (2023) reported that Glasgow, Dundee, and Edinburgh accounted for the highest value of air pollution removed by nature in 2020 (based on PM2.5, nitrogen dioxide (NO2), ozone (O3) and sulphur dioxide (SO2), whereas Falkirk, East Renfrewshire, and West Dunbartonshire had the lowest values.
Figure 18 below presents a possible stylised calculation for avoided sickness leave, which is one method for estimating the avoided loss of workforce productivity from air pollution reduction.

Estimating the physical quantity of air pollution required multiplying the PM2.5 concentration (depending on rural or urban) by the percentage reduction in PM2.5 concentration across urban extent. This value was multiplied by the avoided sick days resulting from 1 unit of PM2.5 (using an assumption from the Leroutier and Ollivier study in France), and by the total number of employees in Scotland (across all SIC codes, using 2021 figures) and the average annual ordinary time earnings for a worker in Scotland. Table 22 below presents details on these assumptions and values from the literature for each component of the calculation.
| Assumption | Value | Source | |
|---|---|---|---|
| Avoided loss of productivity from air pollution (avoided sickness leave) | N/A | ||
| A | PM2.5 concentration (urban versus rural) | 5.0 µg/m3 (urban)(a) 3.7 µg/m3 (rural)(a) |
Scottish Air Quality Database 2021 |
| B | Percentage reduction in PM2.5 concentration (urban habitats) | 0.38%(b) | Jones et al. (2019) |
| C | Avoided sick days per 1 unit (µg/m3) of PM2.5 | 2.7 days per 1,000 workers(c) | Leroutier and Ollivier |
| D | Number of employees Available by SIC code, disaggregated by Local Authority | 1,814,000(d) | Scottish Annual Business Statistics 2021 |
| E | Average annual ordinary time earnings | £36,545.60(e) | Employee earnings in the UK: 2023 |
Notes: (a) PM2.5 concentration for each site monitored (as listed in Table 6.1.3 of Scottish Air Quality Database 2021) was categorised into urban or rural, with urban including UB – Urban Background, UI – Urban Industrial, KS – Kerbside, RS – Roadside, S – Suburban, and rural including just R – Rural. Averages were taken for each of urban and rural across all the sites, excluding those sites with <75% data capture, (b) The 0.38% percentage reduction in PM2.5 concentration for urban habitats is an estimate of the proportion of urban land area which provides local air pollution regulating services and applies to the whole of Great Britain, (c) The Leroutier and Ollivier study method included a time series element (t, t+1, t+2…) and was based on observed data from across France. In terms of the avoided sick days per 1 unit of PM2.5, the calculation is based on X, (d) This figure represents “Total Employees” from across SIC codes 1 to 96 in 2021, and (e) The average annual ordinary time earnings in Scotland is based on the median weekly earnings for Scotland in April 2023 (£702.80) multiplied by 52 weeks.
Leroutier and Ollivier highlighted three channels through which air pollution can determine sales. The example given above takes the labour supply approach where there is an increase in work absenteeism (i.e., sickness leave). The two other approaches highlighted are more challenging to quantify in monetary terms: (i) decrease in productivity non-absent workers, either through reduced cognitive capacities or through potential interruptions to the value chain due to colleagues who are on sickness leave, and (ii) decrease in demand. The study found that a one-unit increase in pollution corresponded with a 0.3% decrease in sales.
Contact
Email: matylda.graczyk@gov.scot
There is a problem
Thanks for your feedback