Inequalities in access to blue coastal space: research report

Research report exploring factors affecting people’s access to coastal space in Scotland.


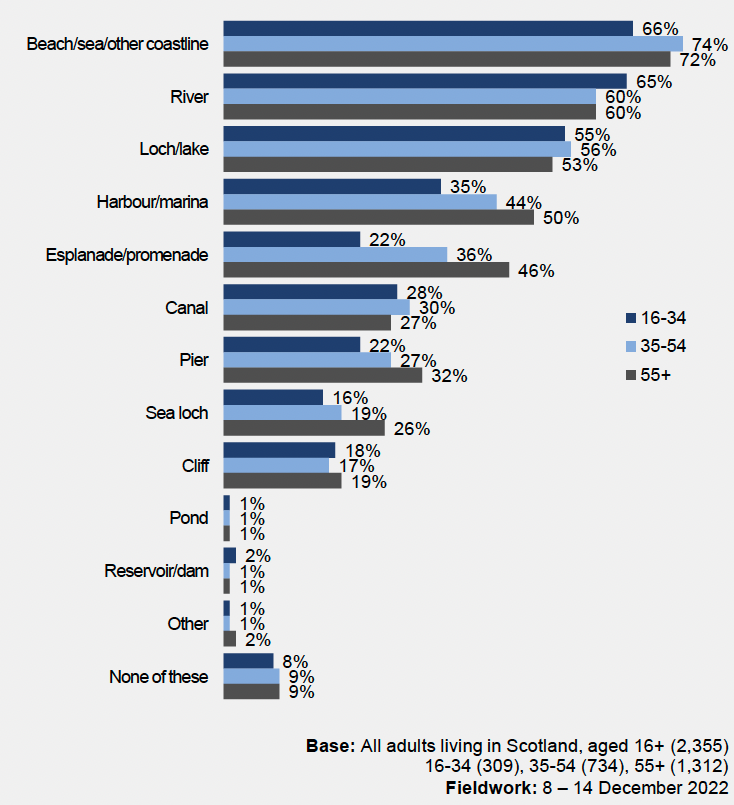
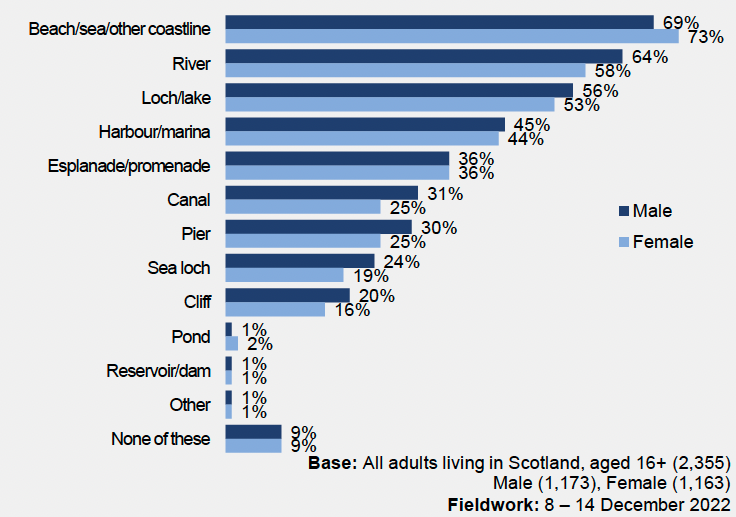
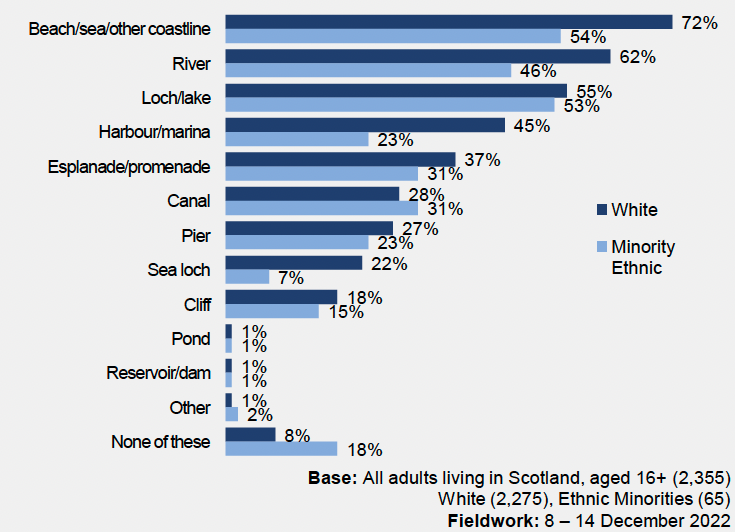
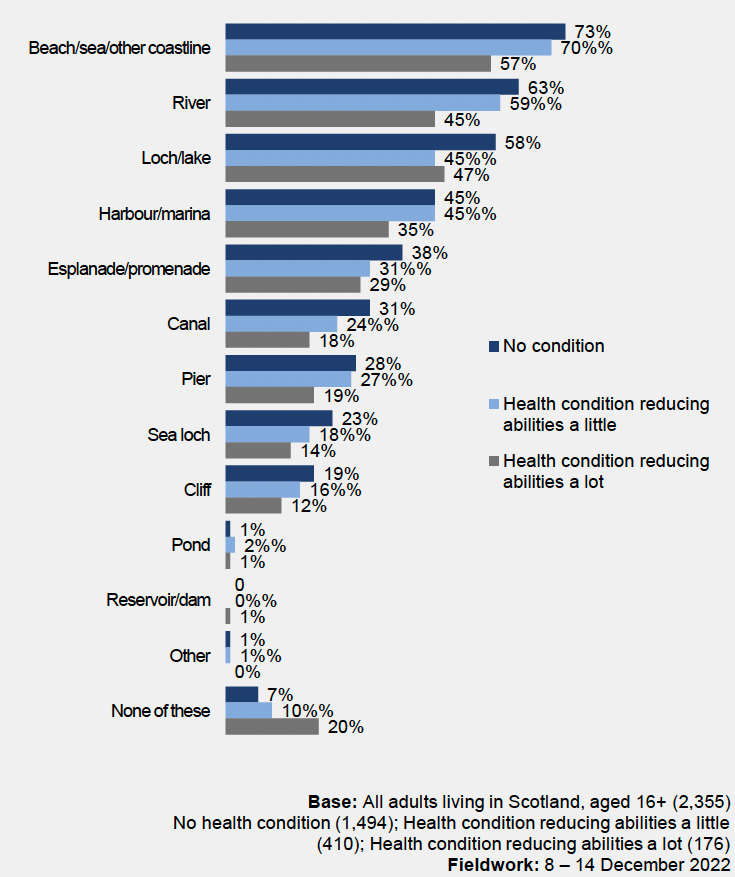
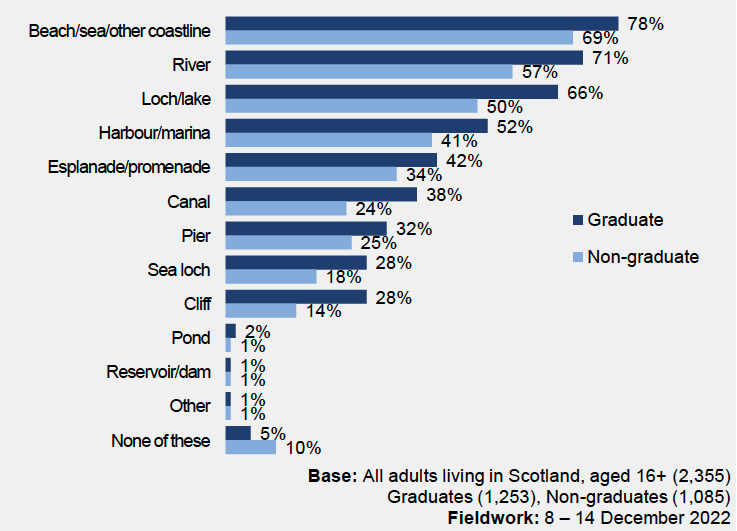
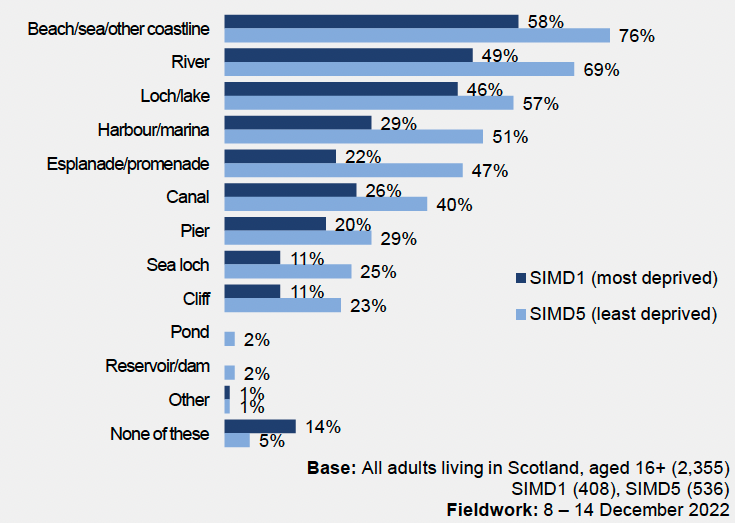
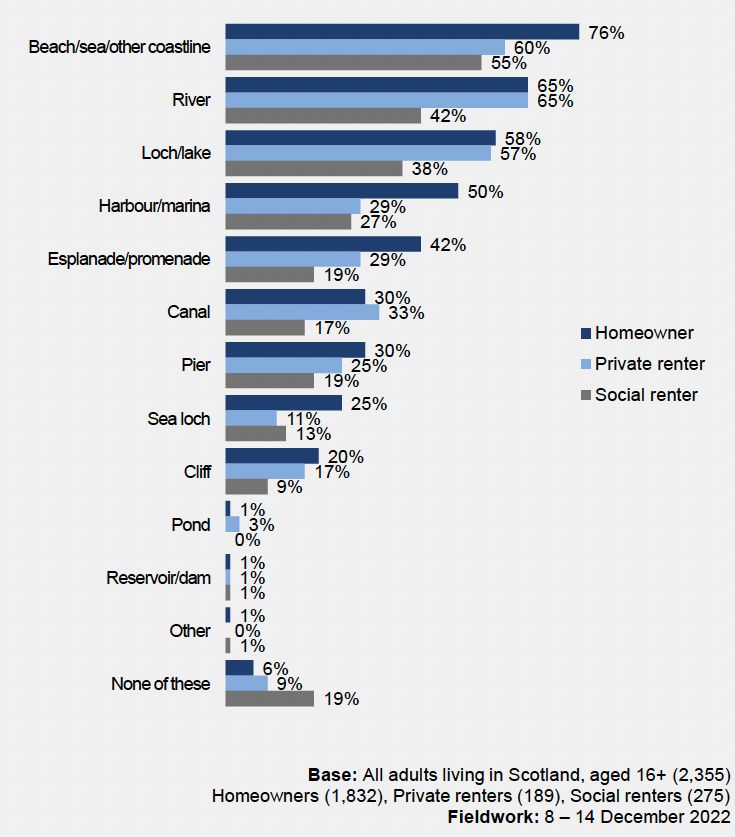
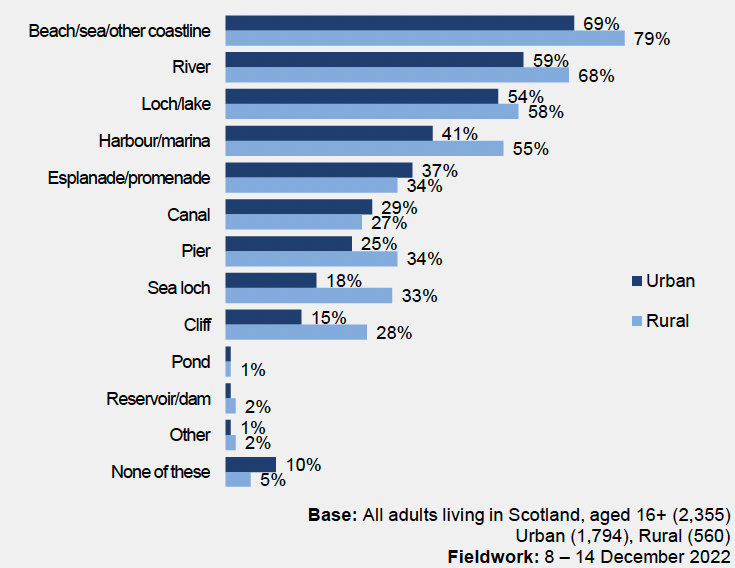
Appendix D – Charts showing types of blue spaces visited in the last 12 months showing variation by subgroup

Question text for all figures:

In the last 12 months, which of the following type(s) of blue space have you visited in your free time? Please do not include time spent at the coast as part of your job, or time spent outside Scotland.

Figure D1 – Variation by age

a bar chart that sets out the types of blue spaces visited in the last 12 months broken down by age and shows that those aged 16-34 were less likely to visit all types of coastal area (apart from rivers) compared with other age groups.

Figure D2 – Variation by gender

a bar chart that sets out the types of blue spaces visited in the last 12 months broken down by gender and shows that men are more likely to visit all types of coastal area (apart from the beach) compared with women.  Sometimes the difference is only marginal.

Figure D3 – Variation by ethnicity

a bar chart that sets out the types of blue spaces visited in the last 12 months broken down by ethnicity and shows that minority ethnic respondents are less likely to visit all types of coastal area compared with White respondents.  The differences were highest for beach/sea/ other coastline (54% compared with 72%), and harbour/marine (23% compared with 45%).

Figure D4 – Variation by health condition

a bar chart that sets out the types of blue spaces visited in the last 12 months broken down by health condition and shows that those with health conditions (both conditions that reduce abilities a little and conditions that reduce abilities a lot) are less likely to visit all types of coastal area.  The difference was greater for the latter group.

Figure D5 – Variation by education level

a bar chart that sets out the types of blue spaces visited in the last 12 months broken down by education level and shows that non graduates are less likely to visit all types of coastal area.

Figure D6 – Variation by deprivation ( SIMD)

a bar chart that sets out the types of blue spaces visited in the last 12 months broken down by deprivation (SIMD) and shows that those in the most deprived areas are less likely to visit coastal areas compared with those from the least deprived areas.

Figure D7 – Variation by tenure

a bar chart that sets out the types of blue spaces visited in the last 12 months broken down by housing tenure and shows that social renters are less likely to visit all types of coastal areas compared with home-owners.

Figure D8 – Variation by rurality

a bar chart that sets out the types of blue spaces visited in the last 12 months broken down by rurality and shows that those in urban areas are less likely to visit most types of coastal space apart from canals and esplanades, compared with those from rural areas.

Contact

Email: Marineanalyticalunit@gov.scot

Back to top