Inequalities in access to blue coastal space: research report
Research report exploring factors affecting people’s access to coastal space in Scotland.
3. Overview of current use of the coast
Key Points
- Beaches, the sea and other coastline are by far the most commonly used type of blue space, with 71% of the Scottish public reporting they have visited these in the last 12 months.
- Groups that are more likely not to have visited any blue spaces, including the coast, in the past 12 months are: disabled people, ethnic minorities, non-graduates, those renting from a council or housing association, those living in urban areas and those living in the most deprived areas (SIMD 1).
- Among those who either did not visit the coast or visited it only occasionally, associations with the coast were typically positive even though they did not visit often. Pleasant childhood memories of coastal visits with family framed these positive associations.
This chapter outlines how Scotland's coast is currently used by people in Scotland, examining how usage of blue space (and the coast specifically) differs for different groups within the population. It looks first at how often different groups use the coast, based on evidence from the quantitative survey, before exploring associations with and childhood experiences of the coast, based on the qualitative research.
Visiting the coast compared to other types of blue space
Participants in the quantitative survey were asked which types of blue space they had visited in the last year. The most common response was the beach, sea or other coastline with 71% of respondents having visited these places in the last 12 months (Figure 2).
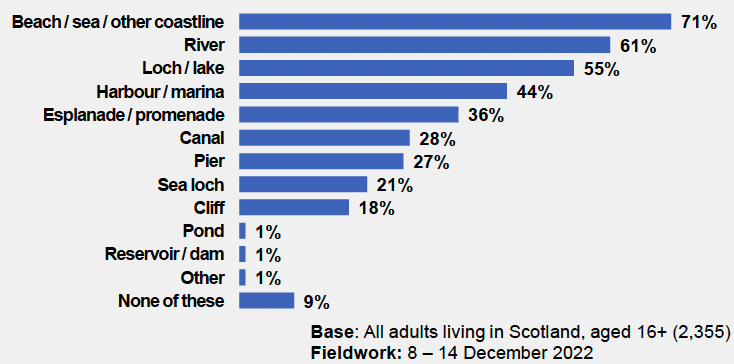
Q: In the last 12 months, which of the following type(s) of blue space have you visited in your free time? Please do not include time spent at the coast as part of your job, or time spent outside Scotland.
Subgroup differences
Groups that were more likely to have visited no blue spaces in the last 12 months included those with a disability (i.e. a health condition that reduced their abilities 'a lot'); those belonging to an ethnic minority; non-graduates (compared to graduates); social renters; those living in urban areas and those living in the most deprived areas (SIMD 1).
Frequency and regularity of coastal visits in the last 12 months
Around one in five respondents (19%) were 'frequent users' of the coast who had visited at least once per week over the last 12 months. A similar proportion (18%) were 'moderate users' who had visited the coast once or twice per month, while 43% were 'occasional users' who had visited the coast at most every 2-3 months. One in five (19%) had not visited the coast in the last 12 months (Figure 3).
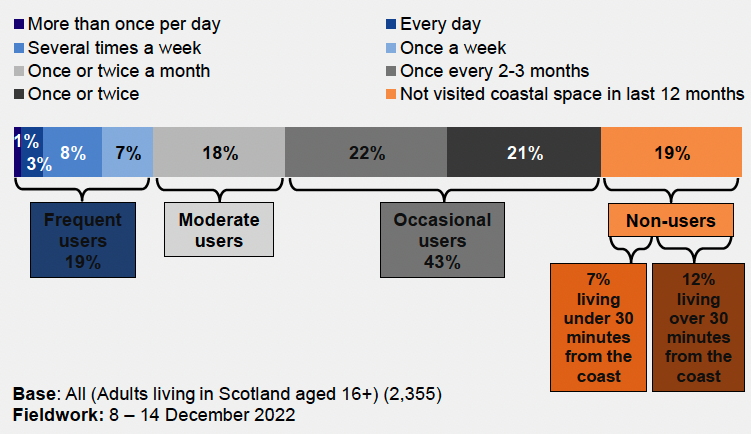
Q: In the last 12 months, how often, on average, have you spent free time outside at the coast? This includes areas such as the beach, sea or other coastline, cliffs, esplanades or promenades, piers and harbours or marinas. Again, please do not include time spent at the coast as part of your job, or time spent outside Scotland.
Subgroup differences
Frequency of visits saw variation by age; disability; ethnicity; tenure; rurality and level of deprivation (Figures 4 to 10).
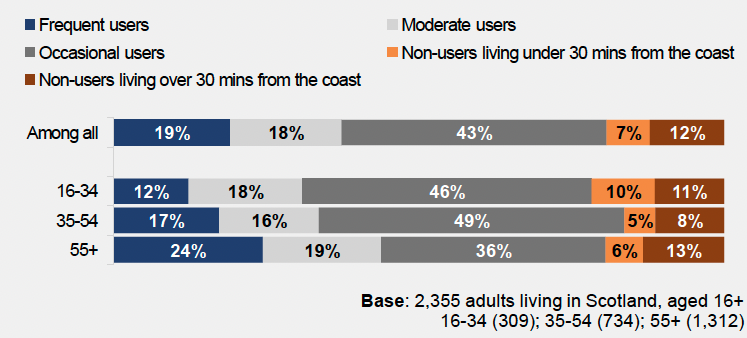
Younger people aged 16-35 are less likely to be frequent users of the coast (12%) compared to those aged 55+ (24%).
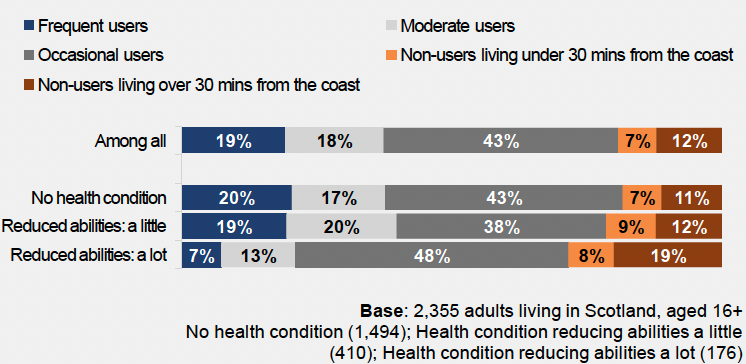
Those with a disability that reduces their abilities 'a lot' are less than half as likely to be frequent users of the coast (7%) compared to those with no health condition (20%) or those who have a health condition that reduces their abilities 'a little' (19%).
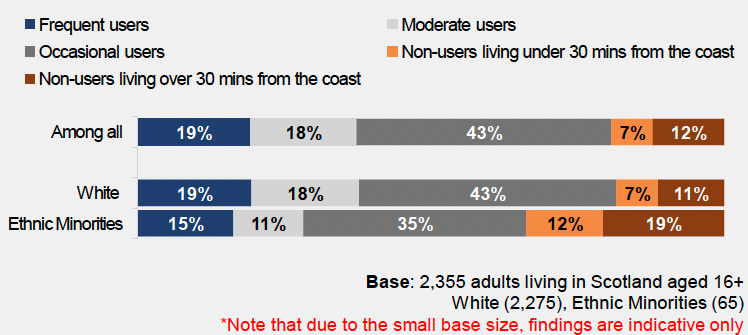
Almost a third of people from ethnic minorities in Scotland are non-users of the coast (31%), compared to 18% of White people.
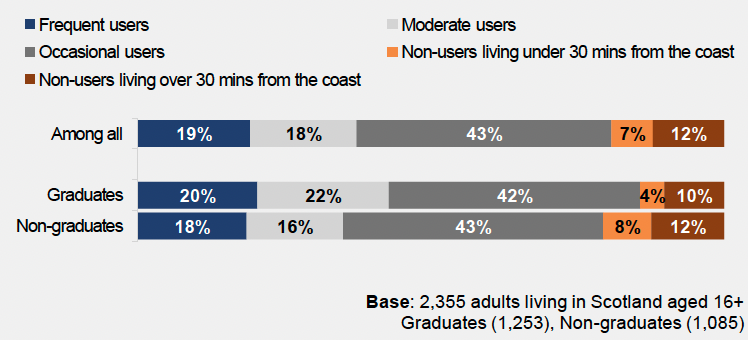
Non-graduates are more likely not to be non-users of coastal space (20%) compared to graduates (14%).
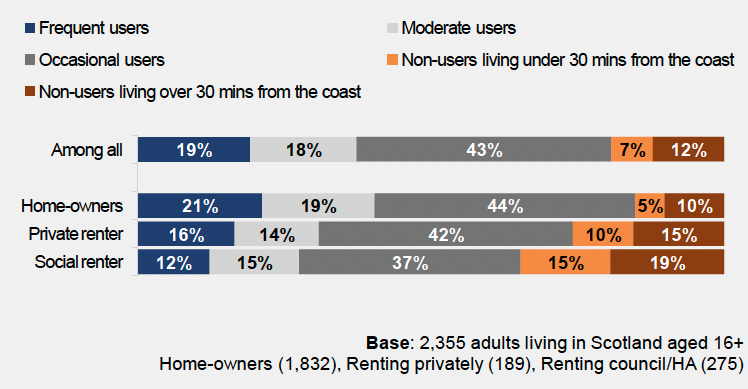
Both social renters (34%) and private renters (25%) are more likely to be non-users of the coast compared to homeowners (15%).
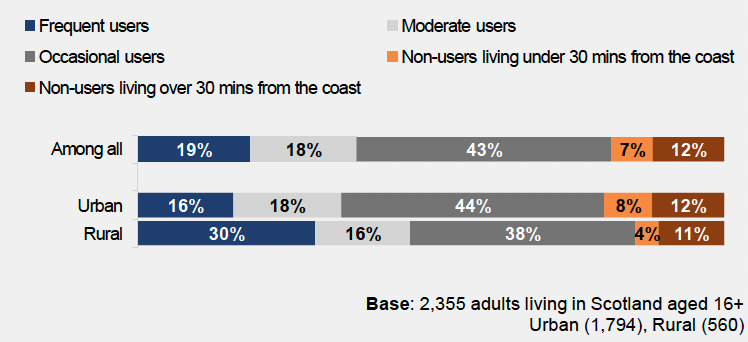
Those living in urban areas are more likely to be non-users of the coast (20%) compared to those living in rural areas (15%) and almost half as likely to be frequent users of the coast (15% vs 30%).
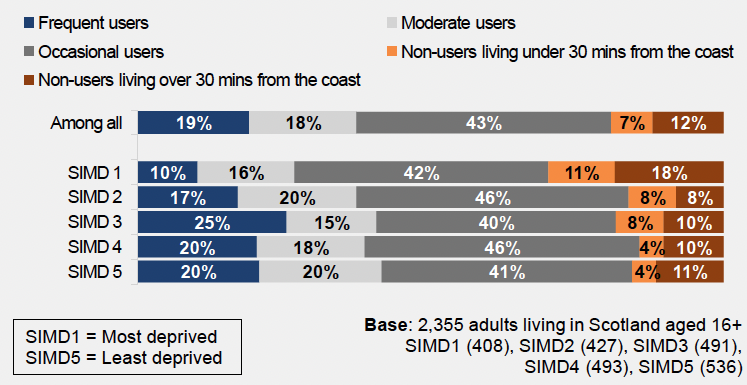
Those living in the most deprived areas in Scotland (SIMD1) are more likely than average to be non-users of the coast (29% vs 19% on average).
Qualitative findings on visit frequency
The qualitative research was carried out among non-users and occasional users of the coast. Participants' history of visiting the coast ranged from those that went occasionally throughout the year, to those who tended to go only during summertime, to those who had not visited for many years (e.g. for over a decade) or had never visited.
Visiting the coast could be seen as a seasonal activity. Weather played an important role in how regularly some participants visited the coast, with some explaining that they are more likely to visit in the summer months when the weather is better. However, there were also those who visited in the colder months as well.
"I would say I'm much more likely to go between the months of May and September, just from a weather standpoint."
(Female participant, 16-34)
Associations with and memories of visiting the coast
The qualitative research investigated the associations people had with the coast, their childhood memories of the coast, and the ways in which they typically made use of the coast when there.
Experiences of visiting the coast
Visiting the coast provided different experiences to different people, depending on their activities and preferences. While some visited the coast to walk on the beach or to swim, others interacted with nature by collecting rocks and shells or exploring rock pools. Some preferred to visit during summer for a day out with family and friends, while others went at other times of year to see family who live by the coast.
Participants described how the coast is an ideal setting for a quiet and peaceful walk. One participant with osteoarthritis, for example, explained that he visits beaches as they are flat and suitable for him to walk on. He prefers to go on his own, with his dog, and take binoculars to look out at places he knows. Others discussed how their experience of the coast is different depending on the location, for example some preferring the ruggedness of Scotland's west coast compared to the east coast.
Associations
Although they did not visit often, participants generally expressed favourable associations with the coast. Beaches were the standout feature for most when they thought about the coast. Participants described feelings of relaxation, tranquillity, enjoying fresh air, being in touch with nature, admiring beautiful views, and spending time with family on holiday. The unique sounds and smells of the coast, the nostalgia from childhood visits, summer holidays, fun, and enjoyment were key associations when thinking about the coast.
Associations with the coast also varied depending on the stretch of coast participants were thinking about. For instance, some participants associated the coast with particular places, memories, or activities, such as visiting castles along the West Coast or rock pools on the Isle of Skye.
Where participants recalled childhood experiences of the coast, these were typically positive memories of visits to see family at the coast, enjoying holidays, and visits as part of organised school activities. Activities mentioned included cycling, picnics, fishing, and swimming. To illustrate, one participant who grew up in Northern Ireland recalled visiting castles near or on the coast and enjoying visits with friends, climbing along the harbour. For another, renting a cottage on the coast for a couple of weeks during summer holidays had been a family tradition, where they enjoyed spending time with friends and going fishing. There were also participants who had grown up near the coast in other countries, such as near the Atlantic Ocean in the Niger Delta, who tended to view this positively. However, Scotland's coast could feel less appealing to participants who had grown up in warmer climes, given the colder weather in Scotland.
Where participants' spontaneous associations with the coast were more negative, this typically related to the impact of other visitors on particular beaches, such as over-crowding, anti-social behaviour and a lack of cleanliness (e.g. litter being present, or the water quality being poor). Other negative associations were dogs being present (for those who had a fear of dogs); the coast feeling scary in bad weather; or perceptions of the coast being an exclusive place where only certain types of people tended to visit. There was also a view (discussed further in Chapter 5) expressed by ethnic minority participants and stakeholders that the coast is a place where mostly White people tend to visit, which could create some unease for these participants.
Contact
There is a problem
Thanks for your feedback