Initial destinations of senior phase school leavers: 2018 edition
This presents updated data on initial destinations of school leavers from local authority and grant-aided schools in Scotland.
2. National Trends in Initial Destinations of Senior Phase School Leavers
- 93.7 per cent of 2016/17 senior phase school leavers were in a positive destination approximately three months after leaving school (compared to 93.3 per cent in 2015/16).
- The percentage of leavers in positive initial destinations has increased over the six year period from 2011/12 when 90.1 per cent of pupils were in a positive destination.
- 67.5 per cent of school leavers continued their education within Higher or Further Education establishments in 2016/17 (66.9 per cent in 2015/16).
- The percentage of leavers in training (2.4 per cent in 2016/17) has decreased for the last five years from 2012/13 when 4.8 per cent of pupils entered training.
- The percentage of leavers that are unemployed and seeking employment or training decreased by 0.6 percentage points, from 5.1 per cent in 2015/16 to 4.5 per cent in 2016/17. This downward trend has continued for the last six years.
2.1. Comparison to previous years
2.1.1. This section presents information that compares initial destinations of senior phase school leavers in 2016/17 to previous years.
Chart 1: Initial destinations of senior phase school leavers in 2015/16 and 2016/17
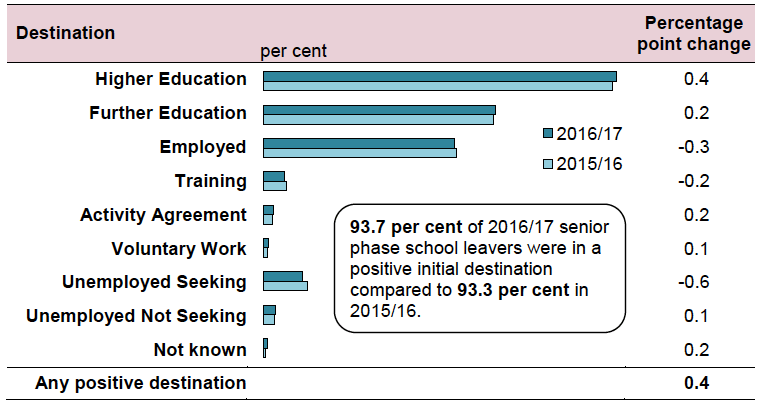
2.1.2. The percentage of senior phase pupils in a positive initial destination in 2016/17 has marginally increased to 93.7 per cent compared to 93.3 per cent in 2015/16.
2.1.3. There has been a 0.4 percentage point increase in leavers continuing to higher education (40.7 per cent in 2016/17 compared to 40.3 per cent in 2015/16) and a 0.2 percentage point increase in leavers continuing on to further education (26.8 per cent in 2016/17 compared to 26.6 per cent in 2015/16).
2.1.4. There has been a 0.6 percentage point decrease in the number of leavers that are unemployed seeking employment or training, decreasing from 5.1 per cent in 2015/16 to 4.5 per cent in 2016/17.
2.1.5. The percentage of leavers in training has decreased by 0.2 percentage points (2.4 per cent in 2016/17 compared to 2.6 per cent in 2015/16).
2.1.6. The percentage of leavers in other destinations has decreased from 6.7 per cent in 2015/16 to 6.3 per cent in 2016/17.
Table 1: Percentage of senior phase school leavers in initial destinations by year (2011/12 – 2016/17)
| Destination |
2011/12 |
2012/13 |
2013/14 |
2014/15 |
2015/16 |
2016/17 |
|---|---|---|---|---|---|---|
| Any positive destination |
90.1 |
91.7 |
92.5 |
93.0 |
93.3 |
93.7 |
| Higher Education |
37.8 |
37.1 |
39.1 |
38.8 |
40.3 |
40.7 |
| Further Education |
26.7 |
27.6 |
26.3 |
27.6 |
26.6 |
26.8 |
| Employed |
19.8 |
20.4 |
21.7 |
21.4 |
22.3 |
22.0 |
| Training |
4.5 |
4.8 |
4.0 |
3.8 |
2.6 |
2.4 |
| Activity Agreement |
0.9 |
1.3 |
1.0 |
0.9 |
1.0 |
1.2 |
| Voluntary Work |
0.4 |
0.5 |
0.4 |
0.4 |
0.5 |
0.6 |
| Other destination |
9.9 |
8.3 |
7.5 |
7.0 |
6.7 |
6.3 |
| Unemployed Seeking |
8.2 |
6.9 |
6.1 |
5.4 |
5.1 |
4.5 |
| Unemployed Not Seeking |
1.3 |
1.1 |
1.1 |
1.1 |
1.3 |
1.4 |
| Not known |
0.4 |
0.3 |
0.3 |
0.5 |
0.2 |
0.4 |
| Total number of leavers |
49,744 |
51,632 |
51,335 |
52,433 |
52,249 |
51,258 |
2.2. Initial destinations of school leavers 2011/12 to 2016/17
2.2.1. The next section provides information about the trend in initial destinations of senior phase school leavers over the six year period from 2011/12 to 2016/17.
Chart 2: Positive/Other initial destinations of senior phase school leavers by year (2011/12 - 2016/17)
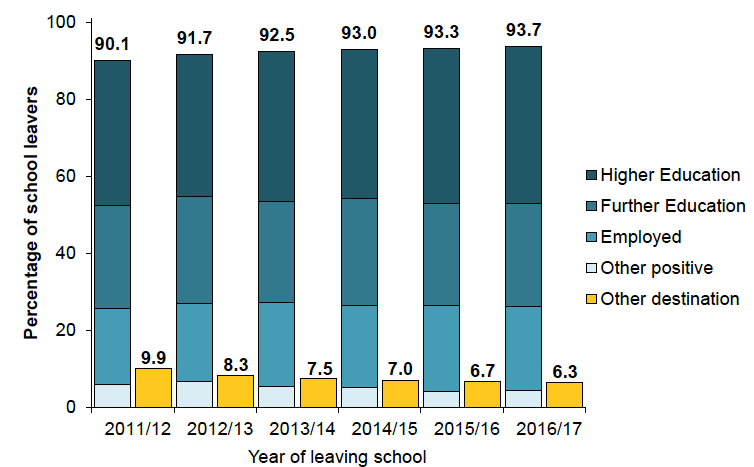
* ‘Other positive’ includes leavers undertaking activity agreements, training or voluntary work. ‘Other destinations’ includes leavers that are unemployed seeking, unemployed not seeking or where destination is not known.
2.2.2. The percentage of leavers in a positive initial destination has increased over the six year period from 2011/12 (90.1 per cent) to 2016/17 (93.7 per cent).
2.2.3. The percentage of leavers in other destinations has decreased over the six year period from 2011/12 (9.9 per cent) to 2016/17 (6.3 per cent).
Chart 3: Six year trend in most common positive initial destinations of senior phase school leavers (2011/12 – 2016/17)
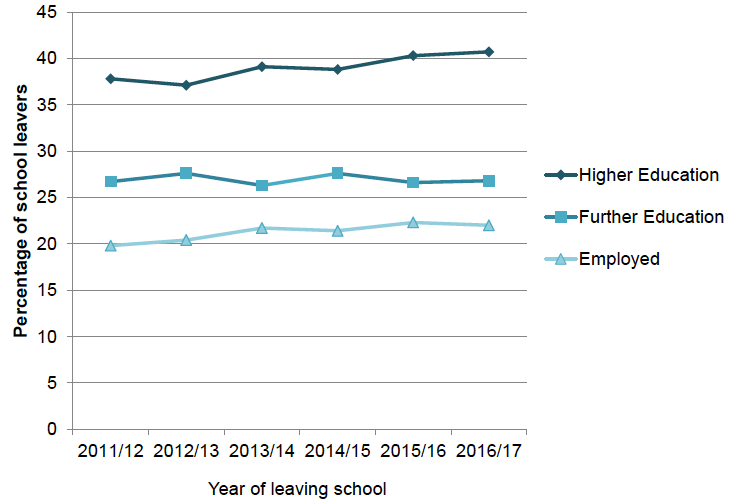
2.2.4. Over the last six years there has been a slight increase in the percentage of leavers continuing their education beyond school in higher education (37.8 per cent in 2011/12 compared to 40.7 per cent in 2016/17). Over the same period the percentage of leavers continuing their education in further education has remained broadly constant (at approximately 27 per cent).
2.2.5. The percentage of leavers entering employment increased from 19.8 per cent in 2011/12 to 21.7 per cent in 2013/14 and has since remained broadly constant (at approximately 22 per cent).
Chart 4: Six year trend in other positive initial destinations of senior phase school leavers (2011/12 – 2016/17)
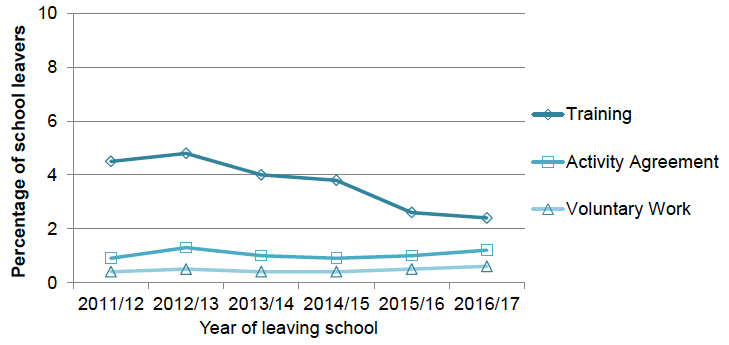
2.2.6. For the fourth year in a row the percentage of leavers entering training has decreased and is now at 2.4 per cent (compared to 4.8 per cent in 2012/13).
2.2.7. The percentage of leavers in activity agreements or undertaking voluntary work has remained low over the last six years (1.2 per cent and 0.6 per cent respectively in 2016/17).
Chart 5: Six year trend in other destinations of senior phase school leavers (2011/12 – 2016/17)
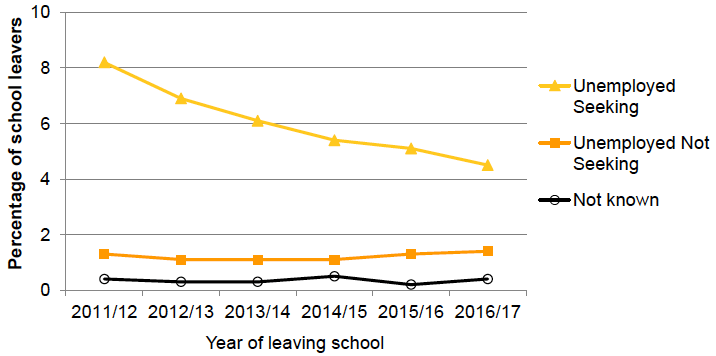
2.2.8. The percentage of leavers who are unemployed and seeking work has decreased over the last six years (4.5 per cent in 2016/17 compared to 8.2 per cent in 2011/12). The percentage of leavers who are unemployed and not seeking work has slightly increased over the last two years from 1.1 per cent in 2014/15 to 1.4 per cent in 2016/17.
2.2.9. The percentage of leavers whose initial destinations are not known has remained low over the last six years (at approximately 0.4 per cent).
Contact
There is a problem
Thanks for your feedback