Scottish connections (diaspora) work: literature review
Reports on findings from a literature review looking at international examples of engagement activities, initiatives and strategies in relation to various diasporic communities.
2. Context: Diaspora Strategies Worldwide
42. When considering diaspora strategies in general, we drew on the Organisation for Economic Cooperation and Development’s (OECD) report, Connecting with Emigrants,[12] which draws on the Database on Immigrants in OECD and non-OECD Countries: DIOC.[13] As noted by the Migration Data Portal, comparative data are often not available elsewhere in the world:
“Due to the lack of comparable data in many regions in the world, it is difficult to describe global trends of migration flows. Annual, comparable migration flows data are largely limited to countries in the Organisation for Economic Co-operation and Development (OECD).”[14]
43. The OECD data were also useful as they connected data to policy, saying that, in the OECD’s view, migrant populations offered opportunities to countries, and that countries of origin were increasingly aware that building links with diasporas should be a priority, but that their contribution depended on the size and characteristics of the diaspora such as skills and age. In the early years of this century, concerned by “brain drains”, OECD countries focused on policies to encourage the return of diasporas. More recently (2015), they recognised that this was not the only way forward. They also recognised that diasporas could act as ambassadors for their home countries.
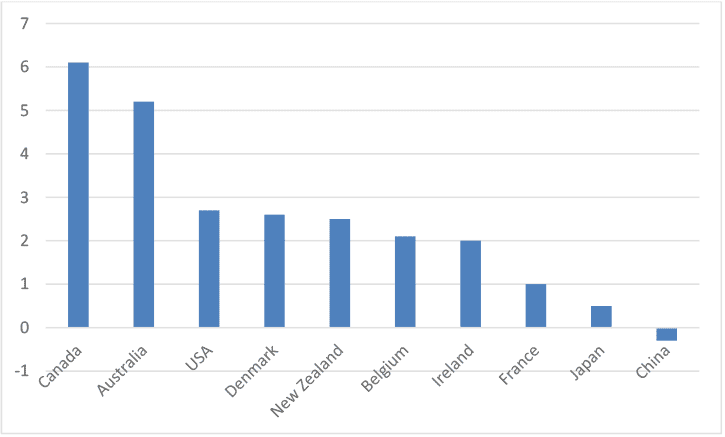
44. The OECD uses migration statistics as the most useful measure for diasporas in the absence of better data. While OECD data are useful, there are more up to date databases of migration produced by the United Nations (UN).[15] While we could not identify detailed up to date databases on diaspora populations as such, we found that the concept of net migration was useful as it gives a picture of flows of migrant populations over a period.[16] For the countries in this study the UN’s estimates of net migration flows over the period 2020-25 are (see Figure 1):
45. The UN data do not, however, give up-to-date emigration rates. In our sample, Ireland had the highest emigration rate of any OECD country at 17.4%,[18] followed by New Zealand at 13.8% (see Figure 2, below). The countries with the lowest emigration rates were the USA and Japan – both less than 1%. The UK rate was 7%, which was relatively high for an OECD country. The favourite destination countries for emigrants from OECD countries were other OECD countries: the USA, Germany, the UK, Australia, France, and Canada.
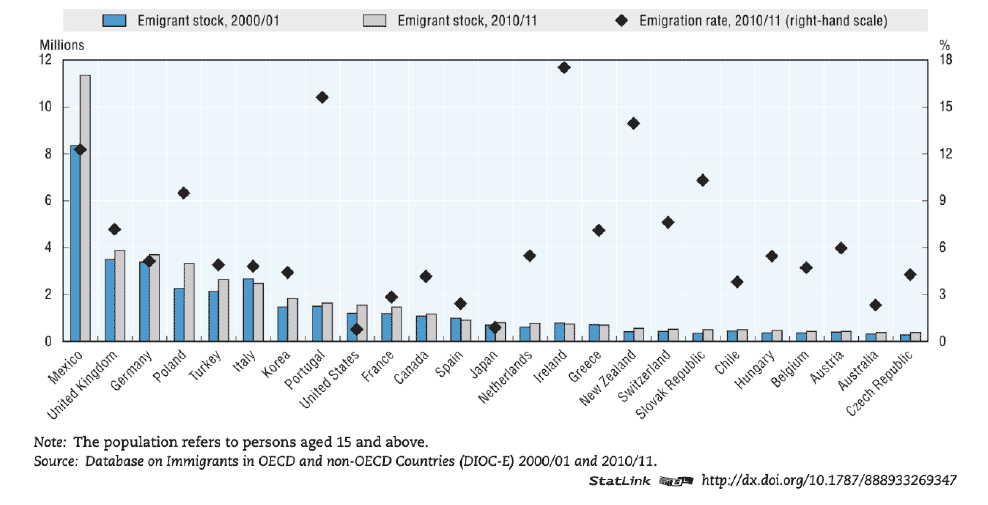 Figure 2: Number of emigrants and emigration rates by main OECD countries of origin (2010-11)
[19]
Figure 2: Number of emigrants and emigration rates by main OECD countries of origin (2010-11)
[19]
46. Emigrants from OECD countries were broadly gender-balanced (though Japan had a high proportion of female emigrants). Emigrants from OECD countries also tended to be older than those from other countries, and 36% were classed as highly skilled. Women tended to be slightly more educated than men. It is worth noting, however, that the skill level of emigrants varies both by country of origin and by destination country for reasons of age profile and duration of stay – international students affect the statistics.[20]
47. The risk of a “brain drain” effect is increased by selective migration and immigration policies. Although this is overall lower for OECD than for non-OECD countries, the UK does have a comparatively high rate of skilled emigration – the OECD average emigration rate of the highly-skilled is 3.8%, for the UK it is over 10%, and for Ireland it is 20%.[21]
48. The issue of migration is important for Scotland. Historically, as noted in Scotland’s first national population strategy, Scotland experienced negative net migration for decades, with more people leaving Scotland than arriving. [22] That legacy means that Scotland today is more reliant on migration than other parts of the UK. Over the past 20 years, however, Scotland's migration flows have changed, with inward migration from overseas rising significantly in the 2000s. Scotland’s population growth in the latest year, however, was 0.05% (2,700 people), the slowest since mid-2003.[23] According to the National Records of Scotland (NRS), population growth slowed due to more deaths and lower levels of net migration. [24] However 7,900 more people moved to Scotland from overseas than left. More recent statistics published by the NRS on Migration between Scotland and Overseas published in 2021,showed that despite this net gain, there was a sharp increase in the numbers of (mainly younger Scots aged between 16 and 34) going overseas in 2019-20 to the highest total level for 20 years. [25]
49. Emigration is likely to continue. According to Gallup, people's desire to migrate permanently to another country increased between 2015 and 2017. Fifteen percent of the world's adults (more than 750 million people) said they would like to move to another country if they had the opportunity, up from 14% between 2013 and 2016, and 13% between 2010 and 2012, but still lower than the 16% between 2007 and 2009. The rate is higher among the highly-skilled and the young. Loss of skilled young people negatively affects economic growth and accelerates the ageing of the population – critical for some countries.
50. The OECD’s focus on emigration rates was reflected in the policies in our sample countries who mostly targeted expatriates – people who had gone to work or live overseas. This was the case with Australia, Belgium (Flanders), Canada (Québec), China, Denmark, France, Ireland, Japan, and New Zealand. Given the lack of clear national policies or strategies, this was not always stated explicitly, but it can clearly be inferred from the missions and activities of the non-diplomatic institutions, agencies, and civil society bodies supported by governments. While other diaspora segments were targeted by some countries, they were in the minority. Table 1 (below) summarises the diaspora segments targeted by comparators in the study. Please note that the USA and Canada are not shaded as neither country has a strategy which clearly targets one diaspora segment:
| Target segments | Expats (1st generation) | Expats (2nd generation) | Heritage diaspora | Reverse diaspora | Affinity diaspora |
|---|---|---|---|---|---|
| Australia | x | ||||
| Canada | |||||
| China | x | x | x | ||
| Denmark | x | ||||
| Flanders | x | ||||
| France | x | x | x | x | x |
| Ireland | x | x | x | x | x |
| Japan | x | x | x | ||
| New Zealand | x | x | |||
| Québec | x | ||||
| USA |
51. This concern with the contemporary, as opposed to the heritage or affinity diasporas, was also reflected in the policy goals of comparator countries, where the most common policy goals were economic, followed by cultural. Surprisingly few countries saw their diasporas as contributors to their public diplomacy or international promotion. Table 2 (below) summarises the policy goals we could identify from official websites and the literature:
| Policy goals | Investment | Business networks | Return of expatriates | Knowledge exchange | Culture | Education | Tourism | Citizenship | Nation branding | Soft Power |
|---|---|---|---|---|---|---|---|---|---|---|
| Australia | x | x | x | x | ||||||
| Canada | x | x | x | x | x | x | ||||
| China | x | x | x | x | x | |||||
| Denmark | x | |||||||||
| Flanders | x | x | x | x | ||||||
| France | x | x | x | x | x | x | x | |||
| Ireland | x | x | x | x | x | x | x | x | x | |
| Japan | x | x | x | x | x | x | x | x | ||
| New Zealand | x | x | ||||||||
| Québec | x | x | x | x | x | x | x | |||
| USA |
52. Table 2 also confirms that while a small number of comparators addressed most of the policy goals of diaspora engagement, most tended to focus their efforts on a specific diaspora group or sector.
53. Institutional arrangements also varied, reflecting the ebb and flow of policy interest and resource commitment. Table 3 (next page) summarises the principal channels through which the countries surveyed engaged with their diasporas:
| Institutions | Government Minister | Policy and strategy | Dedicated resources | Government agency | International offices | Civil society partners | Membership organisations | Alumni support |
|---|---|---|---|---|---|---|---|---|
| Australia | x | x | o | x | x | |||
| Canada | o | x | ||||||
| China | x | x | x | x | o | x | ||
| Denmark | o | x | x | |||||
| Flanders | x | x | x | x | x | |||
| France | x | x | x | x | o | x | x | |
| Ireland | x | x | x | x | o | x | x | x |
| Japan | x | x | x | x | o | x | ||
| New Zealand | x | x | o | |||||
| Québec | x | x | x | |||||
| USA | o | x |
Key:
o - Embassies and Consulates
x - Sub-state or arm's length bodies
54. Having summarised the comparator countries, the following country reviews assess them in more detail across the dimensions of:
- Diaspora target segments
- Policy goals
- Brand architecture (including values)
- Institutions and resources
Contact
Email: Minna.liinpaa@gov.scot
There is a problem
Thanks for your feedback