Health - redesign of urgent care: evaluation - main report
The Redesign of Urgent Care pathway aims to improve patients’ access to urgent care. The evaluation captured patient and staff experiences of the pathway and analysed key urgent care delivery metrics, enhancing our understanding of what is working well and areas for improvement.
5. Patient Experience of the RUC pathway
This section outlines the findings from the Patient survey[24]. Consistent with the Discontinued Caller Survey in this section the term A&E is being used to refer to the Emergency Department and is not being used as an umbrella term for both the Emergency Department and Minor Injuries Unit. The findings are structured around patient experiences of the main ‘touchpoints’ in the pathway: NHS 24 111, NHS Boards’ Flow Navigation Centres (FNCs), A&E/Minor Injuries Units (MIUs) and other services accessed. Patient’s overall experiences of the urgent care pathway, such as the length of time it took to get the care they needed and whether they thought services worked well together, are then explored.
It was the intention to provide further insights into any differences in reported experiences by demographic subgroups. However, it was not possible to undertake analysis by demographic groups (e.g., age) as some callers to NHS 24 111 were calling on behalf of someone else (i.e. a child or another adult). This is a remaining evidence gap which may require exploration. When interpreting findings which specifically relate to caller experiences for adults who called NHS 24 111 on behalf of another adult (e.g., experience of care from the NHS 24 111 call handler), it should be kept in mind that as it was the adult patient who completed the questionnaire, and not the adult who made the call, how these experiences were captured cannot be inferred.
As mentioned in Section 3, weighting was applied to the counts associated with the results to account for differences in group representation within the sample to ensure the results accurately represent the overall population, rather than being disproportionately influenced by under- or over-represented groups. For the majority of cases the charts in this section reflect the weighted counts and weighted proportions (i.e. percentages) but for a small number where the chart is based on positive scores, the number of respondents in each breakdown category provided are unweighted (i.e. they reflect the true number of responses). Therefore, weighted counts presented in the text alongside the weighted percentage figure may differ to the count of respondents shown in each category within the chart (e.g., Figure 5.6). Please note in the charts, any response option/breakdown group marked with an asterisk indicates where suppression was required. Where the number of respondents is reported in a heading for a chart, please note this represents the total number of respondents who gave an answer to the question, which is inclusive of suppressed values. Likewise, some charts will not equate to 100% as suppressed responses have been omitted (e.g., Figure 5.2).
5.1 Access to NHS 24 111 and the urgent care pathway
Similar to the Discontinued Caller Survey, most respondents (76%; n=498) contacted NHS 24 111 first about their health concern rather than contacting another service. This suggests a relatively good level of awareness that NHS 24 111 should be contacted first to access urgent, non-life threatening, care (see Technical Report, Section 8, Table 2). As with the Discontinued Caller Survey, a higher proportion of respondents contacted NHS 24 111 first if they called out-of-hours (85%; n=308) compared to in-hours (64%; n=190).
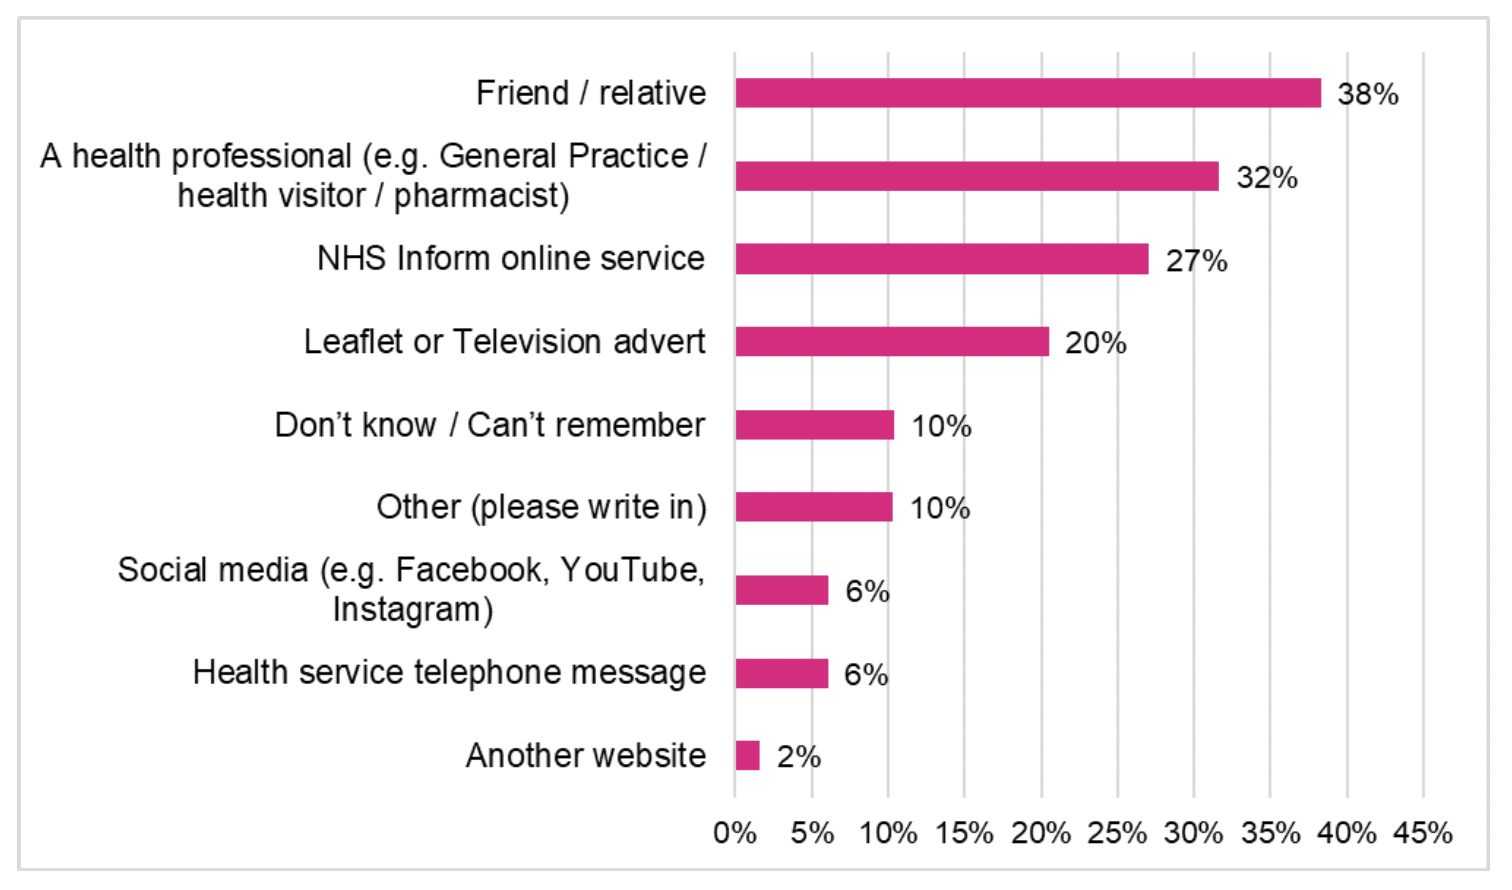
Most respondents had learned about contacting NHS 24 111 for urgent care via a friend/relative (38%), via a health professional (32%) and/or via NHS Inform online services (27%) (Figure 5.1). One in five (20%, n=134) reported they had learned about NHS 24 111 via a leaflet or television advert.
The main reasons given by respondents for contacting NHS 24 111 first, rather than another urgent care service, were:
- 31% (n=150) said they needed help out-of-hours
- 24% (n=115) said they thought it was the most suitable service for their health concern
- 20% (n=95) heard that NHS 24 111 should be contacted first to access urgent care when it’s not an emergency
Only 8% (n=37) of respondents said the main reason for contacting NHS 24 111 was to have a booked appointment at A&E or a Minor Injuries Unit (See Technical Report, Section 8, Table 3). A member of staff in a clinical role who participated in a focus group, felt there is a lack of awareness amongst the public that it’s possible to have a scheduled appointment at A&E if you contact NHS 24 111 (see Section 6.2.2).
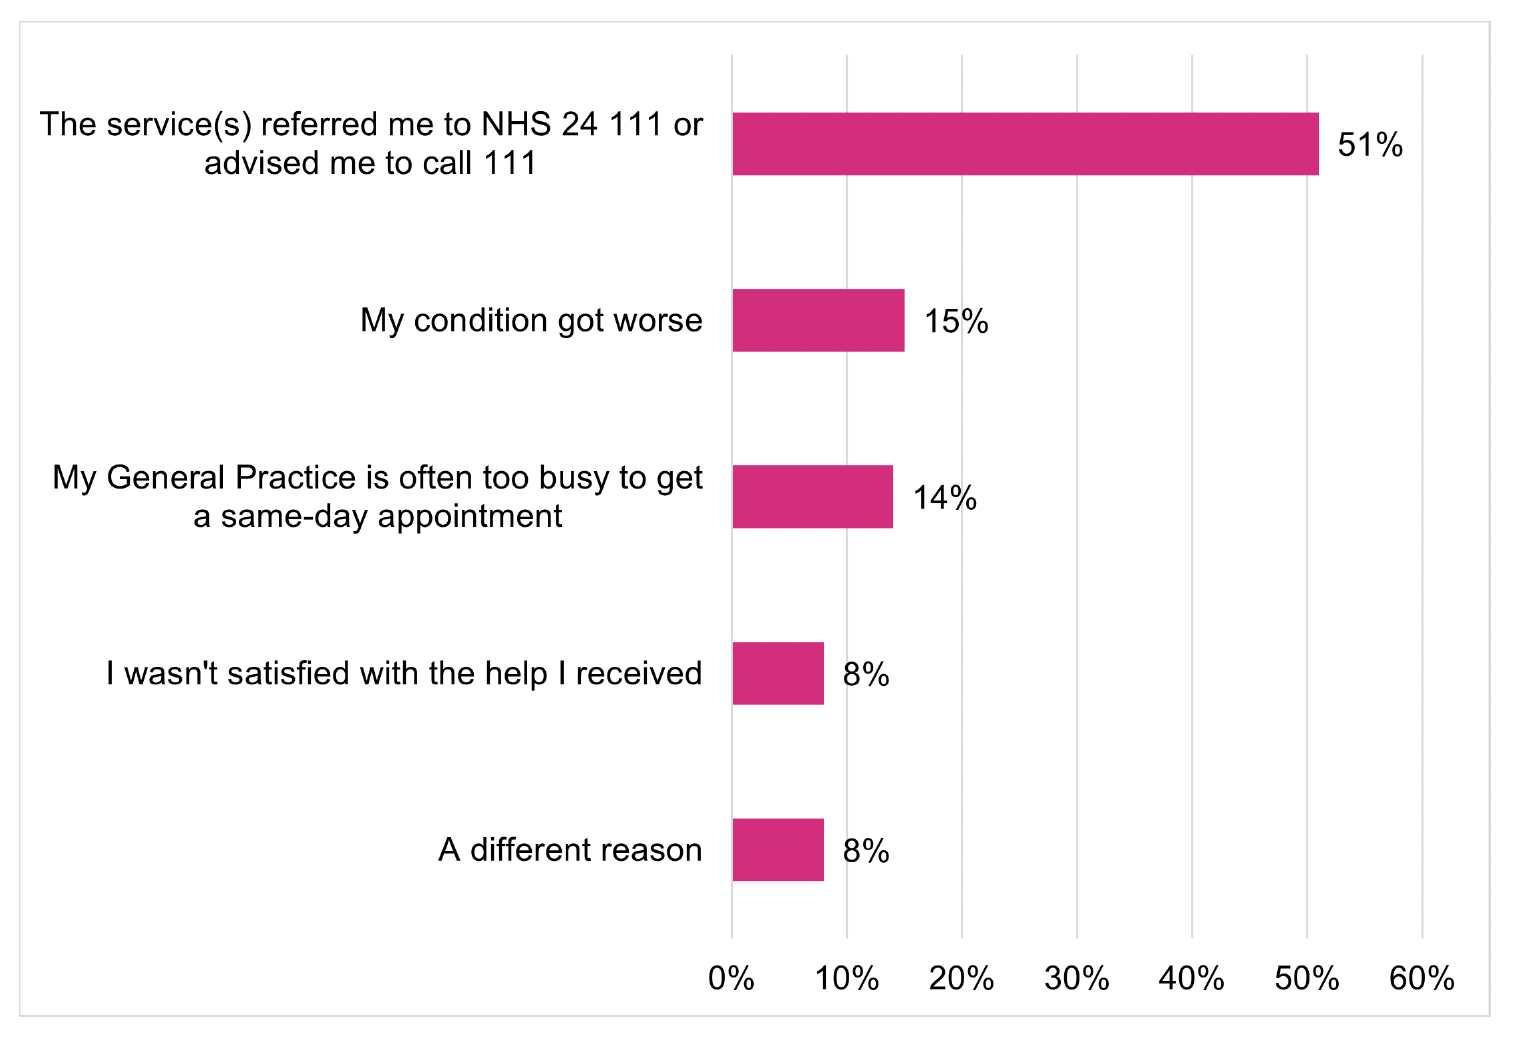
Around one quarter of respondents (24%; n=159) had contacted another service about their health concern before contacting NHS 24 111. Whilst the aim of the RUC pathway is for NHS 24 111 to be the first point of contact, of those who had contacted another service before NHS 24 111, 79% (n=125) had contacted a General Practice (Technical Report, Section 8, Table 4) which implies that their health concern may not have initially been considered urgent by the patient. Most respondents (51%; n=75) reported the reason for them then contacting NHS 24 111 was because they were referred or advised to call 111. This was followed by their condition got worse (15%) and their General Practice is often too busy to get a same day appointment (14%) (Figure 5.2). These three most common reasons people gave for subsequently contacting NHS 24 111 in the Patient Survey were the same as those found in the Discontinued Caller survey. Although a higher proportion of respondents in the Patient survey (51%; n=75) said they had been referred to NHS 24 111. The difficulty for people to get a GP appointment was highlighted by NHS staff in the focus group discussions (Section 6.2.4.2).
5.2 Experience of care from NHS 24 111
5.2.1 Length of time for call to be answered
Understanding patient experience of the length of time they waited to access the RUC pathway via NHS 24 111 is important, as a previous review showed that NHS 24 Time to Answer (TTA) and call abandonment rates had generally increased between January 2020 and August 2021, particularly out of hours and at weekends[25]. Existing national call wait times for the RUC pathway are shown in Table 5.1 with the call wait times experienced by the Patient survey sample and the respondents provided in Tables 5.2 and 5.3. Additionally the Patient survey respondents perceptions in relation to the amount of time they spent waiting on their call to NHS 24 111 is presented in relation to the time they actually waited (see Figure 5.3) as is their overall experience of the RUC pathway.
The median NHS 24 111 TTA to calls to the A&E (RUC) pathway between June 2023 and May 2024 were:
- All calls – 6 minutes and 13 seconds
- Weekday in hours - 6 minutes and 9 seconds
- Weekday out of hours – 6 minutes and 17 seconds
- Weekend – 7 minutes and 4 seconds
See Technical Report, Section 4, Tables 7 to 10 for details.
As shown in Table 5.1, both the mean and median TTA were longer at the weekend when compared with both weekday in hours and weekday out of hours. The maximum TTA of 1 hour, 56 minutes and 2 seconds was recorded in hours in April 2024, which is likely to reflect the Easter public holiday (Technical Report, Section 4, Table 8). Additionally, the national level data for all calls was noticeably lower for June to November 2023 (monthly median being between 1 minute 48 seconds (August 2023) and 4 minutes 30 seconds (September 2023)) compared with December 2023 to May 2024 (monthly median being between 7 minutes 56 seconds (January 2024) and 12 minutes 26 seconds (March 2024)). See Technical Report, Section 4, Table 7 for further details.
| Day/Time of call | Mean TTA (mm:ss) | Median TTA (mm:ss) | Minimum TTA (h:mm:ss) | Maximum TTA (h:mm:ss) |
|---|---|---|---|---|
| All | 09:27 | 06:13 | 0:00:01 | 1:56:02 |
| Weekday in hours[26] | 10:28 | 06:09 | 0:00:01 | 1:56:02 |
| Weekday out of hours[27] | 07:45 | 06:17 | 0:00:02 | 1:12:39 |
| Weekend[28] | 18:30 | 07:04 | 0:00:01 | 1:02:48 |
Table 5.2, shows the NHS 24 111 TTA for the Patient survey sample and Table 5.3 shows the NHS 24 111 TTA for those that responded. For the respondent sample, the median TTA were:
- All respondents – 8 minutes and 14 seconds
- Weekday daytime (i.e. in hours) – 11 minutes and 27 seconds
- Weekday evening/night (i.e. out of hours) – 6 minutes and 10 seconds
- Weekend daytime – 7 minutes and 52 seconds
- Weekend evening/night – 11 minutes and 13 seconds
| Day/Time of call | Number in sample | Average TTA (hh:mm:ss) | Median TTA (hh:mm:ss) | Minimum TTA (hh:mm:ss) | Maximum TTA (hh:mm:ss) |
|---|---|---|---|---|---|
| All | 3499 | 00:11:22 | 00:08:27 | 00:00:03 | 01:08:26 |
| Weekday daytime (this includes any public holidays) | 1432 | 00:13:50 | 00:09:52 | 00:00:03 | 01:08:26 |
| Weekday evening/night | 818 | 00:09:40 | 00:07:47 | 00:00:04 | 00:41:07 |
| Weekend daytime | 850 | 00:08:49 | 00:06:28 | 00:00:05 | 00:35:55 |
| Weekend evening/night | 399 | 00:11:24 | 00:11:12 | 00:00:05 | 00:37:50 |
| Day/time of call | Number in sample | Average TTA (hh:mm:ss) | Median TTA (hh:mm:ss) | Minimum TTA (hh:mm:ss) | Maximum TTA (hh:mm:ss) |
|---|---|---|---|---|---|
| All | 662 | 00:11:50 | 00:08:14 | 00:00:06 | 01:08:26 |
| Weekday daytime (this includes any public holidays) | 295 | 00:14:48 | 00:11:27 | 00:00:06 | 01:08:26 |
| Weekday evening/night | 137 | 00:08:56 | 00:06:10 | 00:00:06 | 00:37:49 |
| Weekend daytime | 166 | 00:09:20 | 00:07:52 | 00:00:06 | 00:34:49 |
| Weekend evening/night | 64 | 00:10:53 | 00:11:13 | 00:00:06 | 00:31:43 |
Although 62% (n=408) of respondents said they did not have to wait, or had to wait but not for long for their call to NHS 24 111 to be answered, more than one third of respondents who stayed on the line until their call was answered (36%; n=240) reported that they had to wait either a ‘bit’ or ‘much’ too long (Technical Report, Section 8, Table 7).
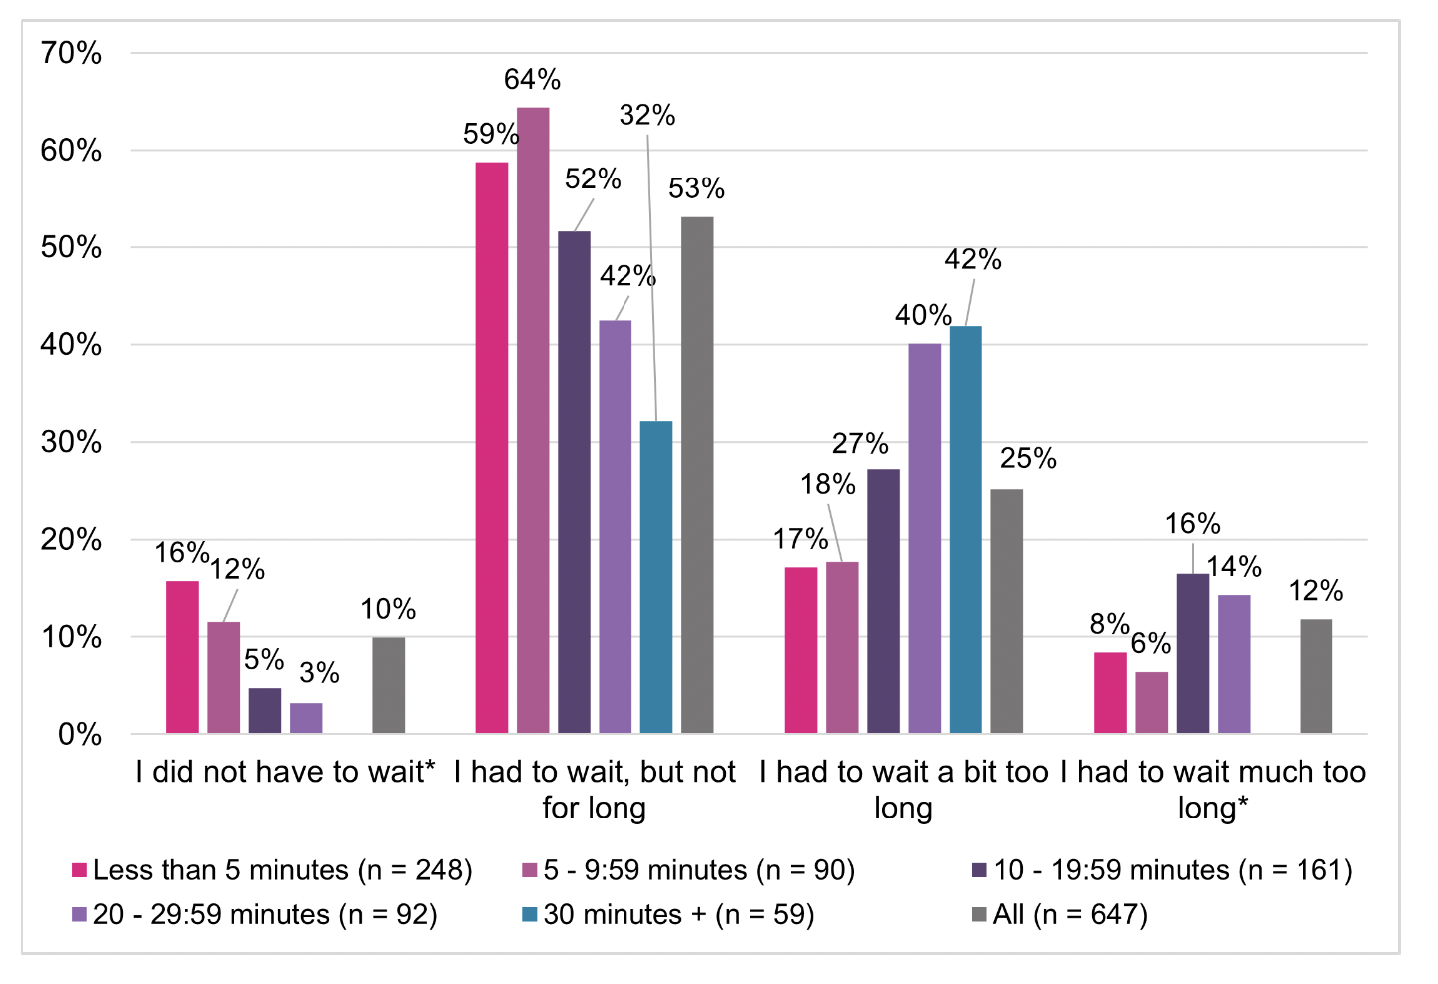
While respondents’ self-reported experience of the time waited is largely comparable to NHS 24 111 recorded data on TTA for respondents included in the sample (Figure 5.3), there are variations in perceptions. For instance, over 30% of those who waited 30 minutes or longer felt they did not have to wait long, or at all, for their call to be answered. Conversely, 25% of those who waited less than 5 minutes reported that they had to wait a bit or much too long. It is important to note that the survey is asking about people’s experiences and how they felt about the length of time they waited; waiting 30 minutes for one person may not seem too long if the reason for their call was not causing them a great deal of pain or concern, whilst for another person a 30 minute wait may seem much too long if they were much more concerned or in a lot of pain. Also, the time of day/week is also likely to be a factor influencing perceptions as some people may be generally aware resources are more stretched on weekends. Furthermore, there is a chance some patients answered the survey based on a different episode of care to that recorded by NHS 24.
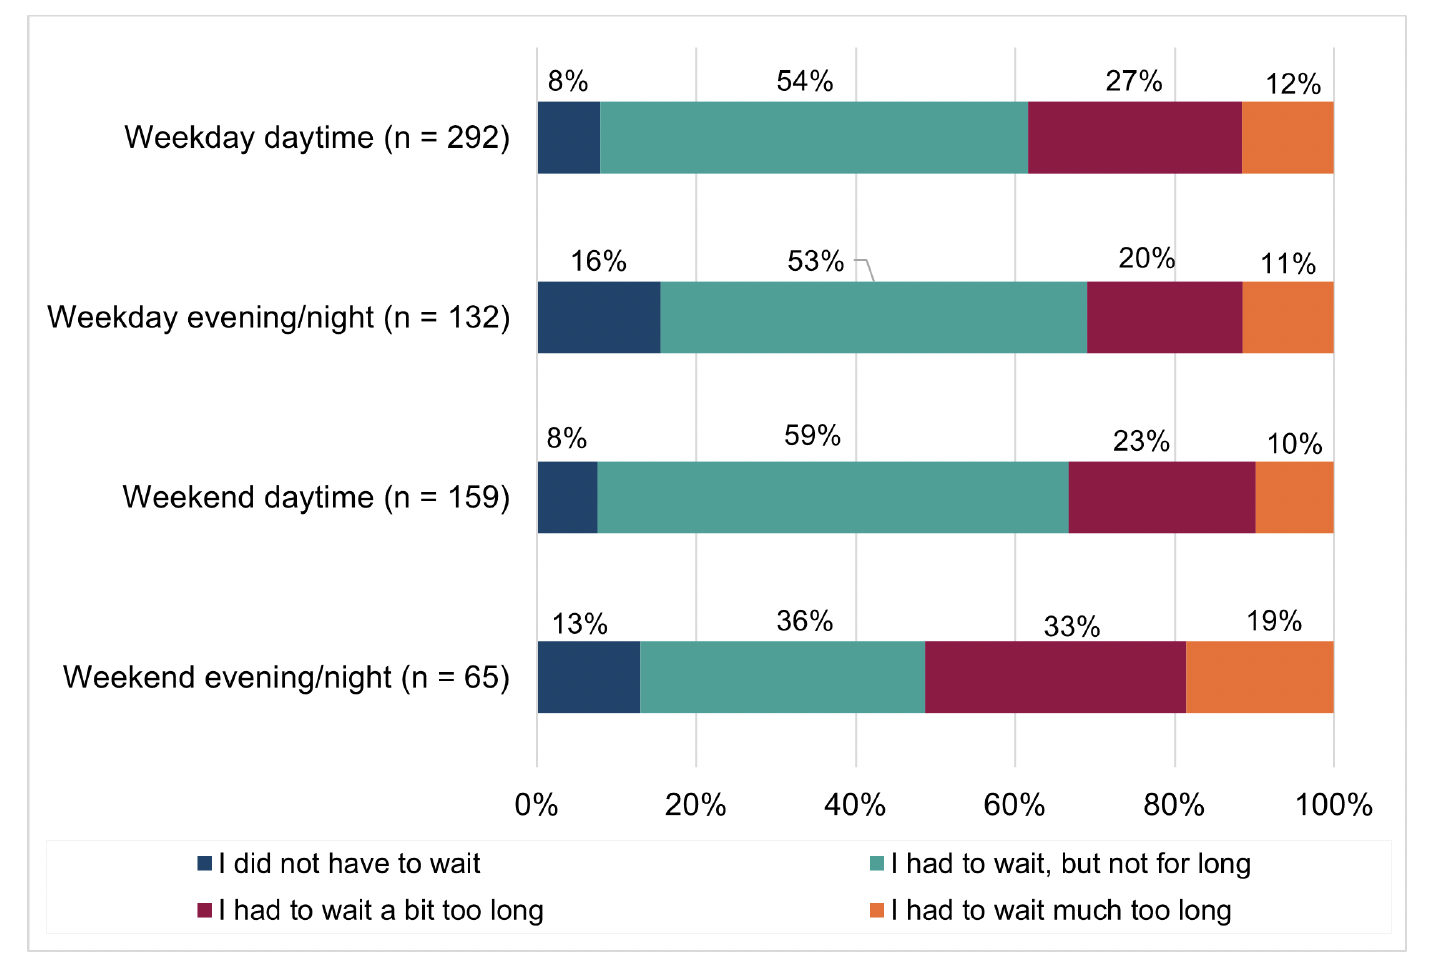
Comparisons by time of call (see Figure 5.4) demonstrated that respondents who contacted NHS 24 111 on a weekday evening/night[31] were most likely to report that they did not have to wait or had to wait but not for long (69%; n=91), before their call was answered. In contrast, of those who accessed the service on a weekend evening/night, 49% (n=32) said that they did not have to wait at all, or for not too long, before speaking to someone. These differences, however, were not found to be statistically significant.
There were no significant differences in the NHS 24 111 TTA on respondents’ reported experiences of the subsequent care received from the NHS 24 111 call handler and/or their overall rating of urgent care services or whether they would call NHS 24 111 in the future (if they had the same health concern and the same time of day/night).
5.2.2 Experience of care from NHS 24 111 call handler
Respondents were positive about the relational aspects of care received from the call handler at NHS 24 111:
- 86% (n=565) said the person they spoke with ‘definitely’ listened carefully
- 87% (n=557) said the person ‘definitely’ answered their questions in a way they could understand
- 76% (n=503) ‘definitely' had confidence and trust in the person they spoke with
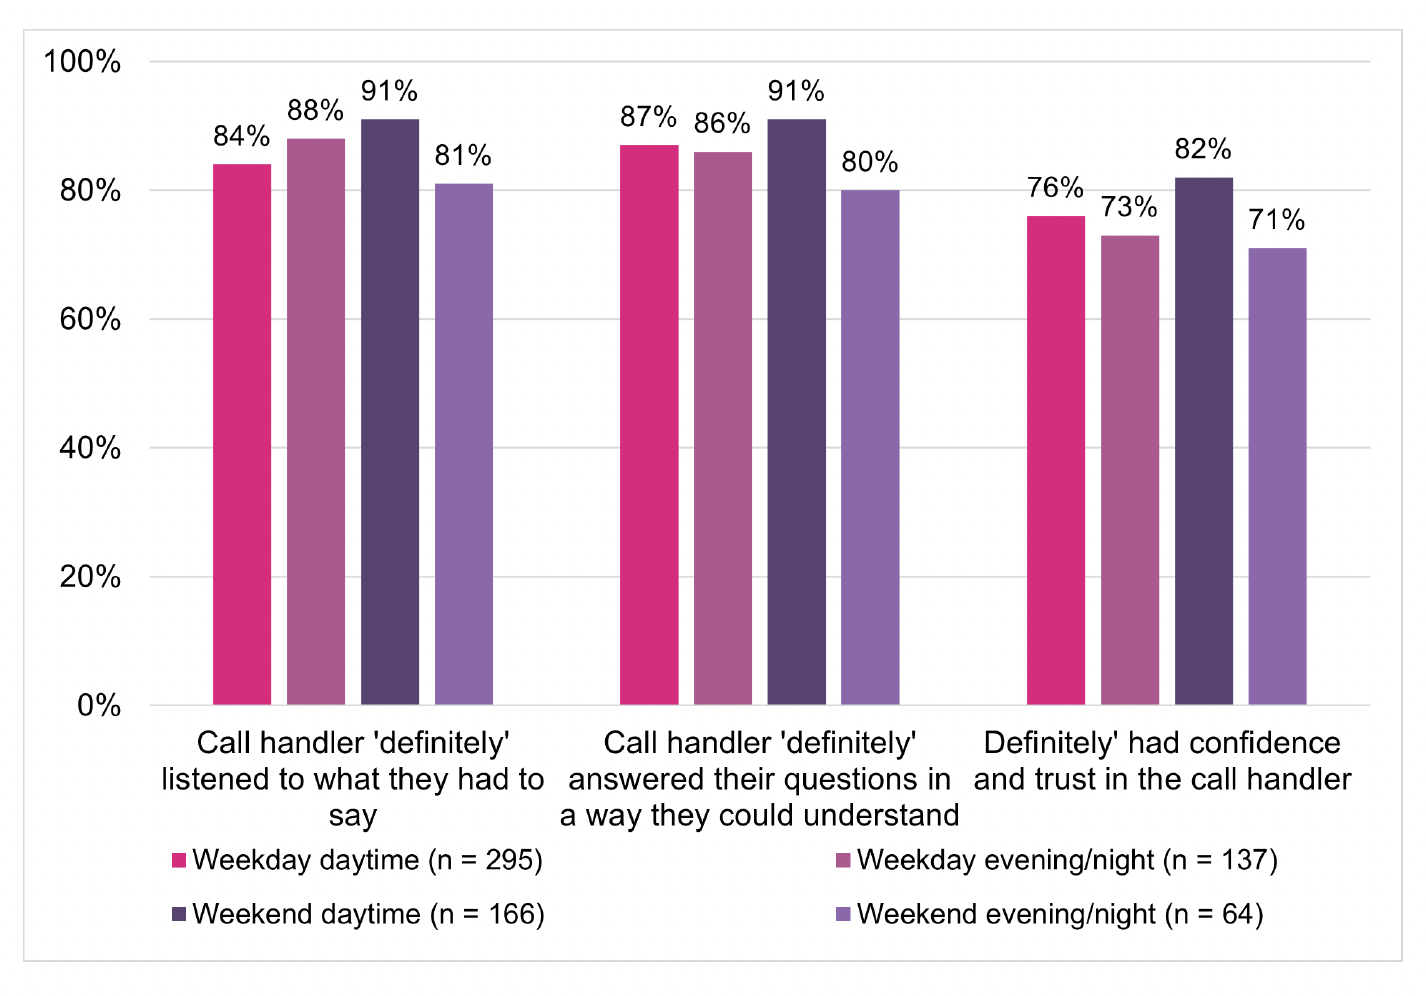
Figure 5.5 shows a comparison of respondent experiences of the care received from the call handler by the day/time they contacted NHS 24 111. Although the differences are not significant, those who called NHS 24 111 during the weekend daytime were the most positive about their experiences of the call handler, with the least positive responses from respondents who called the service on a weekend evening/night. For example, 82% of those who called NHS 24 111 during weekend daytime ‘definitely’ had confidence and trust in the call handler. This was true for 71% of those calling during weekend evening/night.
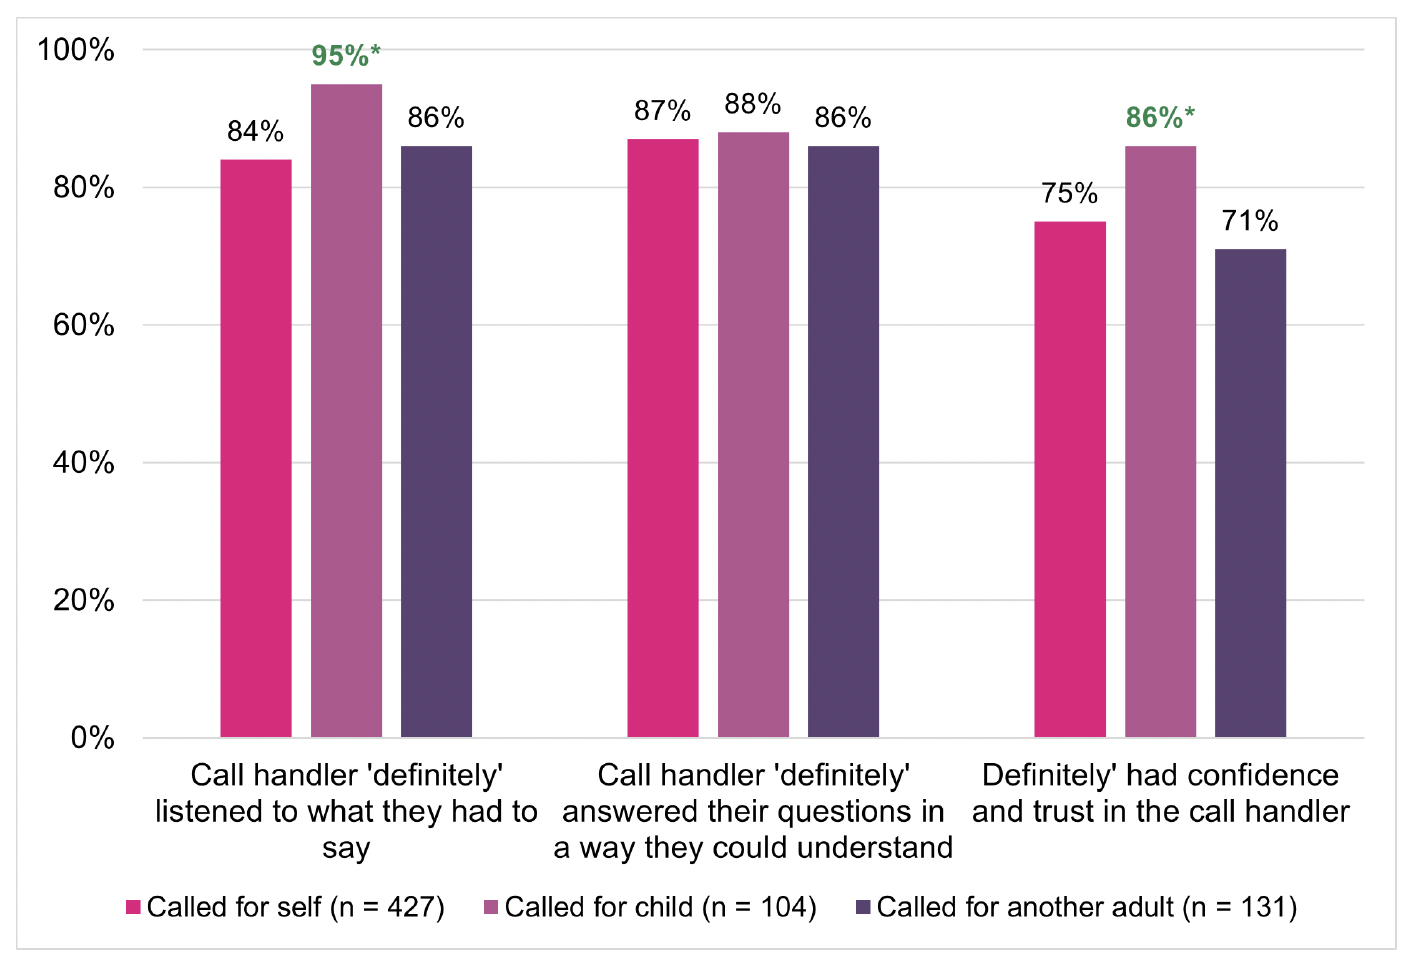
Respondents were significantly more likely to report that the person they spoke to at NHS 24 111 ‘definitely’ listened carefully (95%; n=104), and that they ‘definitely’ had confidence and trust in them (86%; n=96), when calling on behalf of a child than if calling for themselves or another adult (Figure 5.6).
5.2.3 Action or advice received from NHS 24 111
Figure 5.7 shows the NHS 24 111 recorded endpoint for the survey respondents. It should be acknowledged that whilst this is the outcome of the 111 call recorded by NHS 24, some patients may subsequently decide to take a different action. For example, they may have been given self-care advice from NHS 24 111 but still decide to attend A&E services after their call.
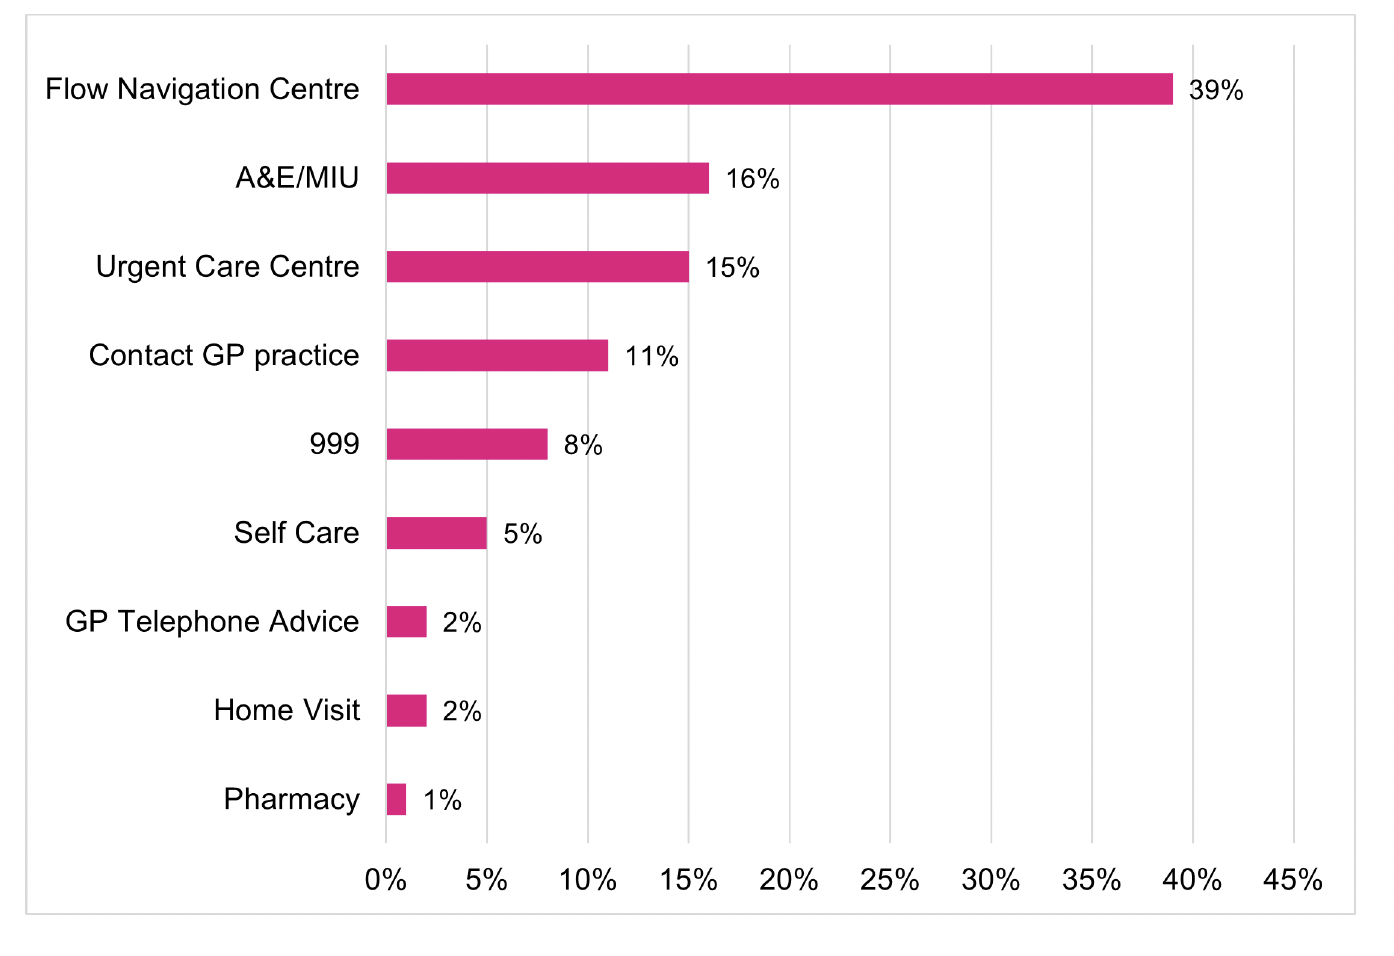
Thirty nine percent (n=258) had been referred to a Flow Navigation Centre (FNC) by NHS 24 111, 16% (n=108) to an A&E or MIU and 15% (n = 103) to an Urgent Care Centre (primary care). Overall:
- 63% (n=416) had a secondary care endpoint (i.e. 999, FNC, A&E and MIU).
- 31% (n=206) had a primary care endpoint (i.e. Urgent Care Centre, Contact GP Practice, GP Telephone advice and Home Visit)
- 6% (n=36) had the self care/No partner action endpoints of self-care and pharmacy.
In comparison, findings from the Discontinued Caller survey showed that of those who discontinued their call to NHS 24 111, 40% (n=155) accessed a secondary care endpoint. This suggests that a larger proportion of patients who access urgent care services via NHS 24 111 have a secondary care outcome when compared to those who discontinue a call to NHS 24 111. However, this does not consider any differences in case-mix: it’s possible that a higher proportion of respondents who wait for their call to be answered have more urgent care needs than those who discontinue their call.
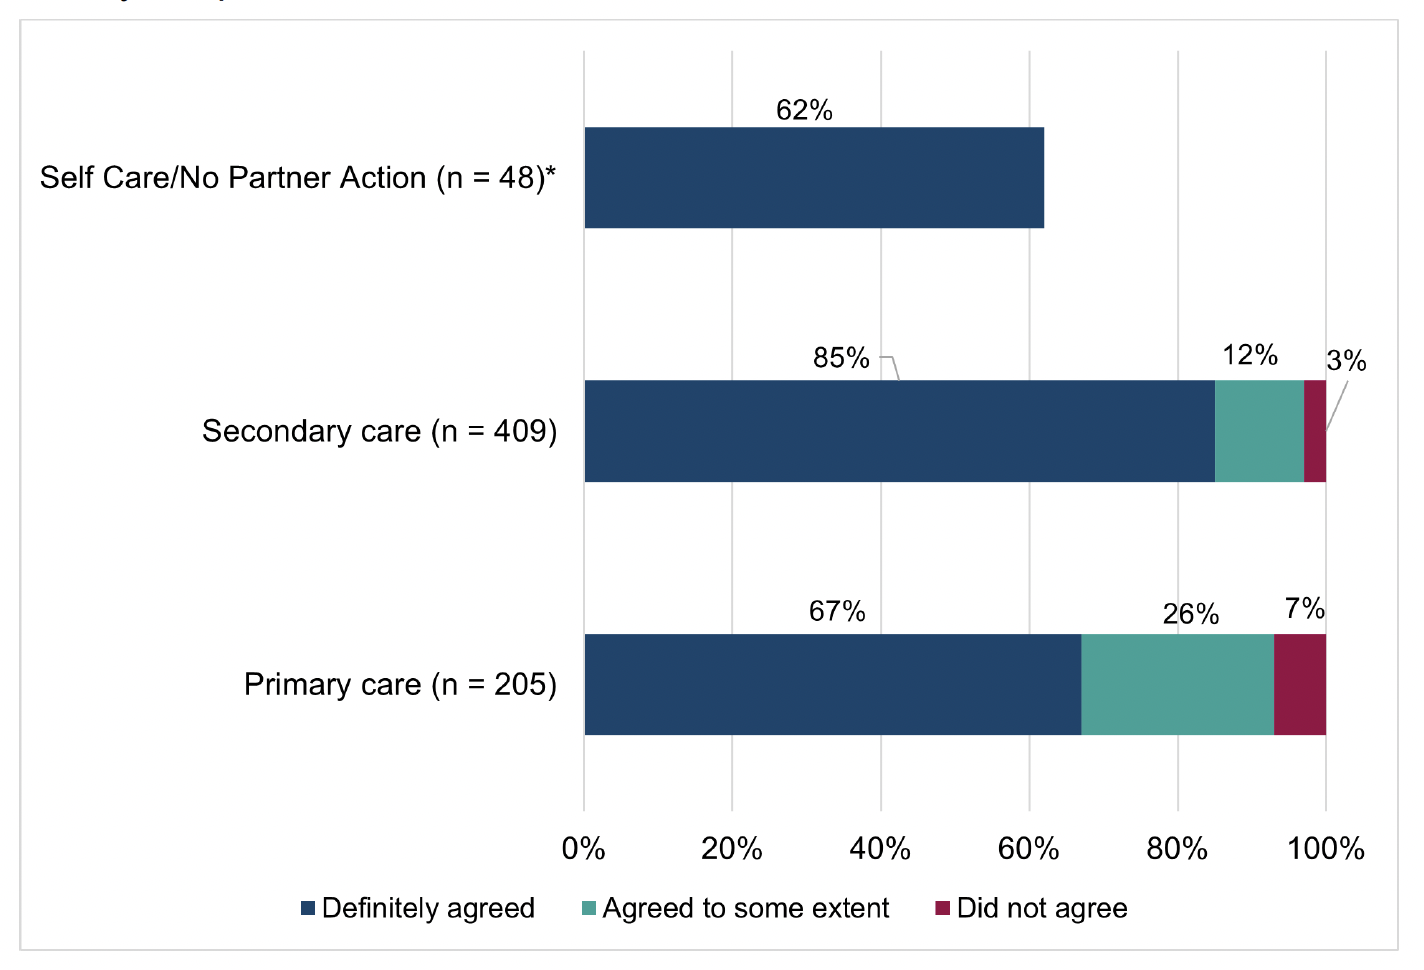
Most respondents (78%; n=514) ‘definitely’ agreed with the action or advice received from NHS 24 111, with a further 18% (n=117) agreeing ‘to some extent’ (Technical Report, Section 8, Table 12). As shown in Figure 5.8, a higher proportion of respondents with a secondary care endpoint (85%; n=346) definitely agreed with the action or advice given by NHS 24 111 when compared to those with a primary care endpoint (67%; n=138) or a self-care/no partner action endpoint (62%; n= 30).
Previous research which analysed linked routine data of NHS 111 and subsequent A&E attendances in an English region found that many patients do not comply with advice, with 11% of patients attending A&E when they were advised to self-care or seek primary care input[33]. Other research that explored patient compliance with advice from NHS 111 in London showed that, overall, callers followed the advice in 49% of calls[34]. Positively, findings from this survey showed a much higher proportion of respondents (93%; n=614) said they followed the advice/action given at the end of the NHS 24 111 call. However, it should be noted that whilst the previous research was based on linking NHS 24 111 call records to urgent care services data, the finding from this survey is based on self-reported compliance with action/advice from NHS 24 111 rather than clinical/attendance data. Furthermore, this survey is focused on respondent experiences of the RUC (A&E) pathway at NHS 24 (rather than all calls to NHS 24 111) and the proportion of secondary care dispositions (endpoints) are higher when compared with the dispositions for all calls to NHS 24 111 (and the previous research) which is likely to affect rates of compliance; as noted above, higher proportions of those with a secondary care endpoint agreed with the action/advice from NHS 24 111.
Of the small proportion of respondents that did not follow the action/advice given by NHS 24 111, or followed the advice ‘to some extent’, 30% (n=13) said this was because their condition changed (improved or worsened) and 25% (n=11) said it was because they tried to follow the advice but it did not work. Other reasons are shown in the Technical Report, Section 8, Table 14.
5.3 Experience of a call back from Flow Navigation Centres
Over half of respondents (59%; n=387) said they received a call back after contacting NHS 24 111. However only 40% (n=268) of respondents had a recorded Flow Navigation Centre endpoint by NHS 24 111 (Figure 5.8, above). This inconsistency may reflect that some respondents may have reported they received a ‘call back’ when it was actually the virtual queue contact from NHS 24. The results in this section are presented for all respondents that said they received a call back and answered the questions about their experience of this. If the results are filtered for just those respondents who had a NHS 24 111 recorded FNC endpoint, the findings are similar but the number of respondents in some groups are too small to present breakdown of findings by subgroups.
A very small proportion of respondents (3%; n=18) said they were expecting to be called back but did not receive a call, and 2% (n=16) said they contacted/visited another urgent care service before they received a call back (Technical Report, Section 8, Table 15). This shows that in general, most patients who were expecting a call back from a health professional did receive it.
5.3.1 Length of time waiting for call back
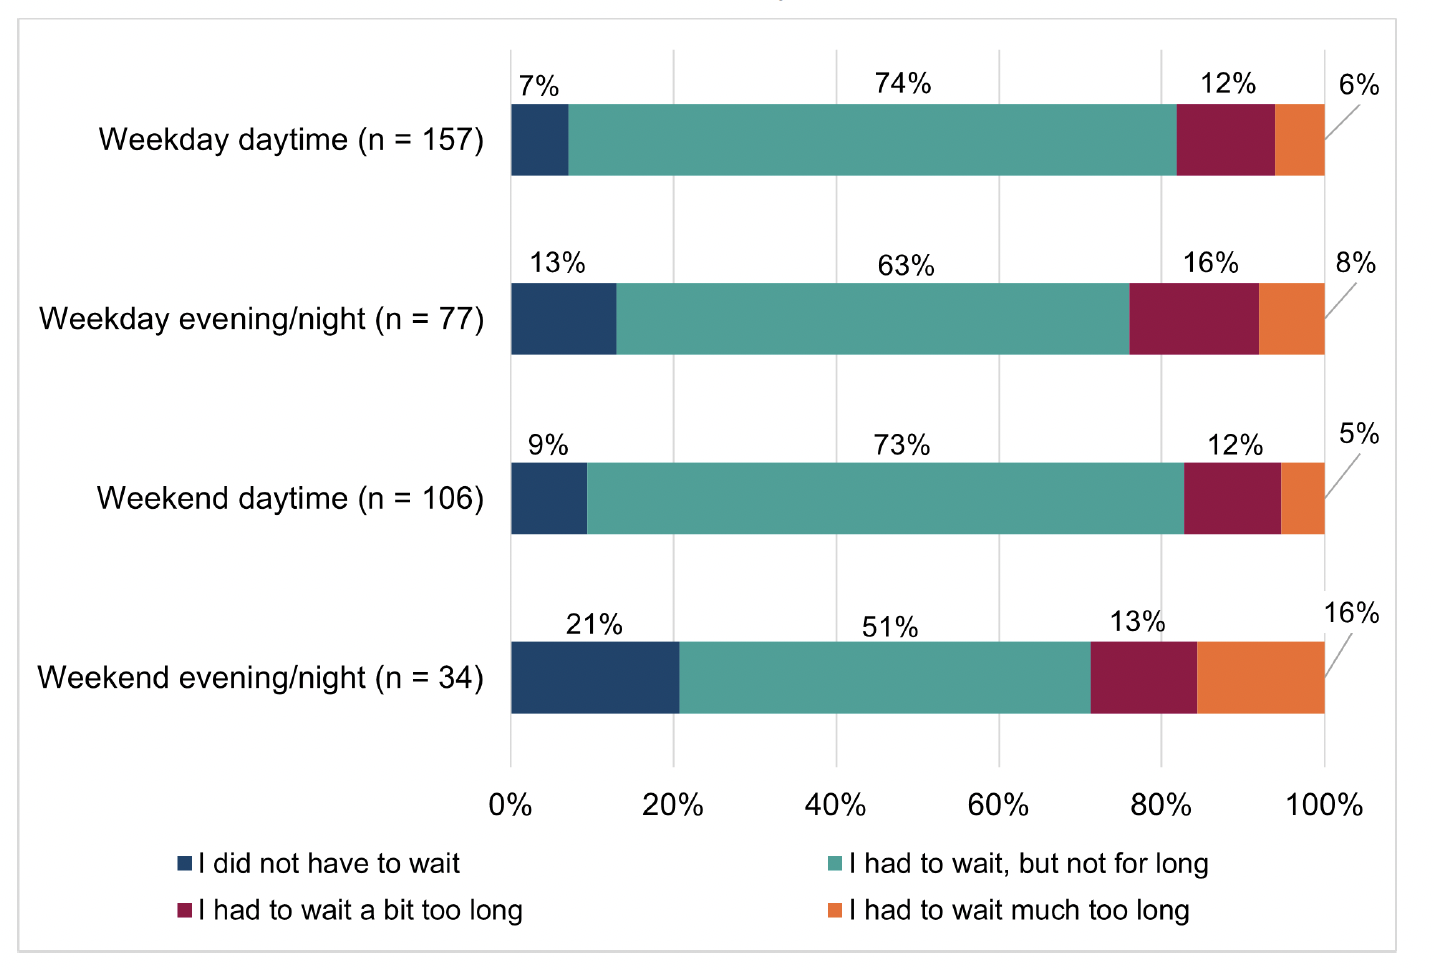
Respondents were more positive about the time they waited for a call back from local health services (FNC) compared to NHS 24 111 TTA. Of those who had a call back from local health services, 79% (n=299) said they did not have to wait, or had to wait but not for long (Technical Report, Section 8, Table 18).
Although the differences were not statistically significant, those respondents who called NHS 24 111 during the day – either on a weekday or weekend - were more likely than callers during the evening or night to report that they did not have to wait, or had to wait but not for long for a call back from the FNC (Figure 5.9). For example, 81.5% of those who waited for a call back from a healthcare professional during the daytime in the week reported that they did not have to wait or they had to wait but not for long. Whilst, for those who waited during the evening/night in the week, 76.5% reported that they did not have to wait or had to wait but not for long.
5.3.2 Experience of care from health professional
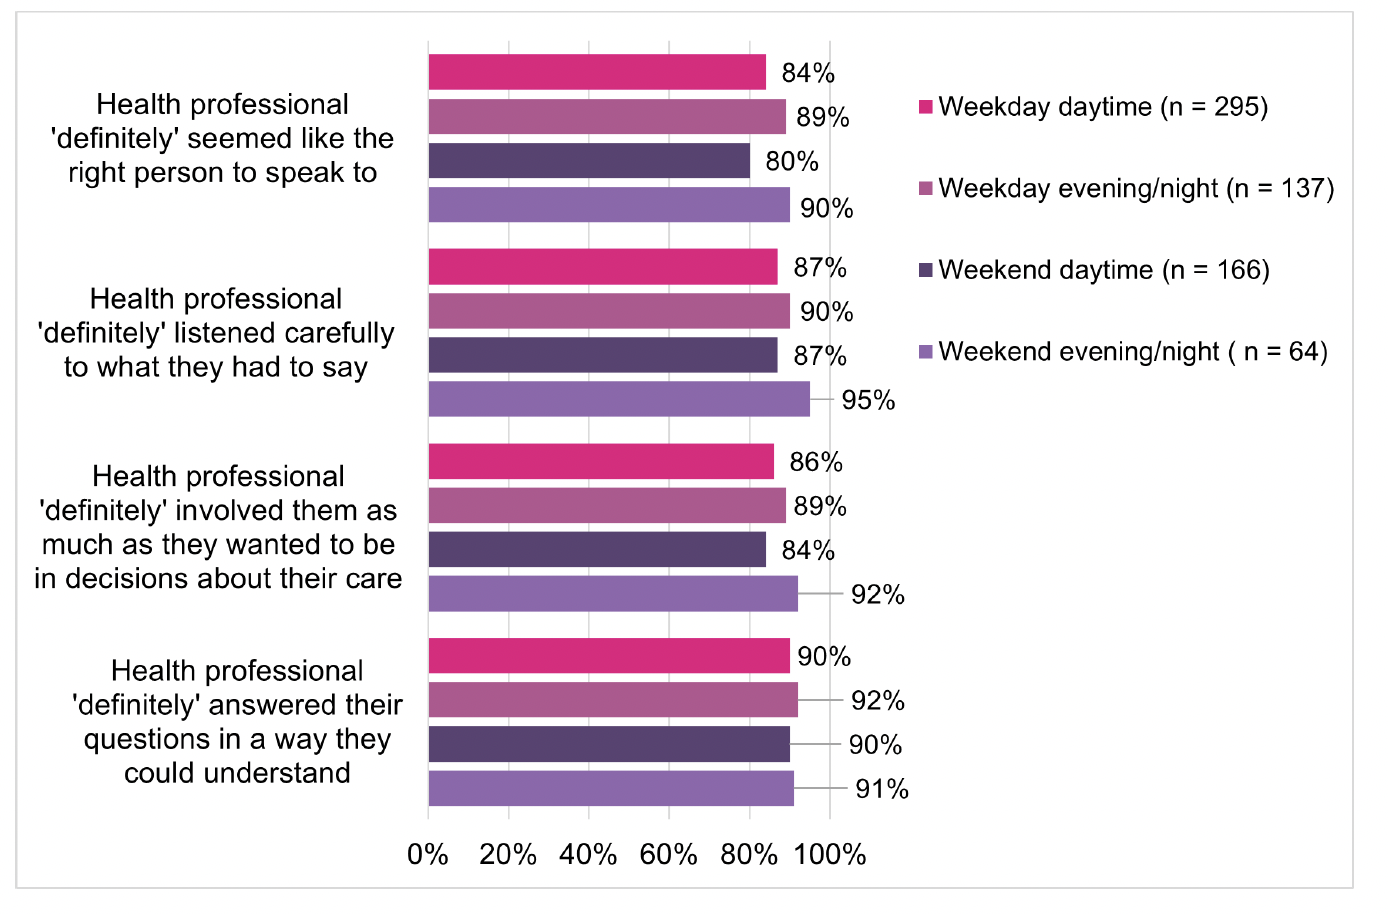
Respondents were positive about the relational aspects of care received from the health professional who called them back from a FNC[35], particularly in terms of answering their questions:
- 91% (n=326) said the person ‘definitely’ answered their questions in a way they could understand
- 89% (n=320) said the person ‘definitely’ listened carefully to what they had to say
- 87% (n=310) said the person ‘definitely’ involved them as much as they wanted to be in decisions about their care and treatment
- 84% (n=317) said the person they spoke with ‘definitely’ seemed like the right person to speak to
Although there were no significant differences in respondents’ experiences of care by the time of initial contact with NHS 24 111, there appears to be a general trend that those who called during the evening/night reported a more positive experience about the care from the health professional who called them back than those who contacted NHS 24 111 during the day (Figure 5.10). For example, 95% of respondents who received a call back during the evening or night at the weekend felt that the health professional ‘definitely’ listened to what they had to say. This is compared to 90% of those who received a call back during the evening or night in the week and 87% of those who received a call back during the day time, both at the weekend and during the week. This is interesting given the previous finding which showed that those who contacted NHS 24 111 in the evening/night generally had to wait longer for a health professional to call them back. This suggests that waiting time for a call back does not necessarily adversely impact on reported experiences of the care received by the health professional.
One in five respondents (20%, n=72) reported the health professional had not fully taken into account their personal circumstances - such as the timing of an appointment or if the respondent was able to get to an advised location – when they were given action or advice; 13% (n=49) said this only happened to some extent and 6% (n=23) said it did not happen. Overall, 71% (n=269) of respondents said their circumstances were definitely considered by the health professional when providing advice or subsequent action (Technical Report, Section 8, Table 24).There were no significant differences in this measure by the day/time of contacting NHS 24 111.
5.3.3 Action or advice received from FNC
Figure 5.11 shows the action or advice respondents received following the consultation with the health professional calling from the FNC. In summary, this shows:
- 63% (n=235) reported being directed to secondary care services: SAS, A&E, or MIU.
- 23% (n=85) reported one of the following primary care outcomes: Out of Hours (OOH) service, outpatient appointment or advised to contact GP.
- 10% (n=36) reported a self-care endpoint i.e. they were given advice on how to take care of their health concern themselves.
- 3% (n=12) reported another service/action.
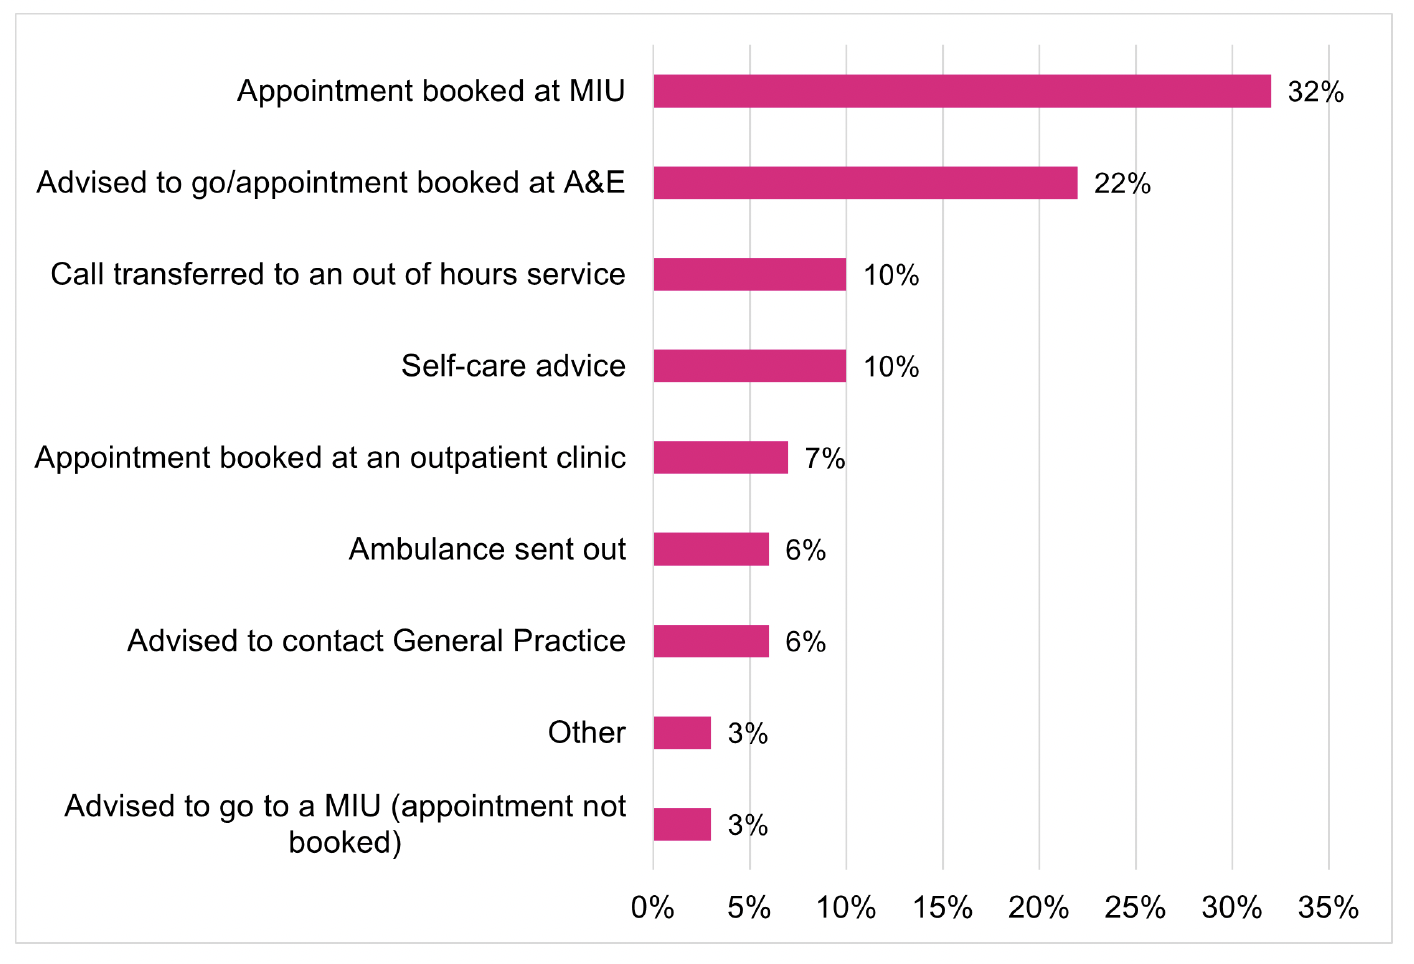
Previous exploratory data linkage conducted as part of the second national staging report[36] suggested that, although it varies by NHS Board, approximately 50% of FNC activity is referred to A&E services. This survey showed a similar finding: 57% (n=214) of respondents reported they were advised to go to either A&E or MIU or that an appointment was booked at an A&E or MIU.
As previously noted, one of the aims of the redesign of urgent care is to convert some unscheduled care activity to planned care activity. The previous staging review[37] noted that planned attendances increased from 1% to 5% between 2019 and 2021, with approximately two thirds from FNCs. Whilst those findings were based on patient pathway data and are not directly comparable to self-reported data, data from the survey showed that of those who had a call back from a FNC:
- 32% (n=119) said an appointment was booked at a MIU for them
- 3% (n=11) were advised to go to a MIU, but an appointment was not booked
- 22% (n=83) were advised to go to A&E (or an appointment was booked at A&E).
As noted below (section 5.4), of those who attended A&E or MIU, 41% (n=186) said they had a booked appointment
As with the NHS 24 111 call, the survey found a similarly high level of self-reported compliance with the action or advice given by the health professional at the end of the telephone/video consultation: 94% (n=351) said that they followed all the advice/action given by the health professional (Technical Report, Section 8, Table 25).
5.4 Experience of attending A&E or Minor Injuries Unit
Regarding the health concern they contacted NHS 24 111 about, 71% of respondents (n=459) reported that they attended A&E or MIU:
- 41% (n=266) went to an A&E department
- 30% (n=193) went to a MIU
The majority of respondents said the main reason they contacted A&E/MIU was because an appointment was booked for them (41%, n=186) or they were advised to go to A&E/MIU (41%, n=187) (Technical Report, Section 8, Table 28).
Understanding patients’ experiences of time waiting to be seen in A&E/MIU is important as previous research has shown A&E waiting times are associated with higher patient mortality, worse outcomes and poorer experiences[38],[39]. Overall 66% (n=306) of respondents who attended A&E or MIU said they did not have to wait, or had to wait but not for long to be seen. A significant difference was found in respondents’ reported waiting times to be seen, depending on whether they attended A&E or a MIU:
- 55% (n=144) of those who attended A&E said they did not have to wait, or had to wait but not for long to be seen
- 82% (n=158) of those who attended a MIU said they did not have to wait or had to wait but not for long to be seen.
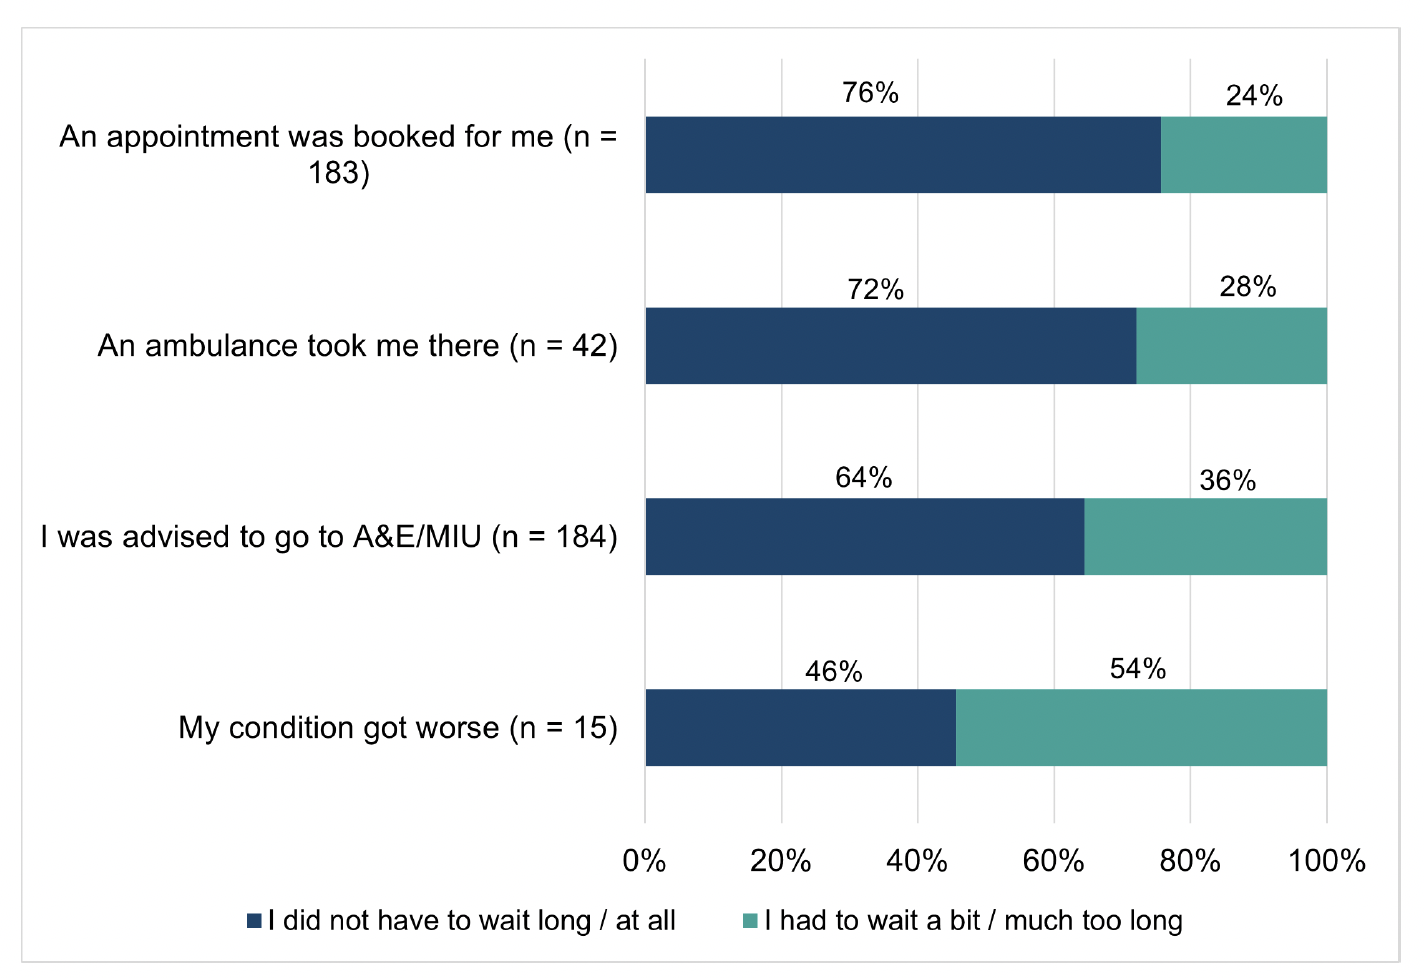
Previous research conducted with NHS Scotland staff found that people who were referred to A&E services with a scheduled time slot often joined the queue on arrival and experienced further delays to their care[40]. In contrast, the findings from this survey suggest that having a booked appointment corresponds to a reported shorter length of time waiting to be seen. As shown in Figure 5.12 for those who had an appointment booked for them at A&E or a MIU 76% felt they did not have to wait or had to wait but not for long. This was true for 64% of those who were advised to go to A&E or a MIU without an appointment. Of those who said the main reason for attending was because they had a booked appointment, a significantly higher proportion (76% n=141) said they did not have to wait, or had to wait but not for long to be seen compared to the combined total respondents to this question (66.5%).
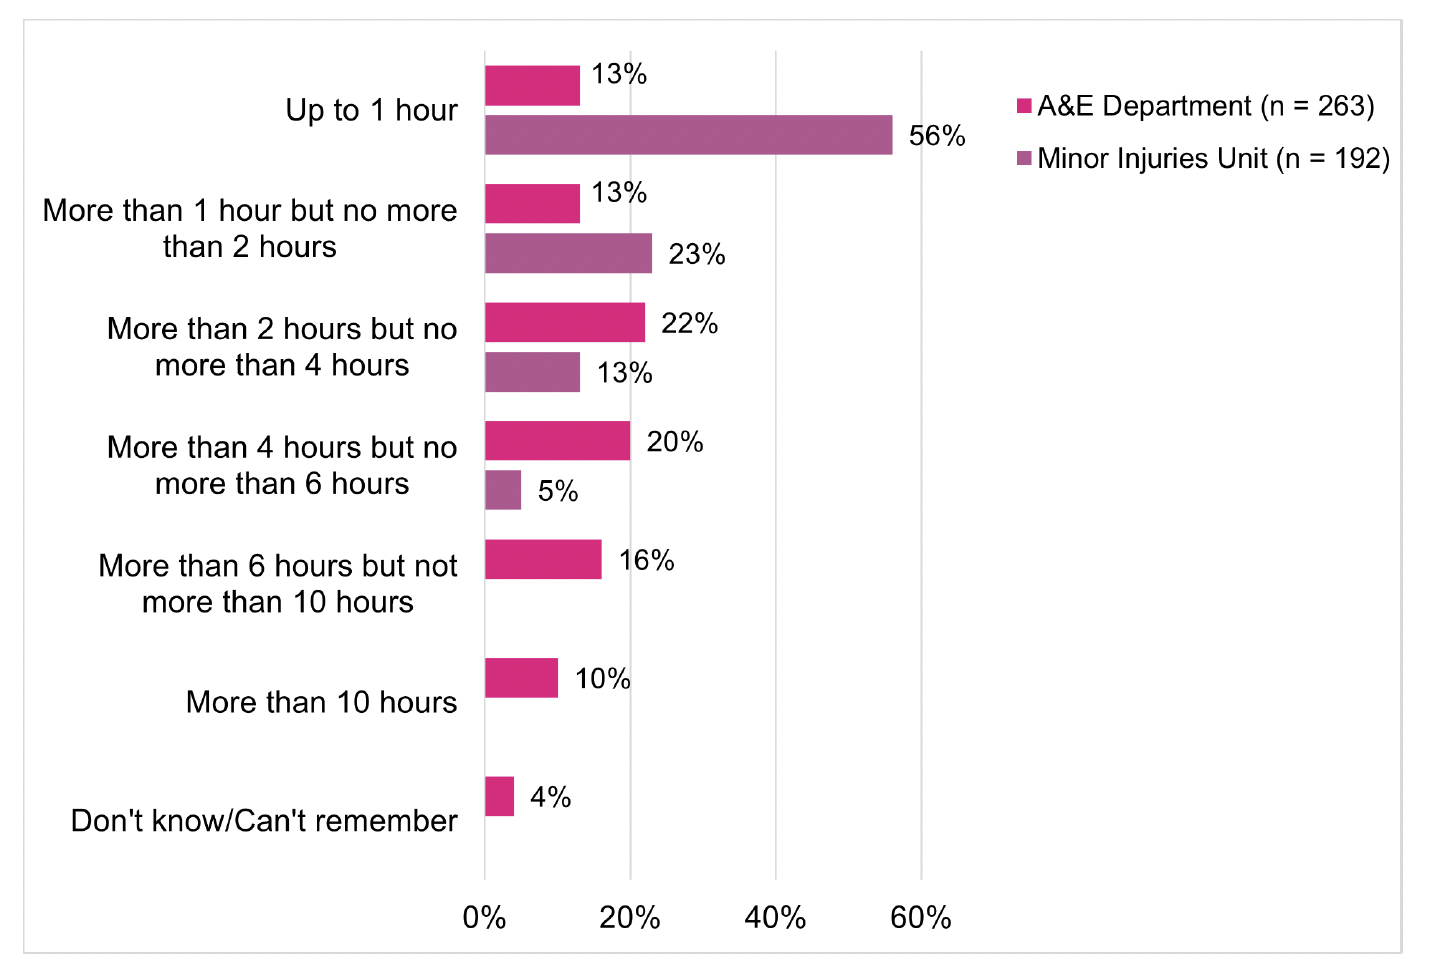
The national standard for A&E is that 95 percent of patients wait no longer than 4 hours from arrival to admission, discharge or transfer for A&E treatment[41]. The survey found that while 91% (n=175) of MIU attendances were reportedly concluded within four hours, 49% (n=128) of survey respondents who attended A&E reported that the overall length of their visit was within this access standard (Figure 5.13). Of those who attended MIU, 56% (n=107) reported their overall visit was less than one hour compared to 13% (n=34) who attended an A&E department. This difference may partly be explained by the variation in case-mix: those attending A&E are likely to have more serious or complicated health concerns that take longer to manage.
5.5 Experience of other services contacted
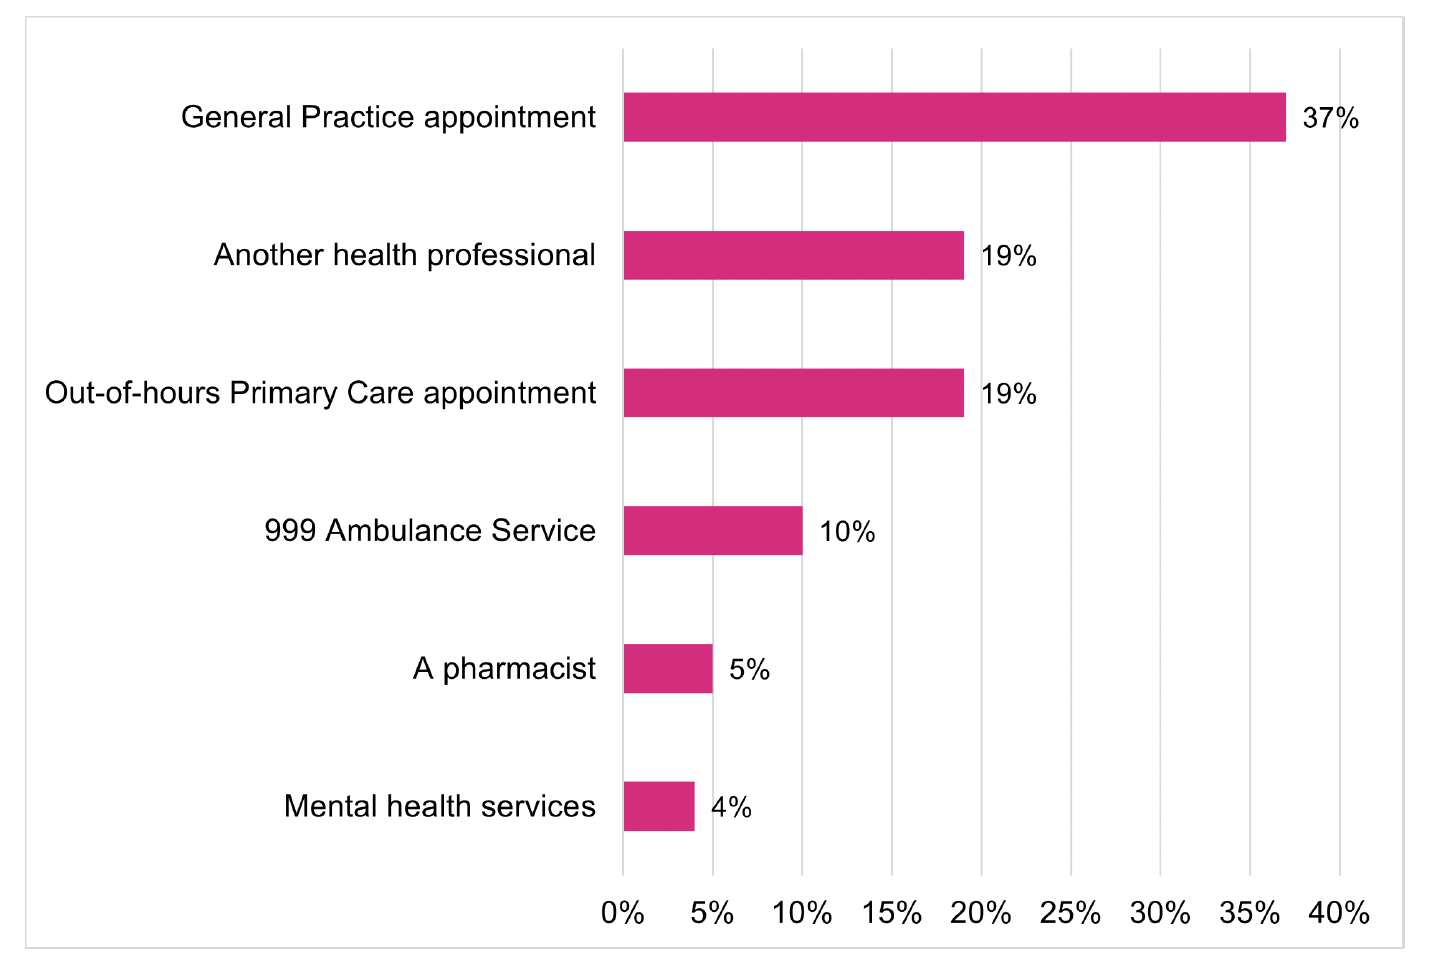
After contacting NHS 24 111, 36% (n=229) of respondents said they had contact with another service (other than a FNC call back and A&E/MIU). Of those respondents who had contacted another service after NHS 24 111, 37% (n=86) had contacted a General Practice, 19% another health professional (n = 44) and 19% (n =42) an out-of-hours primary care appointment (Figure 5.14).
The most common reasons reported by respondents for contacting one of the services were:
- 39% (n=90) were referred to this service or an appointment had been booked for them
- 25% (n=58) were advised to contact this healthcare professional or service
- 17% (n=40) reported that their condition had changed
Of those who had contacted another service, 63% (n=151) said they ‘definitely’ got the help they needed from the service, although 25% (n=60) said they only got this ‘to some extent’ indicating an area where patient experience could be improved.
5.6 Overall experiences of the RUC pathway
5.6.1. Patient experiences of overall measures
Respondents’ overall experiences of the urgent care pathway were mixed. A relatively higher number of respondents reported positive experiences in the following areas [42]:
- 82% (n=505) felt the number of different services or people that they contacted to get the most appropriate care or advice for their health concern was ‘about right’
- 73% (n=428) would ‘definitely’ call NHS 24 111 to access urgent care if they had the same health concern at the same time of day or night in the future
- 71% (n=436) felt that the length of time it took to get the most appropriate urgent care or advice for their health concern was ‘about right’, or was ‘quicker than expected’.
Lower proportions of respondents reported positive overall experiences in the following areas:
- Only 54% (n=220) of those respondents that had contacted more than one urgent care service felt they definitely worked well together
- 66% (n=422) rated their overall experience of urgent care services (from start to finish) as 8 or more out of 10 (where 10 indicates a very good experience).
There were no clear trends in respondents overall reported experiences by the day/time in which they contacted NHS 24 111.
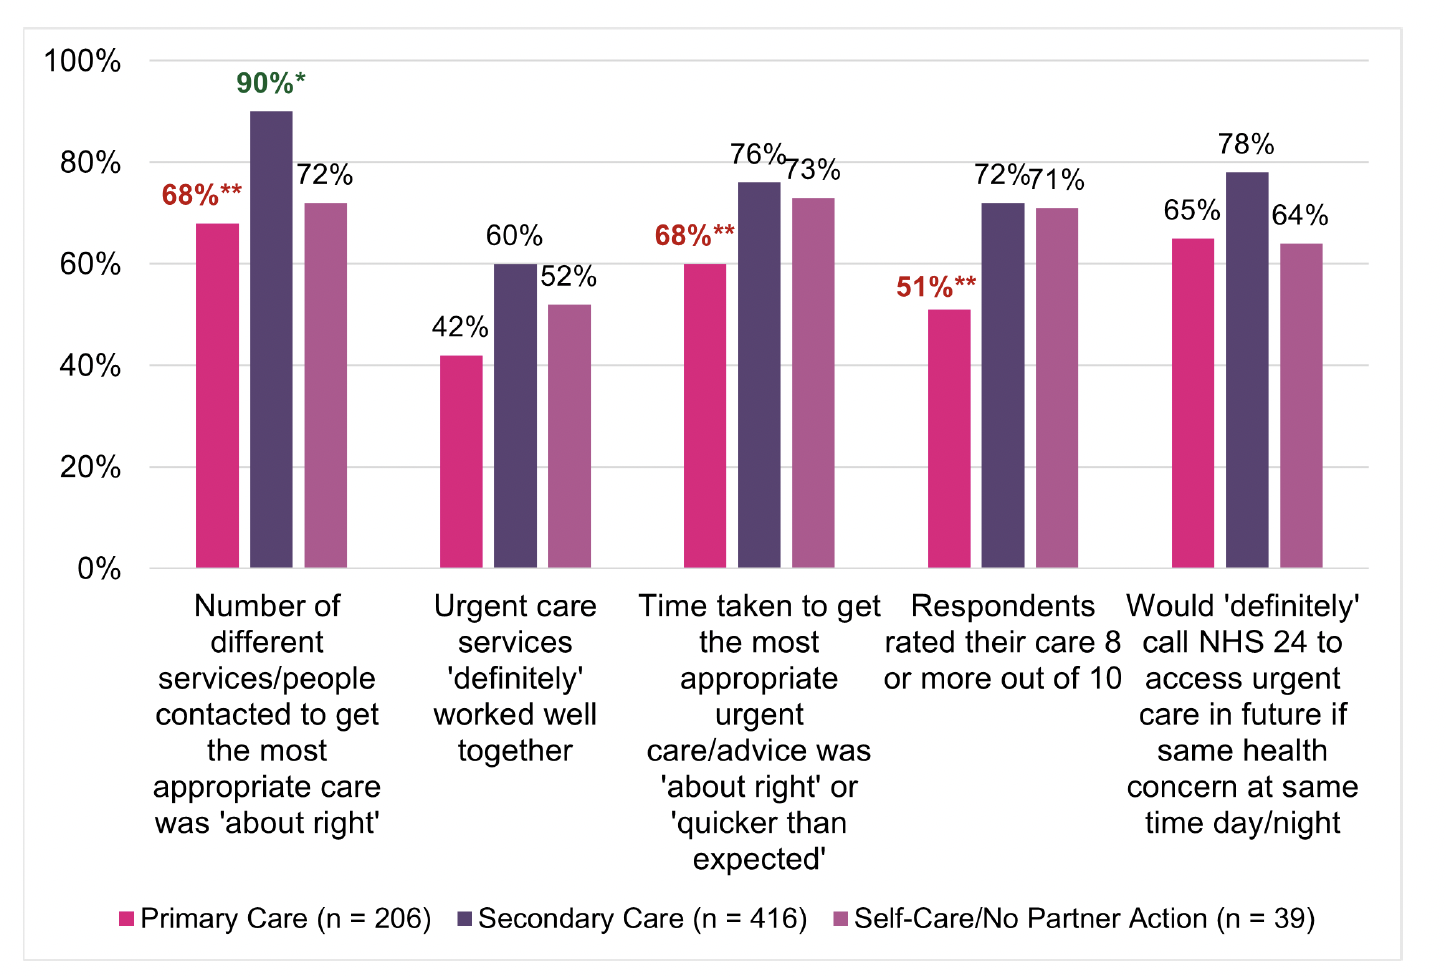
Differences were found in respondents overall experiences of the urgent care pathway by the NHS 24 111 recorded endpoint (Figure 5.15). Respondents that had a primary care endpoint were less positive about their overall experiences when compared with the sample overall. Some of these differences were shown to be statistically significant. Of those with a primary care endpoint, a significantly lower proportion reported the number of different services they contacted to get the most appropriate care was ‘about right’ (68%), the time taken to get the most appropriate urgent care advice was ‘about right’ or ‘quicker than expected’ (60%) and rated their experience of urgent care services as 8 or more out of 10 (51%). In contrast, respondents with a recorded secondary care endpoint were more positive about their overall experiences, particularly in terms of the number of different people/services contacted to get the most appropriate care; a statistically higher proportion (90%; n=350) reported the number of different services contacted was ‘about right’ when compared to the sample overall.
A more granular breakdown of NHS 24 111 endpoint by patient reported experience showed that when compared to the overall sample, respondents with a FNC endpoint reported significantly more positive experiences on four of the patient-experience measures, whilst those with an A&E/MIU endpoint were not significantly more positive on any of the patient experience-based measures in the survey (Technical Report, Section 8, Tables 42 to 45)[43]. Those with an endpoint to contact their General Practice reported significantly more negative experiences at seven questions (Technical Report, Section 8, Tables 42 to 45) when compared to the overall sample. For example, whilst 81% (n=195) of those respondents with a FNC endpoint would ‘definitely’ call NHS 24 111 in the future if they had the same health concern, this was only the case for 54% (n=33) of those with ‘contact GP’ endpoint and 35% (n=5) of those with a ‘GP telephone advice’ endpoint.
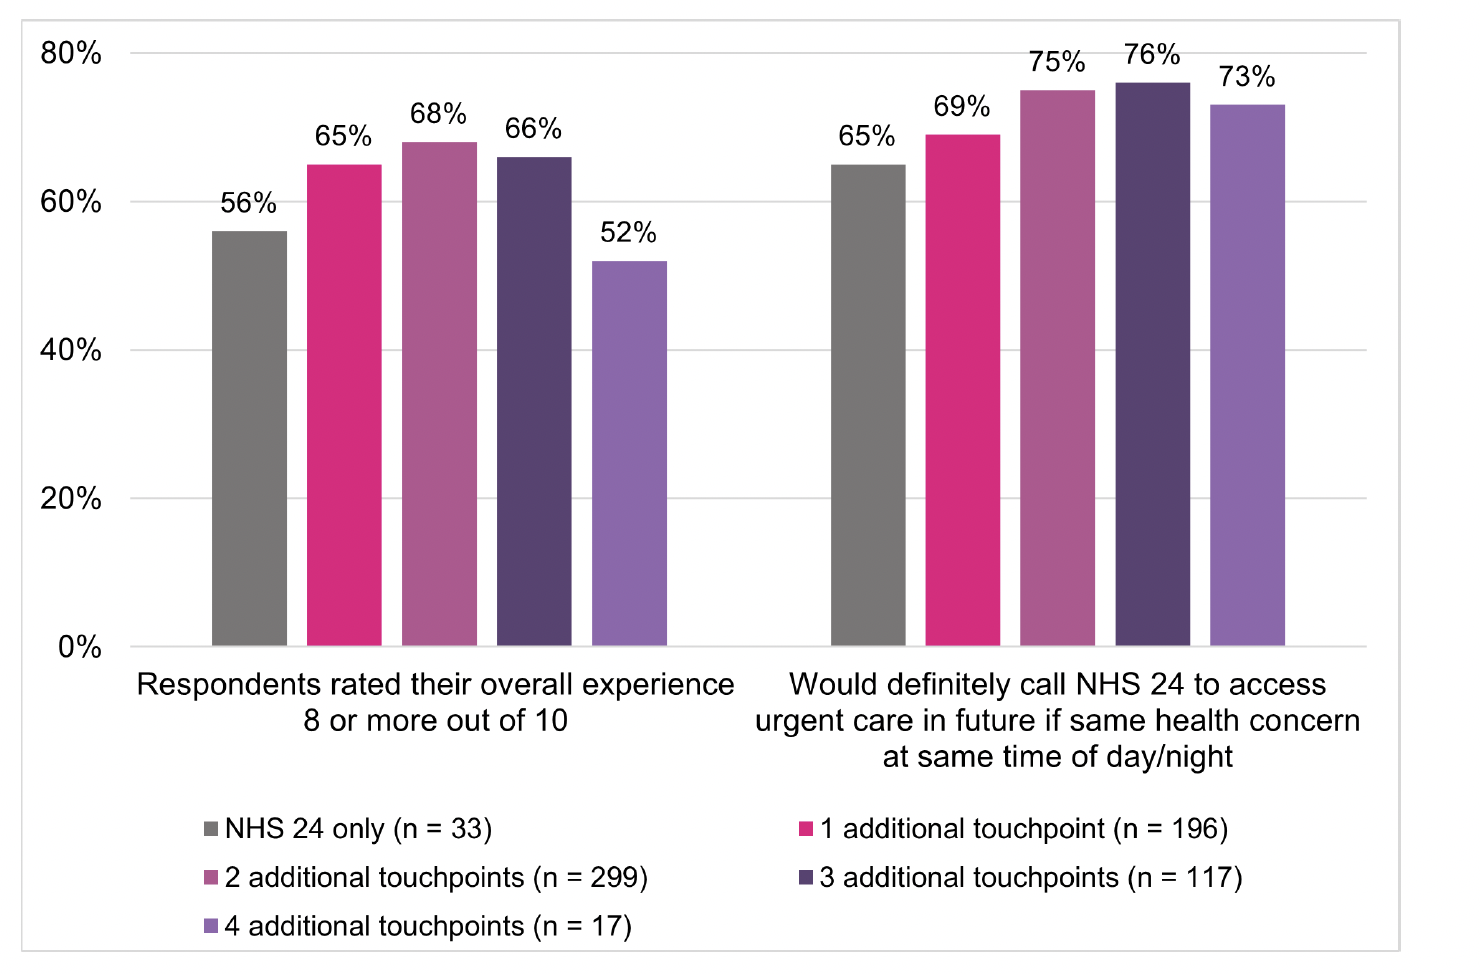
Almost all respondents (96%, n=638) had contacted at least one other service before and/or after calling NHS 24 111 (Technical Report, Section 8, Table 46)[44]. A significantly higher proportion of those who only had contact with NHS 24 (93%) reported that the time taken to get the most appropriate care or advice was ‘about right’, or ‘quicker than expected’ when compared to the sample overall. Perhaps unsurprisingly, respondents that had accessed or contacted four different services in addition to NHS 24 111 were significantly less positive about the number of services contacted to get the most appropriate care/advice (39%) and the length of time it took to get this care/advice (34%) when compared to the sample overall (Figure 5.16). Please note, there is no data for those respondents that accessed NHS 24 111 only to the question on how well urgent care services worked together as they only accessed one service.
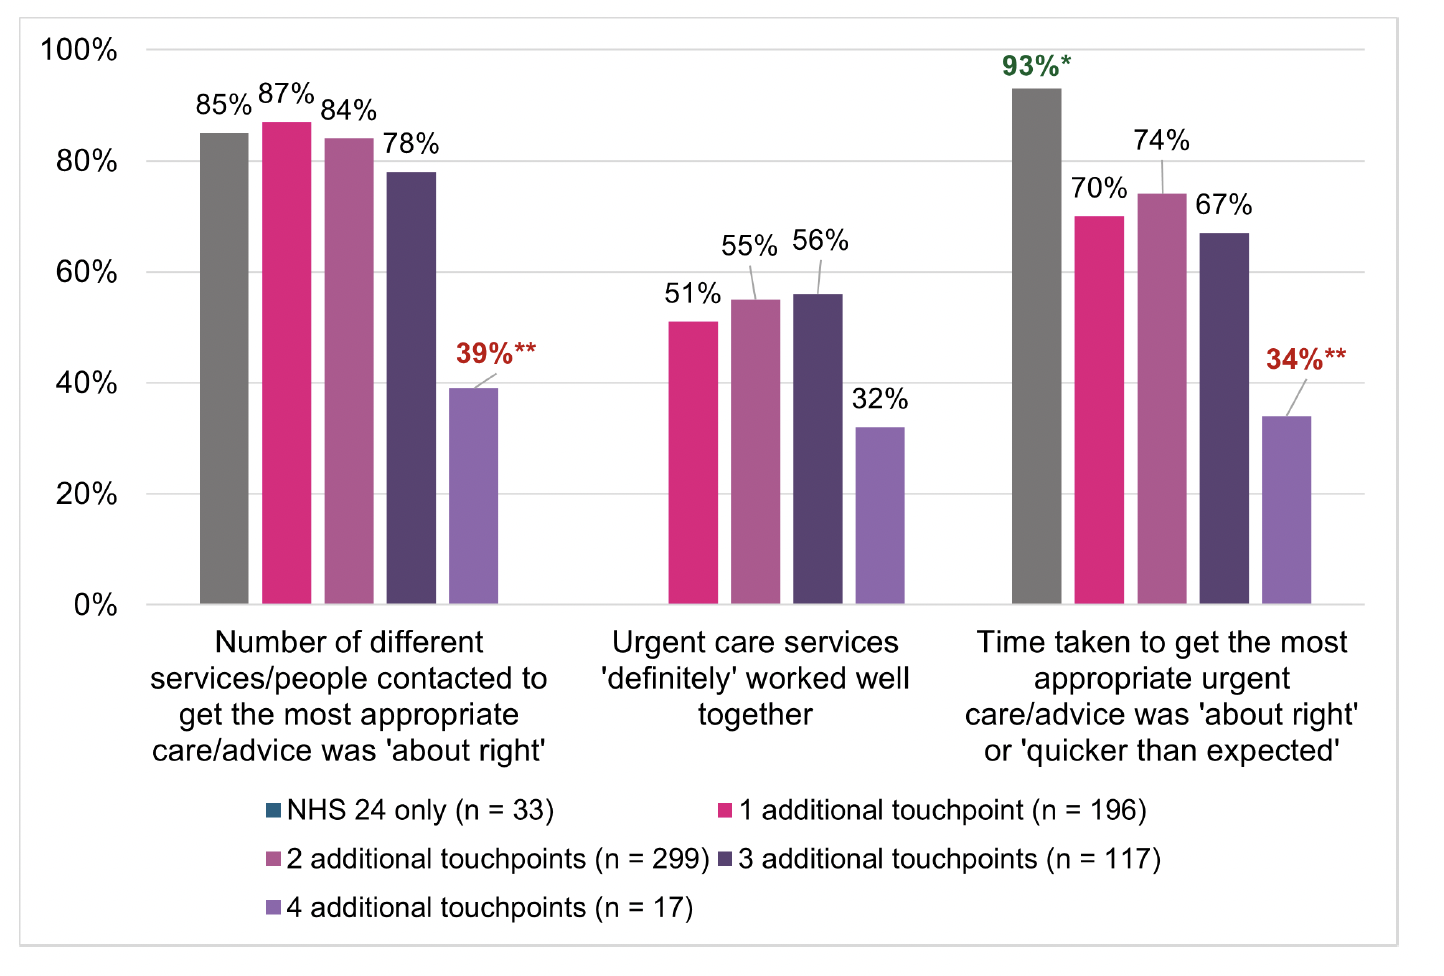
A smaller proportion (52%) of those who had accessed or contacted four different services in addition to NHS 24 111 also rated their overall experience of urgent care 8 or more out of 10 when compared to those that had fewer touchpoints. This was not a significant difference and a relatively high proportion (73%; n=13) said they would ‘definitely’ call NHS 24 111 in the future if they had the same health concern at the same time of day/night (Figure 5.17). This suggests that future intentions to use NHS 24 111 may not be impacted by views about how many services were contacted and how long it took to get the most appropriate care.
5.6.2. Patient self-reported health experience
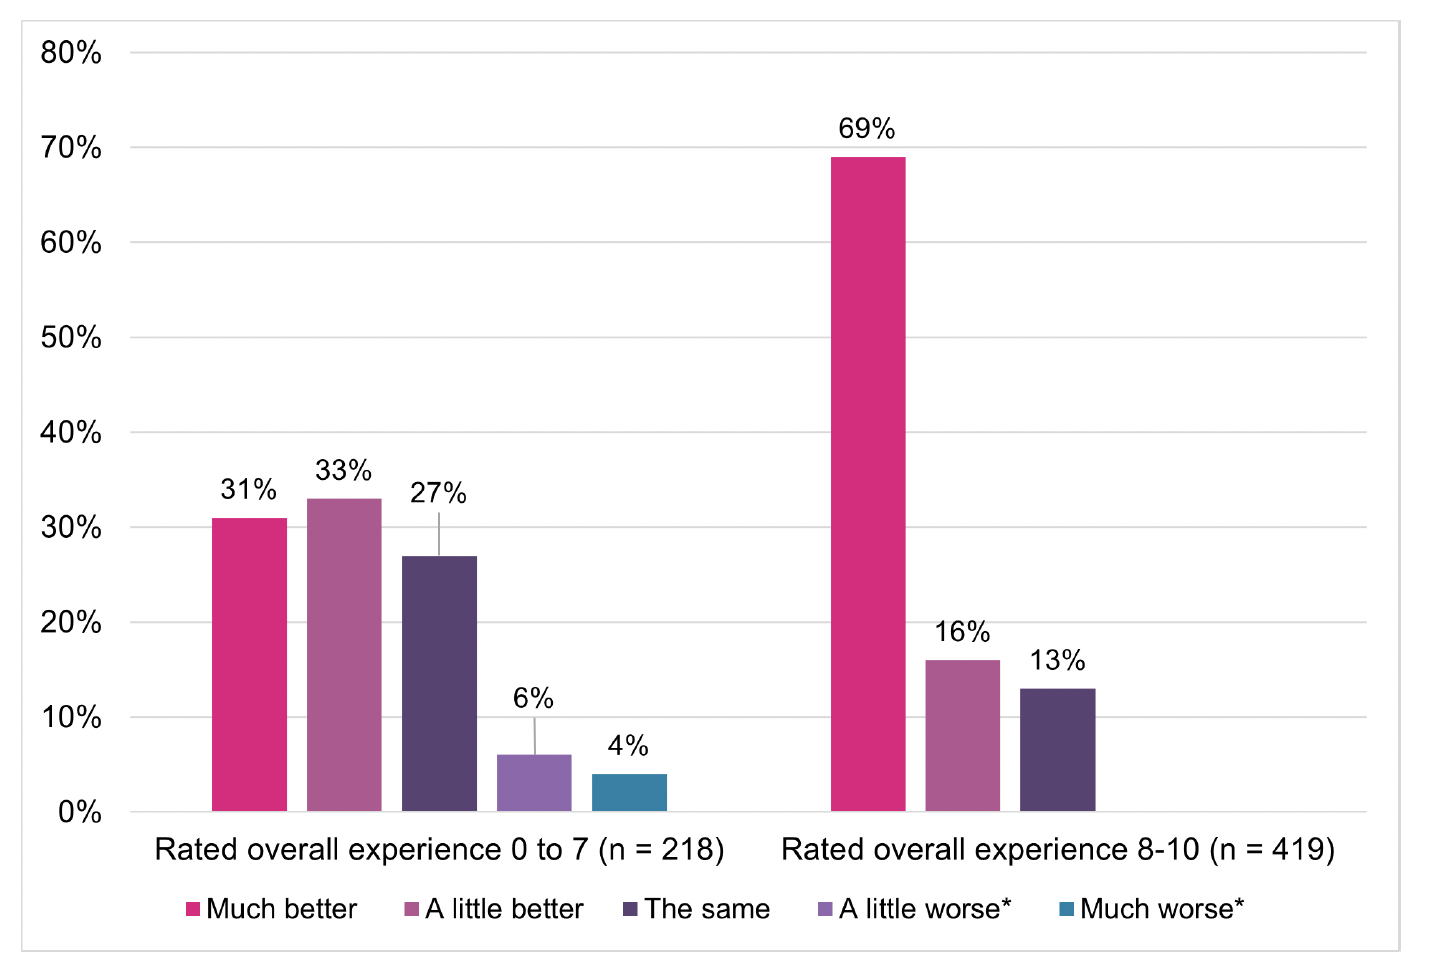
Just over half the respondents (56%; n=363) rated their health as being ‘much better’ as a result of accessing urgent care services, with a further 22% (n=139) reporting it was ‘a little better’ (Technical Report, Section 8, Table 38). Respondents who rated their overall experience of urgent care services as 8 or more out of 10 were more likely to rate their health as being ‘much better’ (69%) as a result of accessing urgent care services when compared to those who gave a lower rating (0 to 7) of their overall experience (31%) (Figure 5.18).
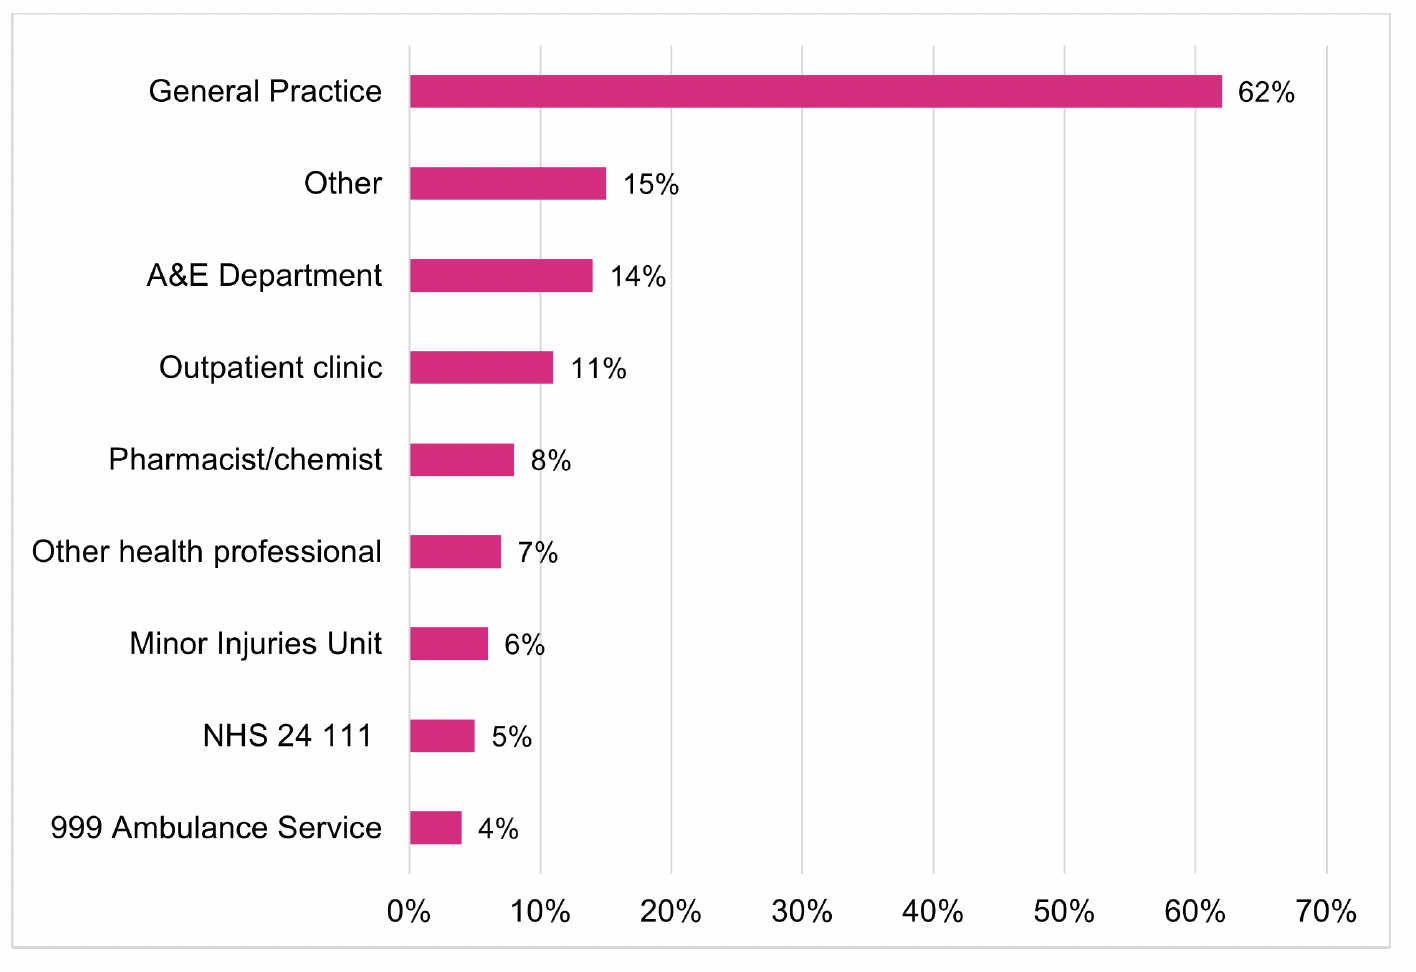
The results of the survey showed that 35% (n=226) of respondents reported accessing health services for the same health concern within 7 days of contacting NHS 24 111 (Technical Report, Section 8, Table 40). As shown in Figure 5.19, of these respondents, most (62%; n=139) had contacted a General Practice, but one in five had either accessed A&E (14%; n=32) or a MIU (6%; n=14).
5.7 Comparing overall experiences from both the Patient Survey and the Discontinued Caller survey
Of the respondents who did access urgent care services following their discontinued NHS 24 111 call, half (52%; n=201) rated their health as being either a ‘little’ or ‘much’ better as a result of accessing urgent care services (Technical Report, Section 5, Table 20). In contrast 78% (n=502) of those who accessed the RUC pathway via NHS 24 111 reported this (i.e. the Patient survey respondents; see section 5.6.2).
It was observed that the majority of respondents in both the Discontinued Caller survey (n = 301; 85%) and Patient survey (n = 525; 89%) said they would ‘definitely’ or ‘maybe’ contact NHS 24 111 again in the future if they had the same problem at the same time of day/night. Although, whilst 40% (n=144) of respondents to the Discontinued Caller survey said they would ‘definitely’ call NHS 24 111 again in the future if they had the same problem at the same time of day/night (Technical Report, Section 5, Table 21), this was the case for 73% (n=428) of respondents to the Patient survey whose call to NHS 24 111 was answered (see section 5.6.1)[45].
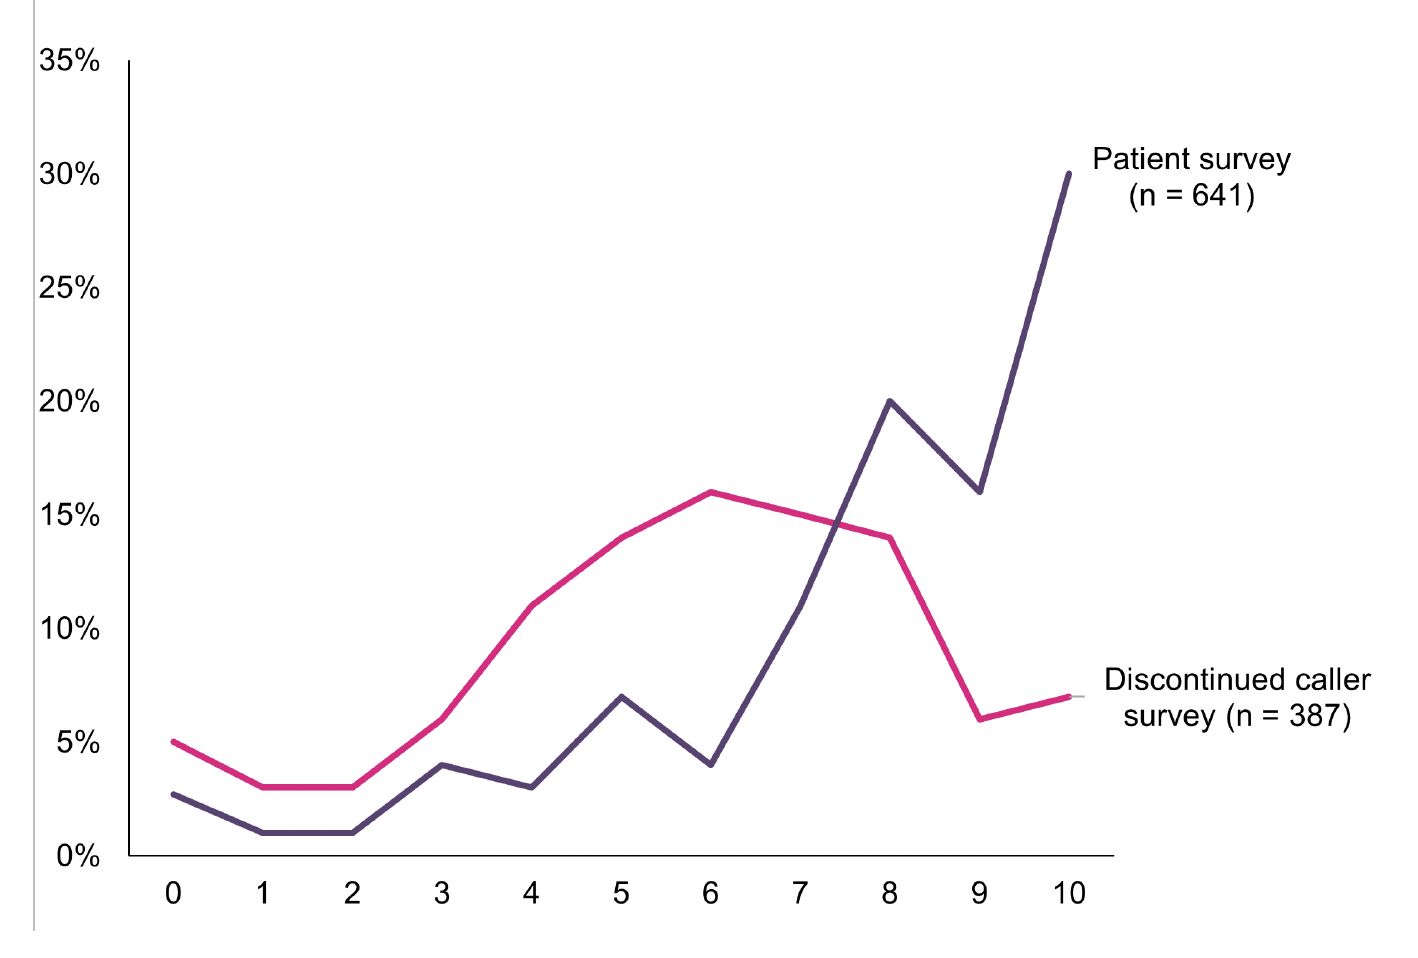
Figure 5.20 compares respondents’ overall rating of their contact with urgent care services between this survey (where respondents’ calls to NHS 24 111 were answered between March and April 2024) and the Discontinued Caller survey (where respondents’ discontinued a call to NHS 24 111 up to 6 months before February/March 2024). The figure shows that a higher proportion of respondents who accessed the pathway via NHS 24 111 (66%) gave a rating of 8 or more out of 10 when compared to the respondents to the Discontinued Caller survey (28%). Whilst 17% of respondents (n=64) to the Discontinued Caller survey rated their experience with urgent care services as 3 or less out of 10 (Technical Report, Section 5, Table 22), this was the case for 10% (n=61) of respondents to the Patient survey (Technical Report, Section 8, Table 37).
Contact
Email: dlhscbwsiawsiaa@gov.scot
There is a problem
Thanks for your feedback