Health - redesign of urgent care: evaluation - main report
The Redesign of Urgent Care pathway aims to improve patients’ access to urgent care. The evaluation captured patient and staff experiences of the pathway and analysed key urgent care delivery metrics, enhancing our understanding of what is working well and areas for improvement.
7. Findings from analysis of existing data
This section outlines the results of the analysis of the delivery metrics at national and Health Board level. For the analysis presented at national level it should be noted that the results should be interpreted as the relative differences between the observed metrics after January 2022 and their counterfactual ( i.e. hypothetical metrics if the trends in the pre-period had been projected forward to the after January 2022 period) and may not directly mirror simple comparisons or trends of these metrics pre- and post-RUC pathway implementation. For the results presented at Health Board level as set out fully in Section 3.4, delivery metrics for each Health Board were compared with one or more ‘control’ Health Board(s). These were identified for each delivery metric based on similar trends during the pre-implementation period (2018 to 2019). As specified in section 3.4, for the analyses at national and Health Board level causation of any change between these comparators cannot be conclusively determined, and is likely to have been driven by several factors, including but not limited to the introduction of RUC.
7.1 Delivery metrics identified
As set out fully in Section 3.4.2, Urgent Care delivery metrics were selected on the basis of the one-to-one interviews, assessment of published literature and availability of data. All selected delivery metrics were included as dependent variables in the Interrupted Time-Series analysis at national and Health board level.
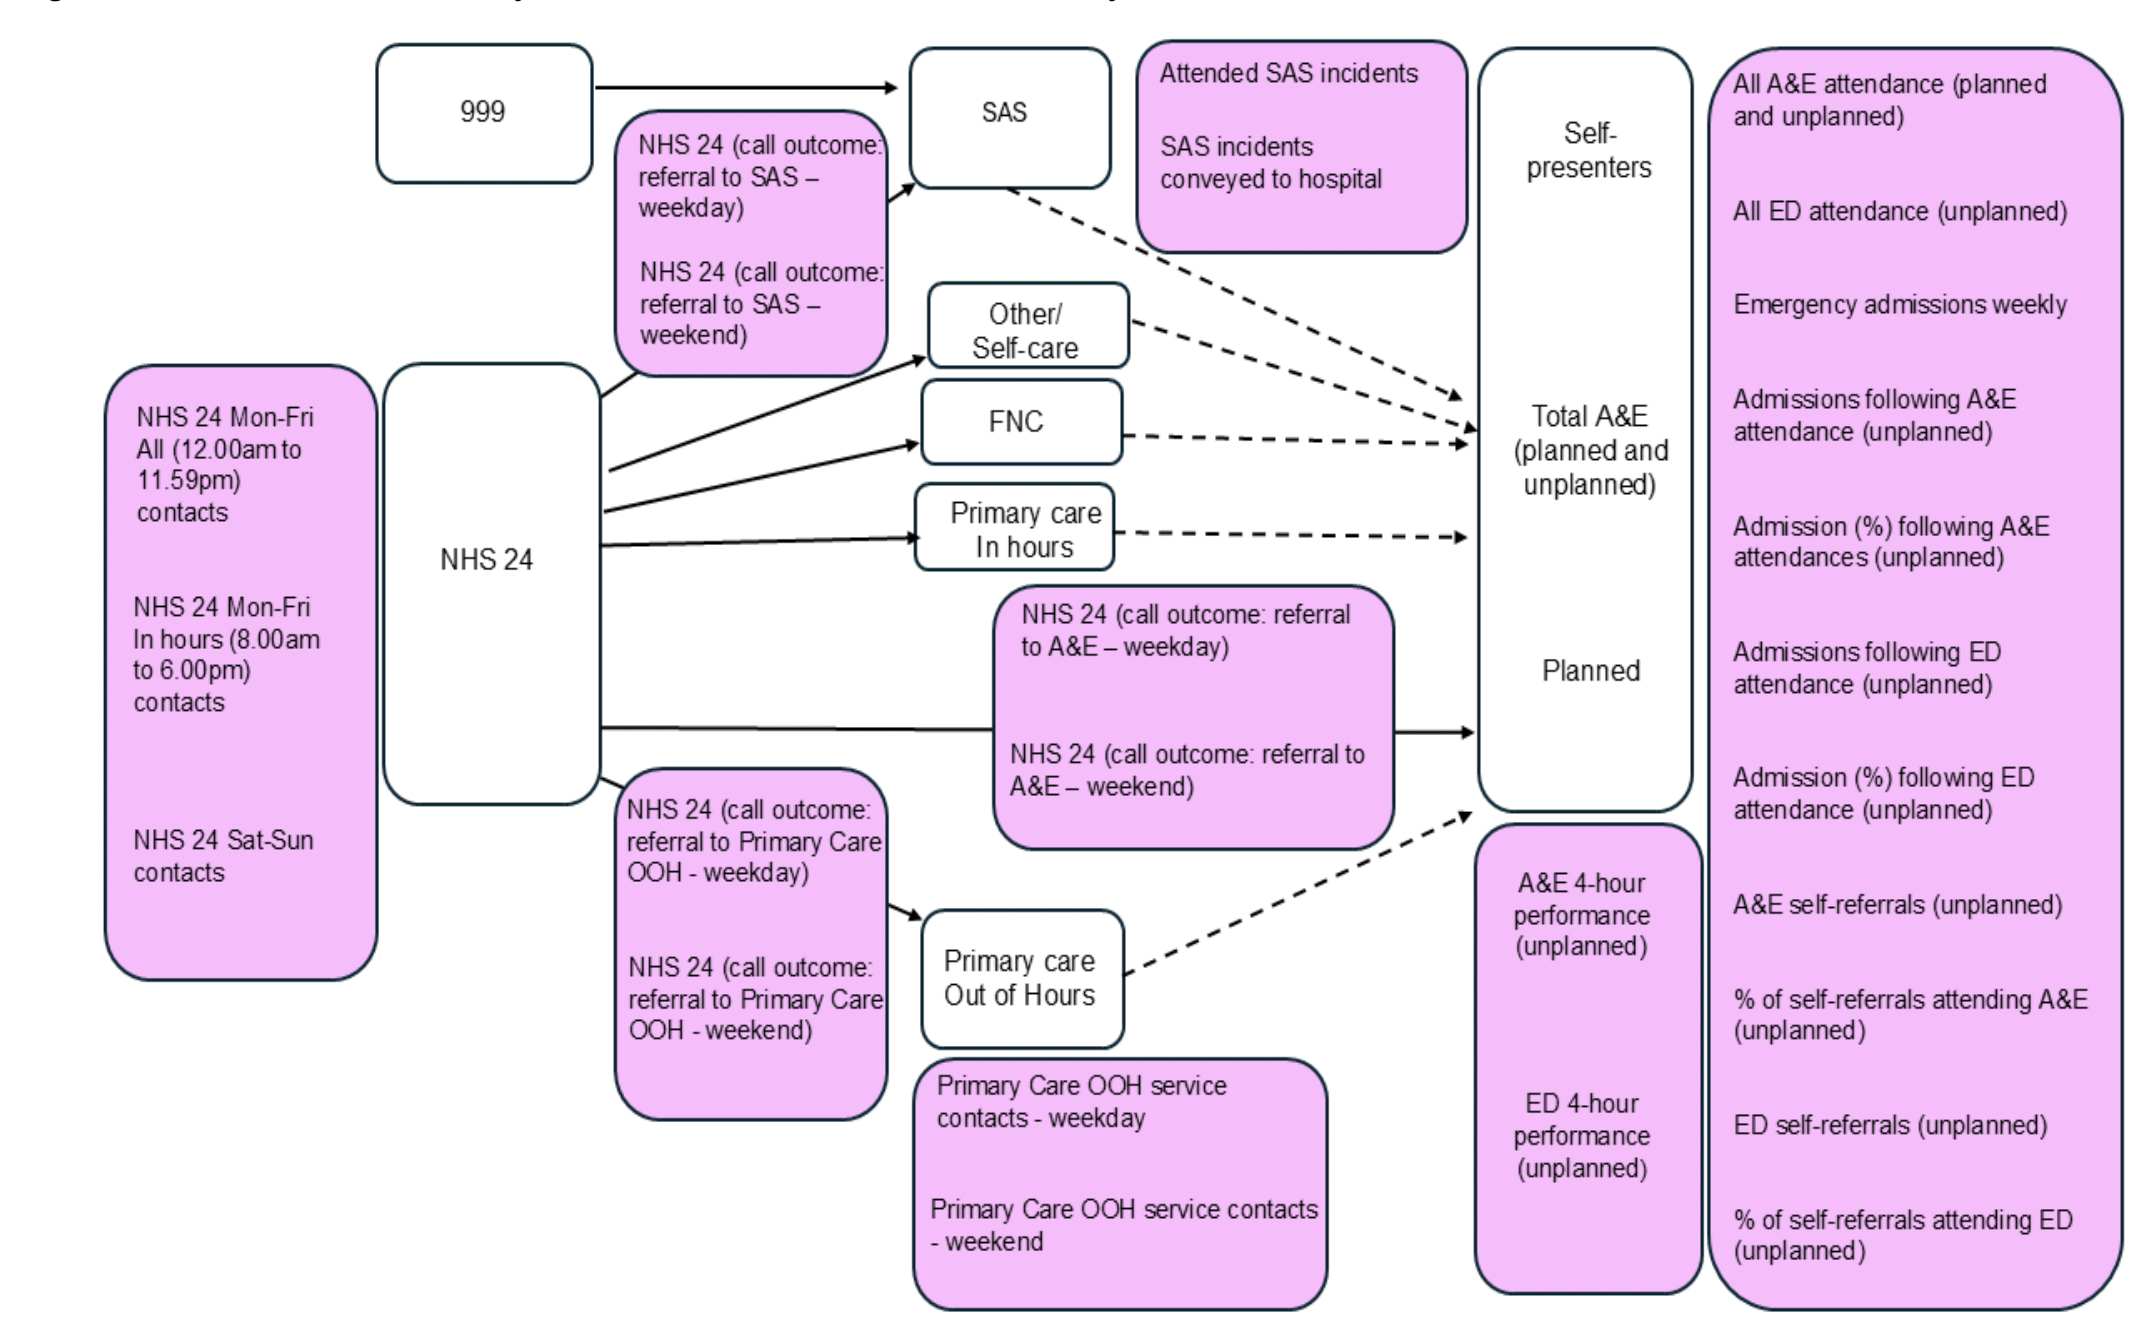
Delivery metrics selected for the Interrupted Time Series Analysis are listed below with Figure 7.1 offering a visualisation of how the delivery metrics align to the RUC pathway.
The delivery metrics included as dependent variables were:
- All A&E[52] attendance (planned and unplanned)
- All ED attendance (unplanned)
- Emergency admission weekly (unplanned)
- Admissions following A&E attendance (unplanned)
- Admission (%) following A&E attendances (unplanned)
- Admissions following ED attendance (unplanned)
- Admission (%) following ED attendances (unplanned)
- All A&E Self-Referrals (unplanned)
- % of Self-Referrals attending A&E (unplanned)
- ED Self-Referrals (unplanned)
- % of Self-Referrals attending ED (Unplanned)
- NHS 24 111 Monday to Friday: All (12.00am to 11.59pm) contacts
- NHS 24 111 Monday to Friday: In Hours (8.00am to 6.00pm) contacts
- NHS 24 111 Saturday to Sunday contacts
- NHS 24 111 (call outcome: referral to A&E - weekday)
- NHS 24 111 (call outcome: referral to A&E – weekend)
- NHS 24 111 (call outcome: referral to Primary Care Out of Hours - weekday)
- NHS 24 111 (call outcome: referral to Primary Care Out of Hours – weekend)
- NHS 24 111 (call outcome: referral to SAS - weekday)
- NHS 24 111 (call outcome: referral to SAS - weekend)
- Primary Care Out of Hours services[53] contacts - weekday
- Primary Care Out of Hours services contacts - weekend
- Attended SAS incidents
- SAS incidents conveyed to hospital
- All A&E 4-hour performance (unplanned)
- ED 4-hour performance (unplanned)
7.2 Analysis of delivery metrics at national level
At national level, single group Interrupted Time Series Analysis was conducted to assess the changes to key Urgent Care delivery metrics, comparing the trends in delivery metrics pre- and post- implementation of the RUC pathway. Specifically, the analytical approach compared data from a 2 year period post RUC implementation (January 2022 to December 2023) with a projected position based on trends during 2018 to 2019 (pre RUC implementation). For each delivery metric, this offers a comparison between actual state of play during the period January 2022 to December 2023 with a counterfactual state of play at the same time point, based on a scenario where there is continuation of baselines trends from 2018 and 2019.
As specified at the start of this section, it is important to note that causation of any change between these comparators cannot be conclusively determined, and is likely to have been driven by several factors, including but not limited to the introduction of RUC. Such factors will notably include impacts of the COVID-19 pandemic, some of which is not yet quantifiable.
Absolute differences and relative differences in delivery metrics between a “standardised” year[54] pre and post RUC implementation are displayed in Figure 7.2. Note that some delivery metrics are proportionate measures, for example “Admission (%) following A&E Attendances (Unplanned)”. For proportionate measures, absolute difference is presented in relation to percentage point differences. For example, for a proportionate measure, a relative change from 50% to 45% would be represented as an absolute difference of -5, and a relative difference of -10%.
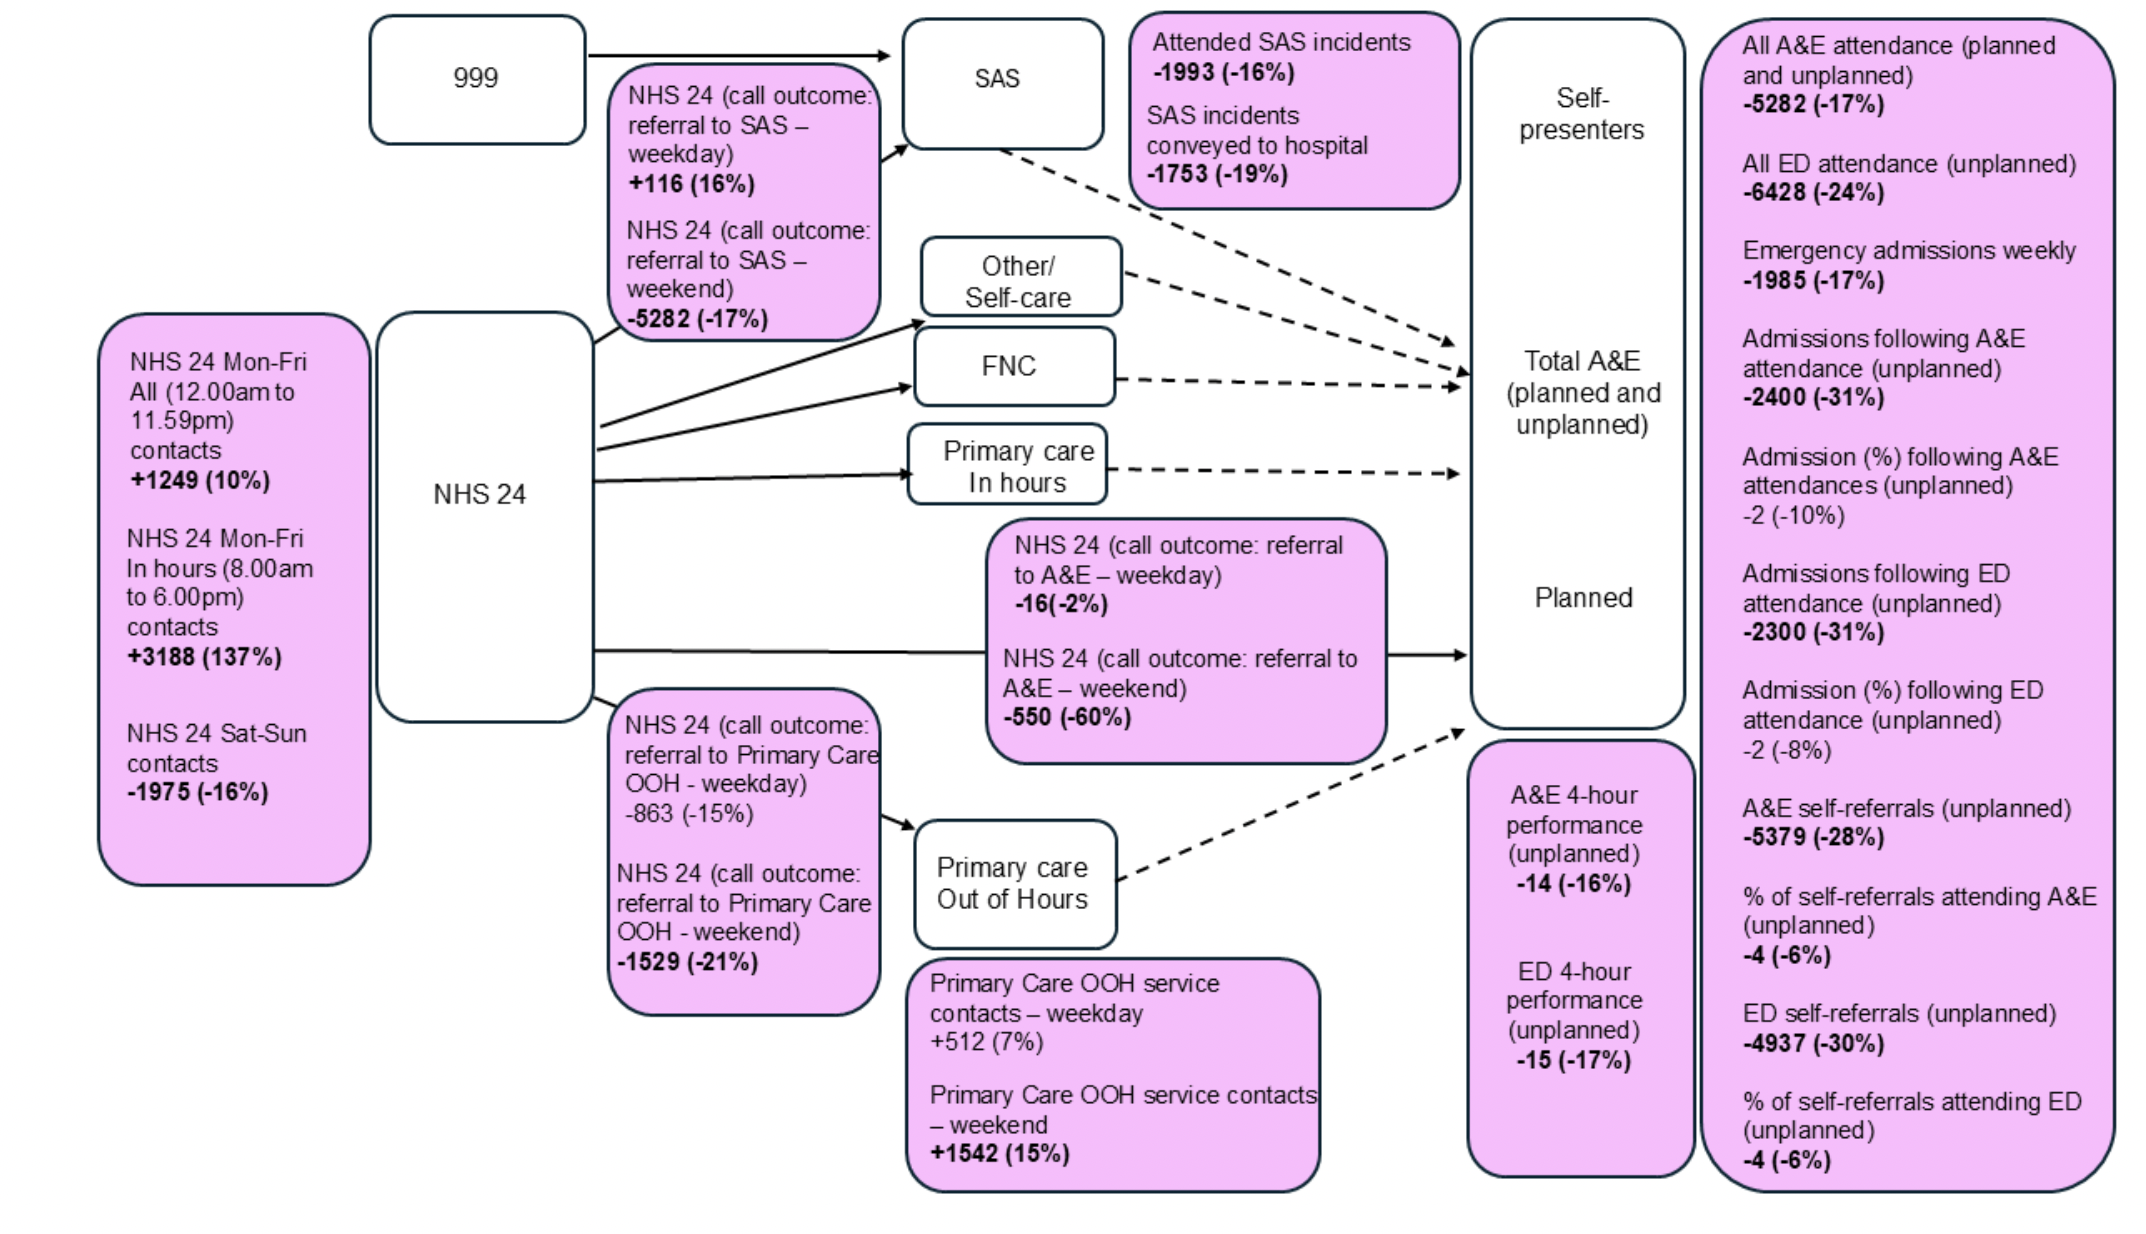
Listed below are delivery metrics where analysis at a national level found that change between the observed 2 year period post RUC implementation (January 2022 to December 2023) and the projected position during the same time period (based on continuation of trends during 2018 to 2019 - pre RUC implementation) were statistically significant:
Number of NHS 24 111 contacts:
- All weekday NHS 24 111 contacts (12:00am – 11:59pm) increased (absolute difference = +1,249, relative difference = 10%)
- In-hour weekday NHS 24 111 contacts (8:00am – 6:00pm) increased (absolute difference = +3,188, relative difference = 137%)
- The number of NHS 24 111 weekend contacts reduced post-implementation of the RUC (absolute difference = -1,975, relative difference = -16%).
NHS 24 111 call outcomes:
- Weekday NHS 24 111 call referrals to SAS increased (absolute difference = +116, relative difference = 16%)
- Weekend NHS 24 111 call referrals to SAS reduced (absolute difference = -5,282, relative difference = -17%)[55]
- Weekday NHS 24 111 call referrals to A&E were reduced (absolute difference = -16, relative difference = -2%)
- Weekend NHS 24 111 call referrals to A&E were reduced (absolute difference = - 550, relative difference = -60%)
- Weekend NHS 24 111 call referrals to Primary Care Out of Hours were reduced (absolute difference = - 1,529, relative difference = -21%).
Service use:
- Weekend Primary Care Out of Hours service use increased (absolute difference = 1,542, relative difference = 15%)
- SAS attended incidents were reduced (absolute difference = -1,993, relative difference = -16%)
- The number of SAS incidents conveyed to hospital was reduced (absolute difference = -1,753, relative difference = -19%)
- All A&E attendances (planned and unplanned) were reduced (absolute difference = -5,282, relative difference = -17%)
- All ED attendances (unplanned) were reduced (absolute difference = -6,428, relative difference = - 24%)
- Emergency admissions (weekly) were reduced (absolute difference = -1,985, relative difference = -17%)
- Admissions following A&E attendance were reduced (number of admissions; absolute difference = -2,400, relative difference = -31%)
- Admissions following ED attendance were reduced (number of admissions; absolute difference = -2,300, relative difference = - 31%)
- Self-referrals[56] to A&E (unplanned) were reduced (number of self-referrals: absolute difference = -5,379, relative difference = -28%; percentage of self-referrals attending: absolute difference = -4, relative difference = -6%)
- Self-referrals to ED (unplanned) were reduced (number of self-referrals: absolute difference = - 4,937, relative difference = - 30%; percentage of self-referrals attending: absolute difference = -4, relative difference = -6%).
Patient experience:
- A&E waiting time (unplanned) – identified through the proportion of patients meeting four-hour access standard– worsened (absolute reduction = -14%, relative difference = -16%)
- ED waiting time (unplanned) – identified through the proportion of patients meeting four-hour access standard – worsened (absolute reduction = -15%, relative reduction = -17%).
The analysis of the delivery metrics at a national level indicated a relative reduction of unplanned services, while there were indications of a relative increase in NHS 24 111 in-hours contacts. This increase in NHS 24 111 in-hours contacts suggests that individuals are increasingly accessing the service when other services are available. Despite relative reductions in use of urgent care compared to the projected volumes, the analysis also indicated that the proportion of patients waiting more than 4 hours in A&E had increased as performance on the four-hour access standard worsened. It is important to note that these results may not directly mirror simple comparisons or trends of these metrics pre- and post-RUC pathway implementation.
7.3 Analysis of delivery metrics at Health Board level
This section outlines the results of the Interrupted Time Series Analysis of existing data at Health Board level.
As noted at the start of this section and set out fully in Section 3.4, at a Health Board level, the delivery metrics for each Board were compared with one or more ‘control’ Board(s), which were identified for each delivery metric based on similar trends during the pre-implementation period (2018 to 2019). It must be noted however that for many of the delivery metrics (specifically those based on absolute numbers, e.g. unscheduled hospital admissions) it was not possible to identify a suitable ‘control’ Health Board for NHS Greater Glasgow and Clyde, given the far greater populace serviced by this Board. As such, the Health Board level Interrupted Time Series Analysis does not provide findings for NHS Greater Glasgow and Clyde for these delivery metrics.
In this analysis, set out comprehensively in Section 3.5.3 of the Technical Report, change is calculated as relative differences of the annualised difference pre- and post- intervention. Relative difference, when presented throughout this section, reflects the change for each Health Board relative to their ‘control’ Health Board(s), for each delivery metric. ‘Control’ Health Board(s) could differ for each delivery metric. The relative difference presented reflects a ‘difference in difference’, and does not indicate an increase or decrease in real terms, only an increase or decrease relative to the ’control’ board(s). For example, if Health Board A observes a decrease in a particular delivery metric, but its ‘control’ boards show a greater decrease, the relative difference for Health Board A would be presented as an increase (i.e. a positive value). For this reason and others, it should not be interpreted that a sum of relative differences for all Boards is reflective of relative differences at a national level.
Again, causation behind a relative divergence of a delivery metric within a Health Board away from another or others with similar trends during the pre-period cannot be conclusively determined, and may have been driven by several factors, including but not limited to the introduction of RUC.
For all findings at Health Board level, please see Section 9, Tables 1 to 5 of the Technical Report. For each indicator, tables 1 to 5 (Technical report, Section 9) present the change across the two time periods defined in the Interrupted Time Series Analysis for each health board, relative to their ‘control’ health board(s). Given the extensiveness of the findings presented in Tables 1 to 5 included in Section 9 of the Technical report, a summary of the key findings where a statistically significant difference was observed are presented below.
Outcomes where significant differences were found, by Health Board were:
- Absolute number of admissions following A&E attendance (unplanned)
- Relative decrease observed in Western Isles (-35%)
- Proportion of admissions following A&E attendance (unplanned)
- Relative decrease observed in Lothian (-50%), Borders (-25%) and Greater Glasgow and Clyde (-21%)
- Relative increase observed in Shetland (48%) and Western Isles (1%)
- Absolute number of admissions following ED attendance (unplanned)
- Relative decrease observed in Western Isles (-39%)
- Proportion of admissions following ED attendance (unplanned)
- Relative decrease observed in Western Isles (-23%)
- Relative increase observed in Borders (29%) and Highland (20%)
- Proportion of Self Referrals attending A&E (unplanned)
- Relative increase observed in Dumfries and Galloway (28%)
- Proportion of Self Referrals attending ED (unplanned)
- Relative decrease observed in Forth Valley (-12%) and Borders (-4%)
- Relative increase observed in Dumfries and Galloway (37%) and Fife (27%)
- Absolute number of NHS 24 111 Mon - Fri: In Hours contacts
- Relative decrease observed in Highland (-116%) and Lothian (-53%)
- Absolute number of NHS 24 111 (call outcome: referral to A&E - weekday)
- Relative increase observed in Borders (896%; this large relative difference was driven by the very low pre-intervention value
- Proportion of all A&E attendees waiting 4+ hours (unplanned)
- Relative increase observed in Lothian (76%), Forth Valley (48%), Ayrshire and Arran (43%), Western Isles (33%) and Grampian (4%)
- Relative decrease observed in Borders (-2%)
- Proportion of ED attendees waiting 4+ hours (unplanned)
- Relative increase observed in Western Isles (38%) and Borders (1%)
The analysis of changes to key Urgent Care delivery metrics at pre and post RUC implementation at Health Board level presented very few statistically significant differences, relative to all the findings provided in Tables 1 to 5 in Section 9 of the Technical report. This indicates that there were minor deviations in the individual performance of Health Boards relative to those with similar pre-trends.
Contact
Email: dlhscbwsiawsiaa@gov.scot
There is a problem
Thanks for your feedback